
An Introduction to Ground Penetrating Radar
We were pleased with the success of our biennial training event that was held in October in collaboration with our supplier Proceq. We hope that the attendees found it valuable and were impressed with the new Proceq GPR Live. We had this new product on display at our exhibition at the Concrete 2017 Conference.
Pulsed vs Stepped Frequency Radar
GPR uses radio waves to pick up changes in the dielectric properties inside the ground. This technology makes use of a transmitter and receiver sending and receiving radio waves into the substrate. The waves are reflected when the wave hits a boundary or object.
More specifically, this reflection is due to a change in the dialectic constant. Dielectric constant is a dimensionless number relating to the charge that a material can hold when exposed to an electric field.
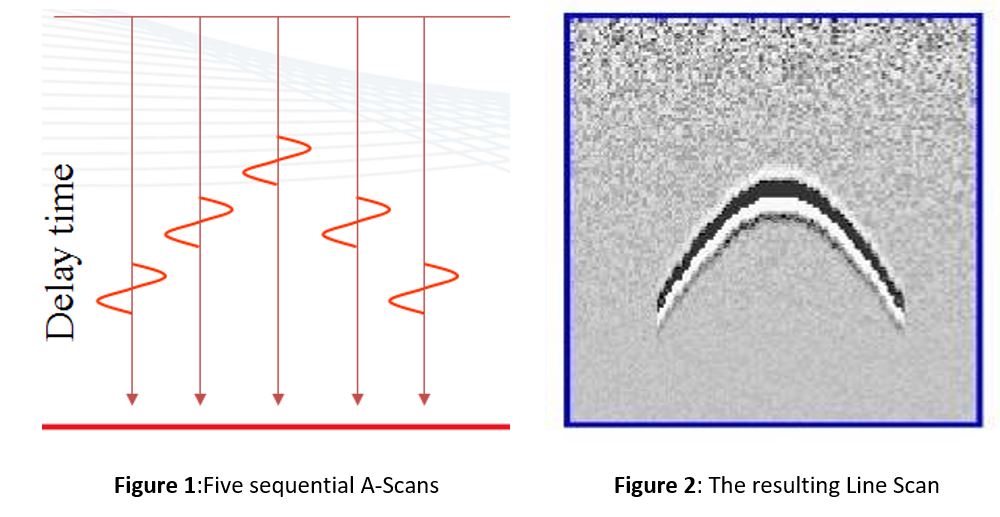
GPR information is generally viewed as either an A scan, B scan (i.e. line scans) or C-Scans (i.e. grid scans). These are graphical representations of time vs amplitude, and in B and C Scans, distance. An A scan is referred to colloquially as a “Squiggle plot”. The vertical dimension is time and the horizontal dimension amplitude. The B or C Line scan uses colours to represent the amplitude and “stacks” these A-Scans horizontally to form an image which represents a slice through the ground along the line of the scan. The horizontal dimension is now the distance travelled versus the time (depth) shown vertically, with intensity of shade representing amplitude.
Pulse Radar Theory
The majority of GPR equipment currently available for concrete scanning and utility location utilise Pulse radar. Pulse radar devices send short powerful pulses from a transmitter and receive echo signals back to a receiver. The frequency of the signal is determined by the size of the antenna as a current is sent down an actuator rod and pulsed to emit a wave. The distance to targets is determined by the speed of the signal through the ground multiplied by the time taken for the echo signal to be received back and dividing by 2 (transmission and receipt).
The pulse repetition frequency has an influence on the performance of the radar. Low repetition frequencies can travel further into the ground, but the target resolution is low. High repetition frequencies have higher target resolution but shallow penetration. A marginal improvement can be gained by internal modulation of the transmitted pulse. This is the reason a device will have a central frequency but will pulse a range of frequencies to create an image with the best possible depth and resolution. However, the band of frequencies which can be emitted is constrained by the physical size of the antenna.
Stepped Frequency Continuous Wave (SFCW) Radar Theory
Based on Frequency Modulated Continuous Wave (FMCW) theory, this is a special type of radar sensor which sends and receives signals out in the frequency domain rather than the time domain. The transmission signal is modulated which allows it to sweep a large range of frequencies. When the signal hits a target and is transmitted back, the distance is determined by comparing the frequency of the received signal to the original transmission signal.
A combination of methods for background noise subtraction are utilised to minimise the loss of data quality. This data is then converted to the time-domain using an inverse Fourier transform to produce a final view similar to standard time domain pulsed radar systems. This removes the physical limitation of pulse radar and allows a small hand-held device to emit an extremely wide range of frequencies. For a FMCW antenna, the limitation becomes the ability to convert the received signal data from frequency to time domain with a positive gain.
Advantages of SFCW
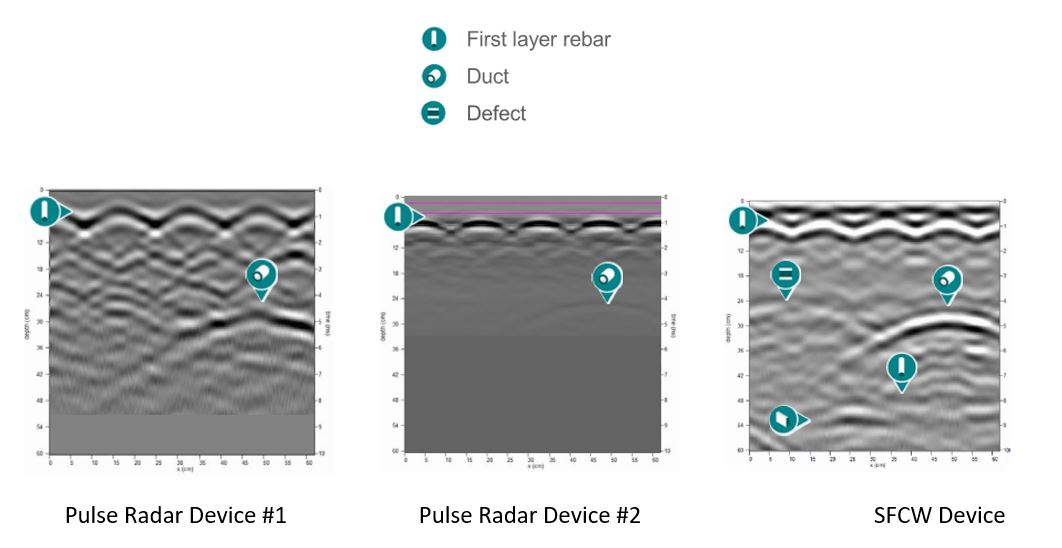
It is possible to cover a wide range of frequencies with a single hand-held device. For GPR applications, the result is a device which is able to penetrate deep into the ground while producing high-resolution images. The sound to noise ratio of SFCW devices is also much lower than pulsed radar devices. When comparing deep targets, the pulsed radar device scans become grainy and difficult to interpret. The SFCW images remain quite clear for the full depth of scan due to their positive gain when converted to the time domain.
Proceq GPR Live
The Proceq GPR Live utilises SFCW to cover a wide range of frequencies with a single handheld device. The stepped frequency antenna allows detailed high-resolution data sets to be collected across a wide bandwidth. Data has been collected in the frequency domain, converted to time domain and the following displays the range of frequencies with a positive gain after noise subtraction methods were applied.
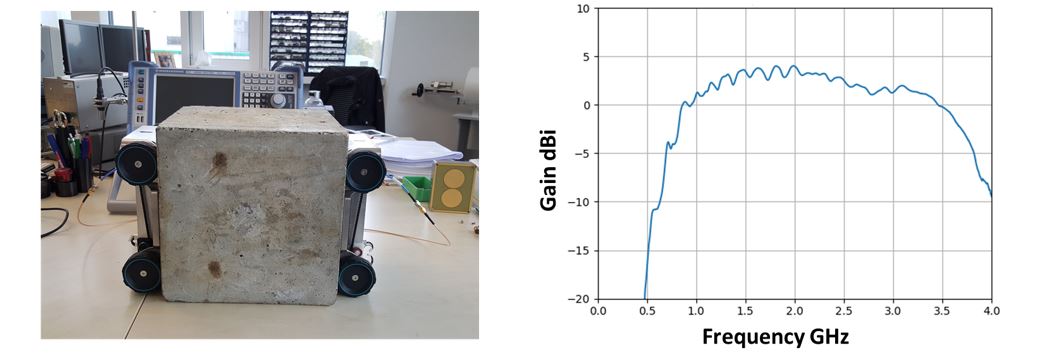
A very defined profile can be seen on this realistic setup, centered on 2.25 GHz with a net component between 0.6 and 3.9 GHz, immune to lower and higher frequencies noise effects. The final result is a handheld GPR device capable of high-resolution scanning to a maximum depth of 700mm.
Sonic Echo Testing in Australia
Sonic Echo testing (SE), also known as the Pile Integrity Test or Low Strain Pile Integrity Testing is a test based upon recording the response to a hammer blow on a pile head using a sensor. It is a tool used to evaluate the length and geometry of piles and to determine if there are any defects along the length of the pile.
 Theory
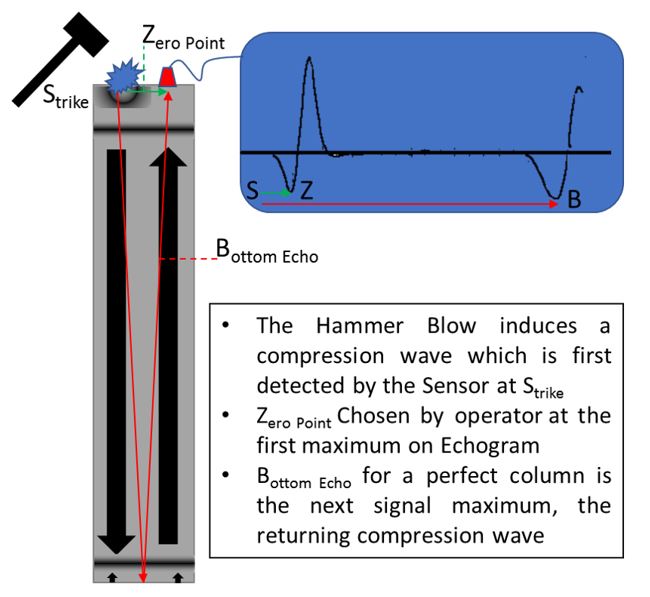
The hammer blow produces a compression wave front, which quickly forms a travelling “Bar Wave” covering the cross section of the pile. Where the pile ends there will be an echo returned to the accelerometer sensors.
This is graphed as a Reflectogram. Reflectograms may show first signals from strikes as Positive (downwards) or Negative (upwards); it is important to note this direction as it is used to compare to later maximums.
To determine depth, a “Zero Point” is chosen on the sonogram, then the operator chooses the maximum point corresponding to the length of the pile. For a perfect Column, this is the next maximum in the same direction as the Zero Point.
The Zero point is usually taken to be the first maximum visible on the graph of amplitude vs time, shown as B in the diagram on the right, this is the first response to the pile moving under the hammer blow.
If the pile changes geometry (becomes thicker, thinner, has an inclusion or a break), other echoes will be returned. Echoes are also produced by change in stiffness, so if the pile moves from a soil layer into a rock layer, or if the pile moves from air into the ground this is commonly visible as other maximums in a SE Reflectogram.
Piles with Long Rock Sockets
It is common in Australia for piles to be cast with a proportion of their length embedded in Rock, particularly in Sydney. Where a pile is firmly in contact with surrounding rock, the large change in stiffness will form another Echo on a Sonic Echo test, and as the piles are short, the second bottom echo may arrive during the repeating echo of the change to rock.
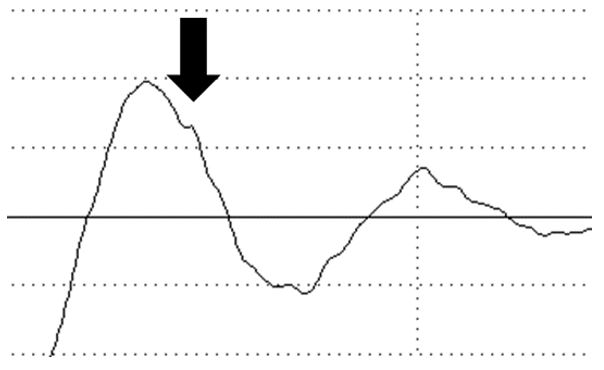
The first example below is a zoomed in section of where the bottom reflection is visible, but as a small bump on the downward slope of an earlier reflection.
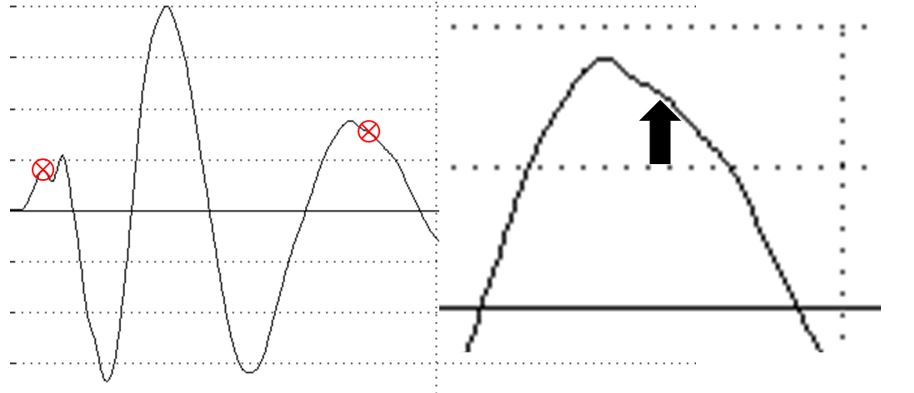
The second example below is a more extreme sample, where the bottom reflection has stretched a peak out to a broader top with only a change in inflection visible. The zoom with an arrow shows the bottom reflection and the red crosses a zero point and bottom reflection pick.
You can see some of the characteristic extra energy from a short pile with complex ground conditions. It is critical to confirm results like this with repeated testing, especially if the pile length and soil conditions are not known. Each echo should be accounted for during test interpretation, as echoes not expected from entering the soil, change from soil to rock or the bottom of the pile must be considered as possible defects.
For consistency, operators should be taking several impacts per measurement point and comparing between them and moving the accelerometer and strike position to collect three or more data sets per pile, each with the same information. If you cannot collect consistent data on a pile, then you have not tested it completely.
Short Metal Piles
Metal H Piles can only be tested over a short distance. Their large surface area in contact with the surrounding soil means that only 1-2 m of embedded depth may be tested before the signal is lost to attenuation. In the sample data below the Zero Point, an Initial reflection from the pile entering the soil and a final reflection from the pile base are visible. Testing may require a smaller metal hammer, large rubber tipped hammers may flex the pile or induce the wrong energy frequency.
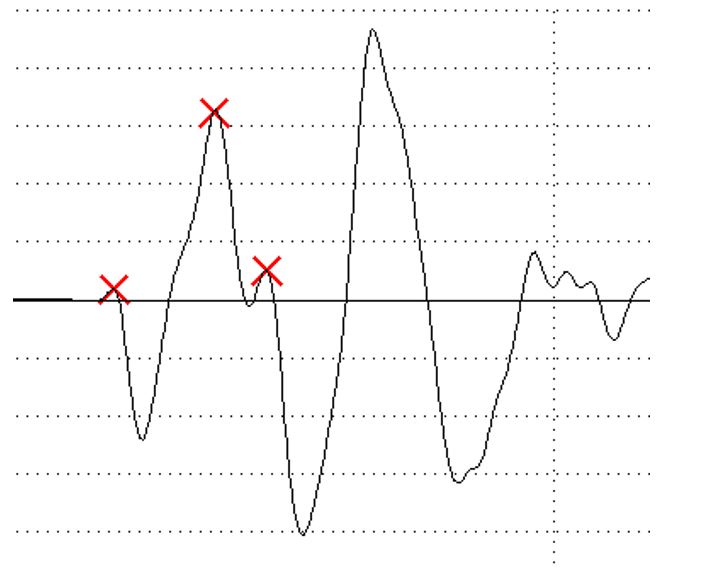
It is critical when interpreting results for depth of the steel piles that the Velocity be calibrated on site, assumed speeds of sound for concrete are incorrect, and the speed of sound in steel does not consider the effects of geometry.
Note that as in the previous example how close the second and third reflection are to each other, it is possible the signals may merge and form an inflection points as discussed during the previous section.