Analysis of Raw Data from GPR and a Cover Meter
GPR design for different tasks is based around the depth of penetration and size of targets to be located, then a system frequency is selected to balance resolving small targets with depth. Wideband antennas and post processing allow for more flexibility with single antennas, removing some of the limits multiple antenna arrays have.
Covermeter's raw input is signal strength, our second article examines sample graphs of signal strength and how for critical cover surveys they can ensure the best measurement point selection and trouble shoot difficult tasks.
Wideband GPR - Post Processing for Utilities
Dynamic Target enhancement (DynaT) is a new feature introduced by Sensors & Software with the LMX-200 in response to users who need the ability to emphasize GPR responses based on target size.
 has a much stronger frequency dependence that the larger targets.") DynaT allows users to preferentially enhance the response from targets of different sizes – small, medium and large. GPR users currently depend on signal amplitude to discern targets, and small targets can be difficult to see in GPR data because they always produce smaller amplitude responses than larger targets – this is a fundamental physical fact.
DynaT allows users to preferentially enhance the response from targets of different sizes – small, medium and large. GPR users currently depend on signal amplitude to discern targets, and small targets can be difficult to see in GPR data because they always produce smaller amplitude responses than larger targets – this is a fundamental physical fact.
The ability to make smaller targets more visible on the GPR display provides a valuable benefit to many GPR applications such as utility locating. To enhance smaller targets, some aspect of the target response other than amplitude must vary with target size. One aspect of target response that depends on size is the frequency content of the returned signal. In simple terms, the rate of change of signal amplitude with size varies strongly for small targets. DynaT is a process that exploits the ultra-wideband frequency content inherent in the GPR signals generated by Sensors & Software GPR systems. By differentiating the frequency dependence of GPR target responses, DynaT enhances the amplitude of targets based on relative size.
A simplified view of how GPR responses vary with target size is shown in Figure 1. The responses for varying target sizes are presented versus frequency and target size normalized by the GPR bandwidth (which is a measure of the physical length of the GPR pulse). This shows that when the target size is small compared to the GPR pulse length, the response changes rapidly with frequency. When the target is large compared to the GPR pulse length, the response becomes much less frequency-dependent. DynaT uses this frequency dependence to appropriately amplify the target response. The first release of this new functionality appears in the new LMX200 system (see the accompanying story). With this system, users can selectively enhance different size targets interactively during data collection in the field. Figure 2 shows LMX200 data displayed with varying DynaT size settings.

Cover Meter Signal Strength Analysis
Where a cover survey is required for durability analysis it is critical that the measurements are as precise as possible. Modern cover meters are now accurate to within mm or the real cover, but as their operation is purely magnetic the correct survey points must be selected to ensure measurements taken are a representative of the real as built structure.
This article will use signal strength graphs to highlight important considerations when measuring cover. It will also quickly describe the operation of a cover meter.
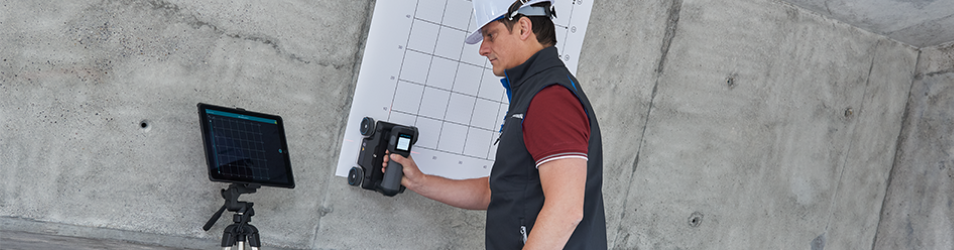
Description of operation
All modern cover meters use a measurement method known as Pulse Induction. An electric pulse to the cover meter’s measurement coils produces an electromagnetic field. This induces a current in nearby rebar which produces its own field (called signal). The signal strength from this rebar field is then measured and converted to a cover value (using an input bar size i.e. signal strength is proportional to cover and bar size). Another pulse then repeats the measurement.
Signal strength graphs
 The Profometer offers signal strength graphs in Single-Line Mode and a colour map in Cross-Line Mode. This incorporate location information from the Universal Probe in Cart, allowing a visual map of signal strengths over a region. Both options can be used to select and confirm as suitable measurement locations.
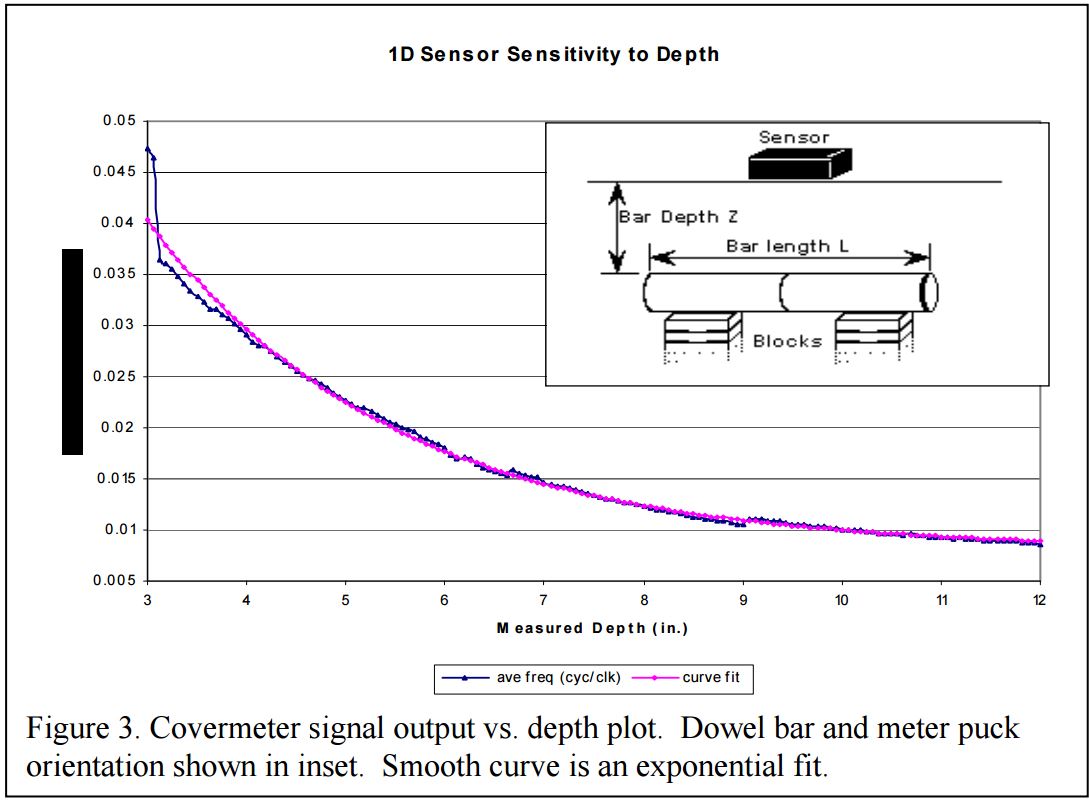
The graph illustrates that signal strength rises quickly the closer a bar is to the sensor. Keep this information in mind when reviewing the results that follow.
Standard and Long Measuring Range.
Selection of the correct measurement range is critical for ensuring accurate cover measurement and a positive location of each rebar in the concrete element. Long measurement range produces the strongest and largest magnetic field, offering the greatest measurement difference but it is better to use Standard where it is suitable as it is the most accurate measurement mode.
By using a Signal Strength Graphs in Line-Scan Mode it is possible to confirm that the cover meter is receiving signal and rebar are being positively located.
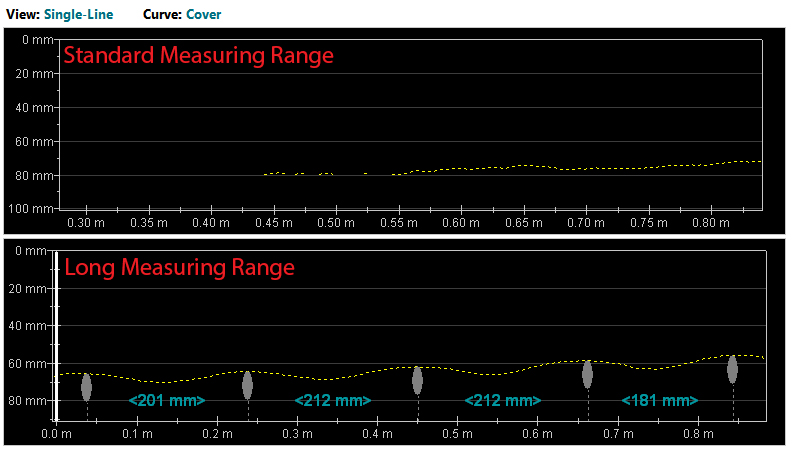
When selecting a measurement mode, it is best to use Standard range unless it provides insufficient signal. The graphs immediately below shows the signal strength (ie not cover) on scans taken in a site where rebar are deeper than 60mm. Standard only returns a signal towards the end of the scan and is unable to locate individual bars, Long is able to clearly identify each bar.
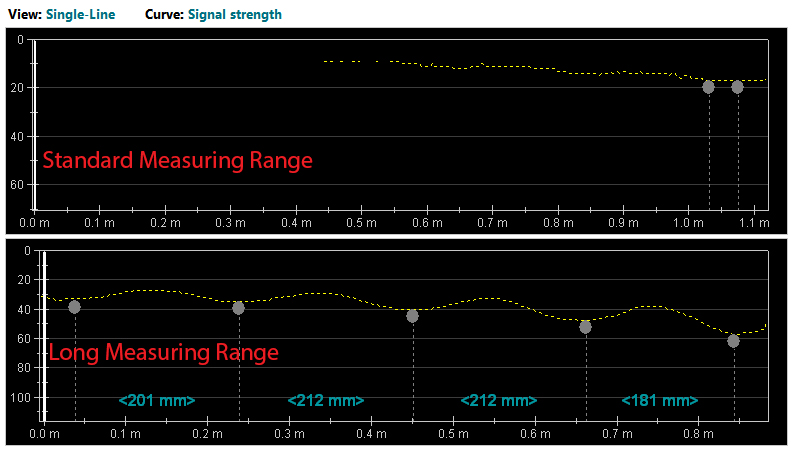
Reviewing the same data in a cover graph (ie mm in vertical scale not signal strength) below illustrates the better cover measurement of the long measuring range . Also compare the 5th located bar at the far right side of the graph, maybe 5-6 mm closer than the bar with the highest cover but examining the Signal Strength graph the signal strength is nearly 50% higher.
Interfering metal and colour map of signal strength
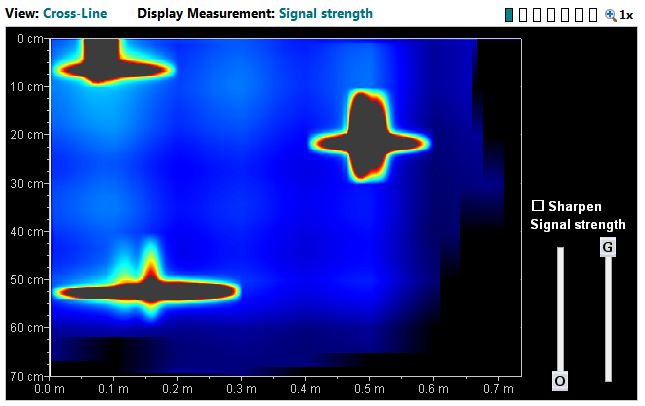
The pervious example illustrates the importance of using the correct measurement range, along with the greatly increased signal strength as metal is placed closer to the probe. Using the Cross-Line Mode it is possible to review a colour map of signal strength.
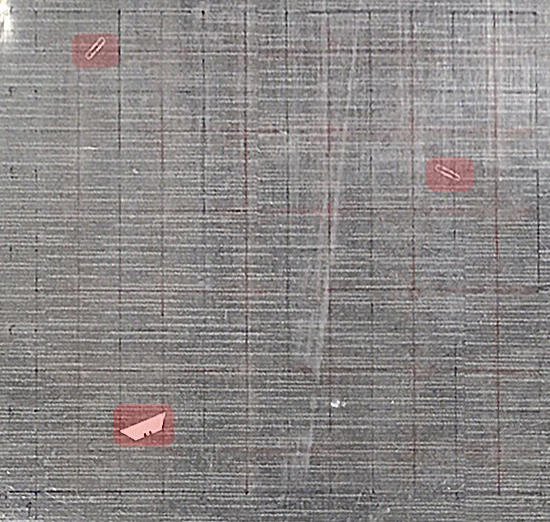 The scan is collected by drawing and measuring over a grid of lines on the concrete surface, for this example the grid is 100mm between measurement points. To simulate common forms of interference two paperclips and a knife blade were placed between a plastic grid and the measurement surface. To allow for the added thickness a 5mm cover offset was set within the system.
The two paperclips are highlighted in red towards the top of the image, the knife blade is towards the bottom. These simulate the kind of extra metal that may be found due to bar chairs or tie wire dropped into a mold and not removed before casting.
The Line-Scans taken indicate that as in the previous example most of the rebar are below 60mm. However several lines showed sub 10mm cover. The location of the rebar is also not consistent due to the inteference from the previous indicated foreign objects. In practical use this would generally "stump" the user with a less advanced covermeter.
However in the Signal Strength Map the effect of the extra metal is clear, showing the area of effect of each additional piece of metal. This visualization can be used to select suitable regions from which to record cover measurements clear of interference, in this example only the bottom right of the image is sufficiently clear and distant from the interference to be a suitable site for accurate cover measurements.