Phone: 02 9453 9999 or Email: sales-operations@pcte.com.au

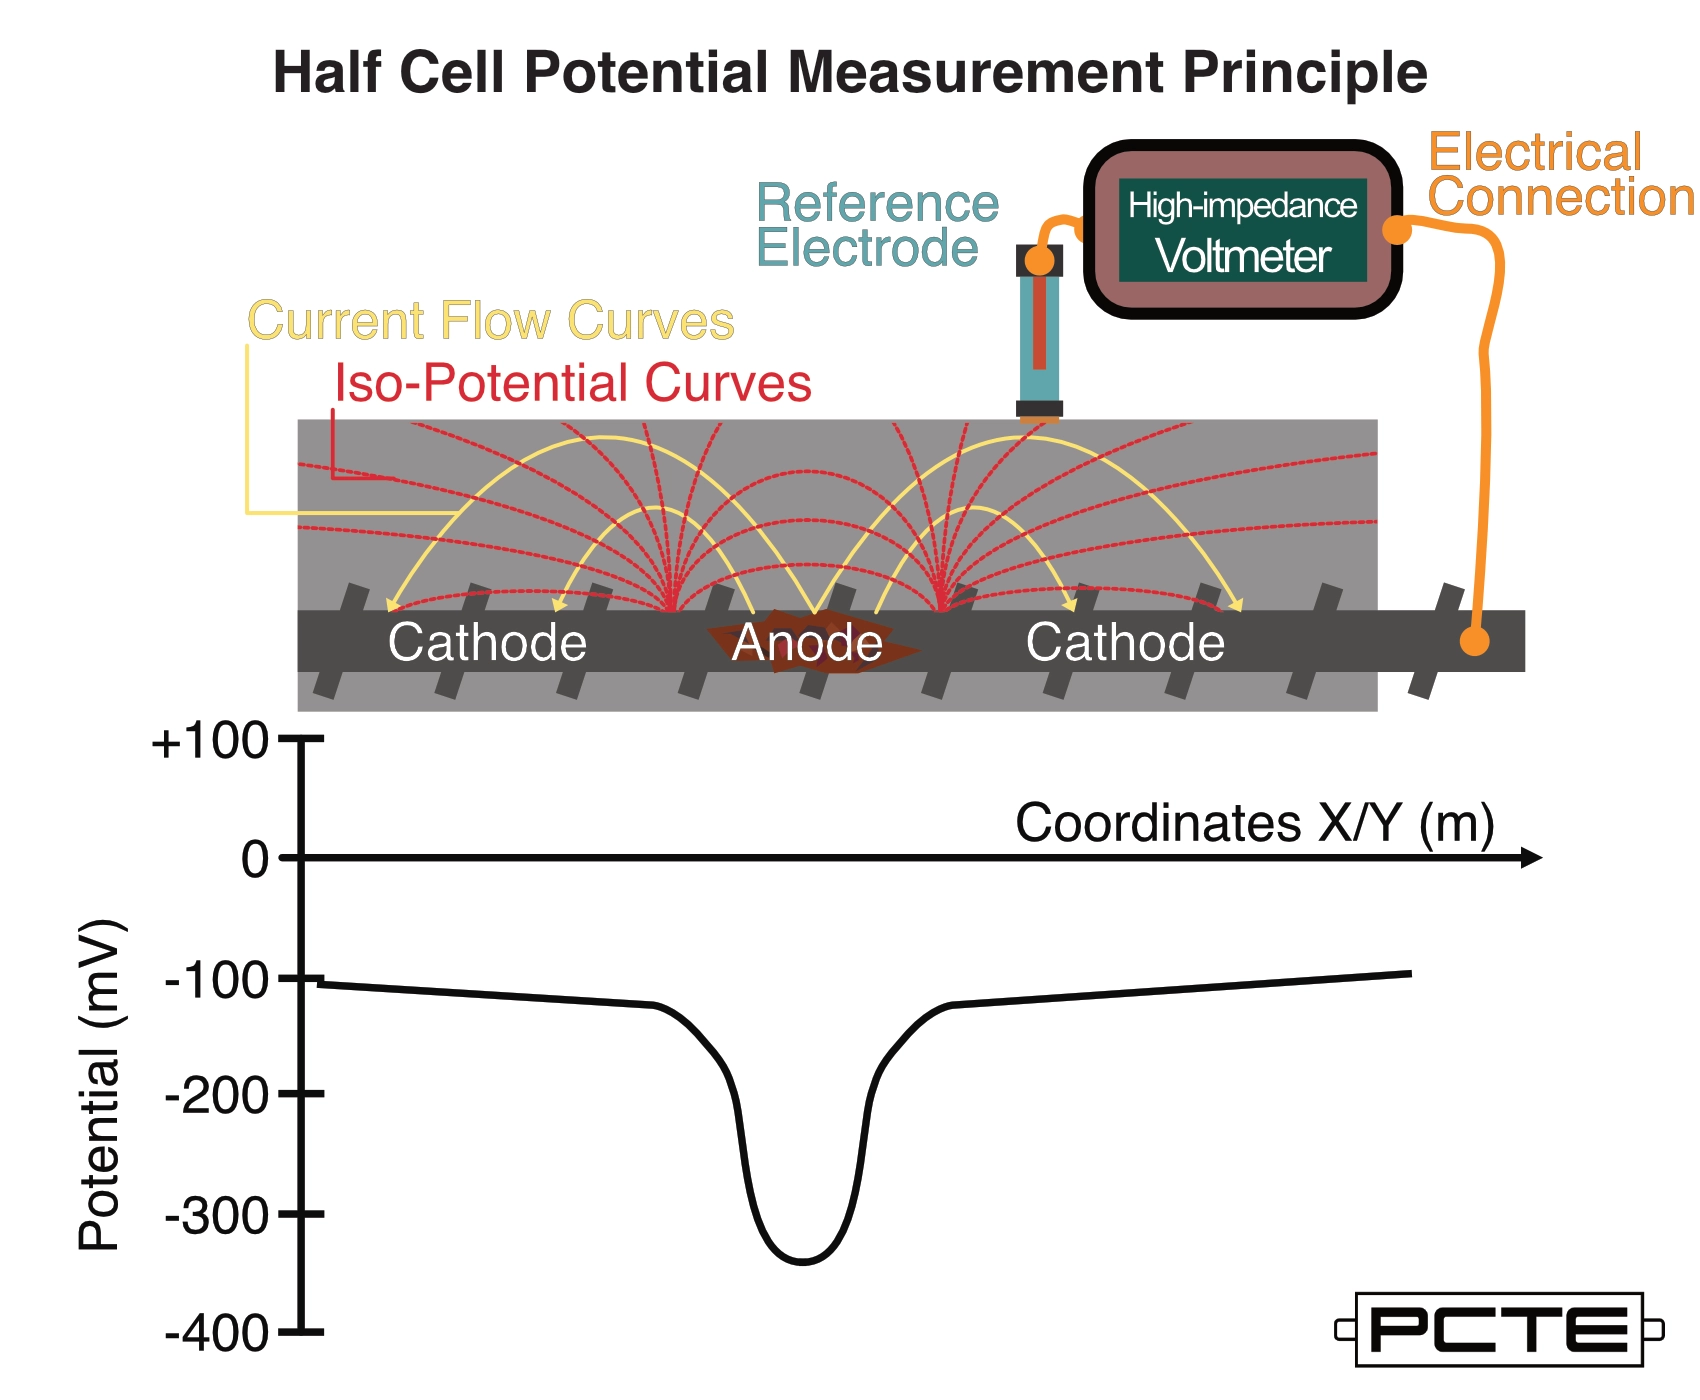
In the context of Concrete Corrosion, Half Cell Potential (HCP) is the electrochemical measurement of the difference in voltage (Potential Difference) between a reference electrode placed on the concrete surface and embedded reinforcing steel below.
This measurement is commonly collected with a close grid spacing in representative exposure zones of structures, such as bridges, tunnels and property close to the water.
The change in relative HCP in a test area can be related to the likelihood of corrosion for the embedded steel, it does not provide information on the corrosion rate of steel or current section loss of steel elements.
This likelihood of corrosion is used to locate corroding rebar, choose locations for destructive testing such as chloride analysis or breakout, and as input for the design and construction of concrete remediation works.
The stages of corrosion are Corrosion Initiation, Rust Propagation and Corrosion Acceleration.
Corrosion Initiation is the period of time for diffusion of chloride ions or carbon dioxide from the environment to reach the embedded steel and damage the protective passive oxide layer.
During Rust Propagation the steel actively corrodes, typically as pitting corrosion in Chloride Induced Corrosion. The result is to reduce steel section and form red rust, which is expansive and will lead to crack formation and growth in the surround concrete.
The Corrosion Acceleration stage is when the structural damage due to expansive corrosion of steel exposes the embedded steel to the environment its concrete cover previously protected from, with loss of steel section, concrete spalling and cracking increasing more quickly.
HCP measurements require the creation of an electrical circuit between the reinforcing steel, the HCP test device and its reference electrode placed on the surface of the concrete, the moisture and chemistry of the concrete itself acts as the final path of this circuit.
To ensure measurement is local to the Region the reference electrode is in contact with;
- The reinforcing steel must be electrically continuous over the whole region of the test, this is normally measured using a multimeter's continuity function or a device like the CM-3 Rebar Continuity Tester.
- The concrete surface must be uncoated, coatings would prevent the formation of an electrical circuit. The reinforcing must also be uncoated for this reason.
- The concrete cannot be saturated with water. The effect on the corrosion environment and Half Cell Potential measurement results in misleading value. Surface wetting to allow conduction is OK, it is physical saturation of the whole concrete that is a concern.
The image below shows a typical half cell measurement, along with examples where the corroding rebar is closer to the surface and a measurement where the surrounding concrete has a high value of resistivity. The corrosion activity, and measurable mV potential difference are the same at the surface of the steel.

Reducing the concrete cover brings the corrosion activity closer to the probe, decreasing the measured value from -250 mV to -360 mV.
An increase in concrete cover would have the opposite effect, a positive change to the mV value measured at the surface. This effect may be so great as to prevent detection of this corrosion activity from the surface.
Increasing resistivity has the effect of a positive change in mV measurable at the surface now reporting -190 mV, the regions of concrete in which the corrosion activity may be detected is reduced .
Lowering resistivity will reverse this effect, the corrosion activity will influence a greater region of the concrete and a more negative value may be measured at the surface.
It is appropriate in regions of high resistivity or thick concrete cover to reduce the space between grid measurement, the surface regions over which a mV change is detectable will be smaller thus a tighter grid is more likely to detect HCP changes.
Ideally interpretation of HCP values should be made using the Half Cell Potential Difference Technique, comparing the relative mV values in similar exposure regions of the structure, either looking for local minimum values, or for a quick change to a lower value as seen in the measurement principles illustration earlier in this document.
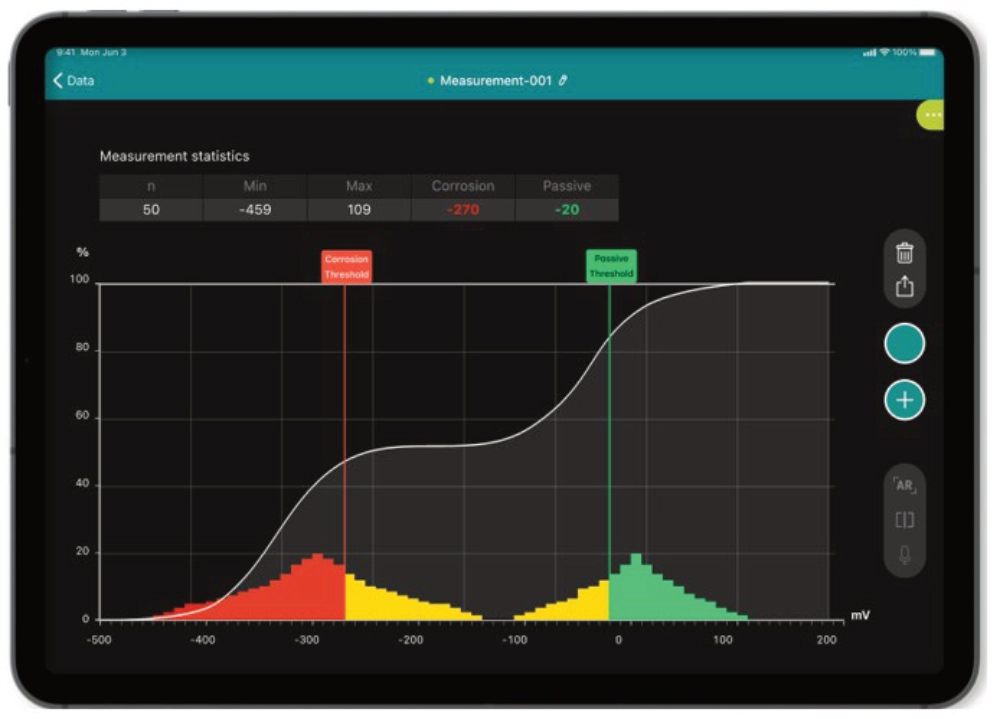
It is also possible to use the Dual Distribution process, this technique is made simple when using a Profometer Corrosion PM8500, as the inbuilt cumulative distribution graph allows operators to choose their Active and Passive Threshold values directly in the iPad OS application, these are placed at the 2 inflection points of the graph, where the slope changes as the two distributions interact.
While it is common to use typical values of corrosion threshold from the ASTM C876 standard or Rilem's TC 154-EMC these values are drawn from assumed environmental conditions and material.
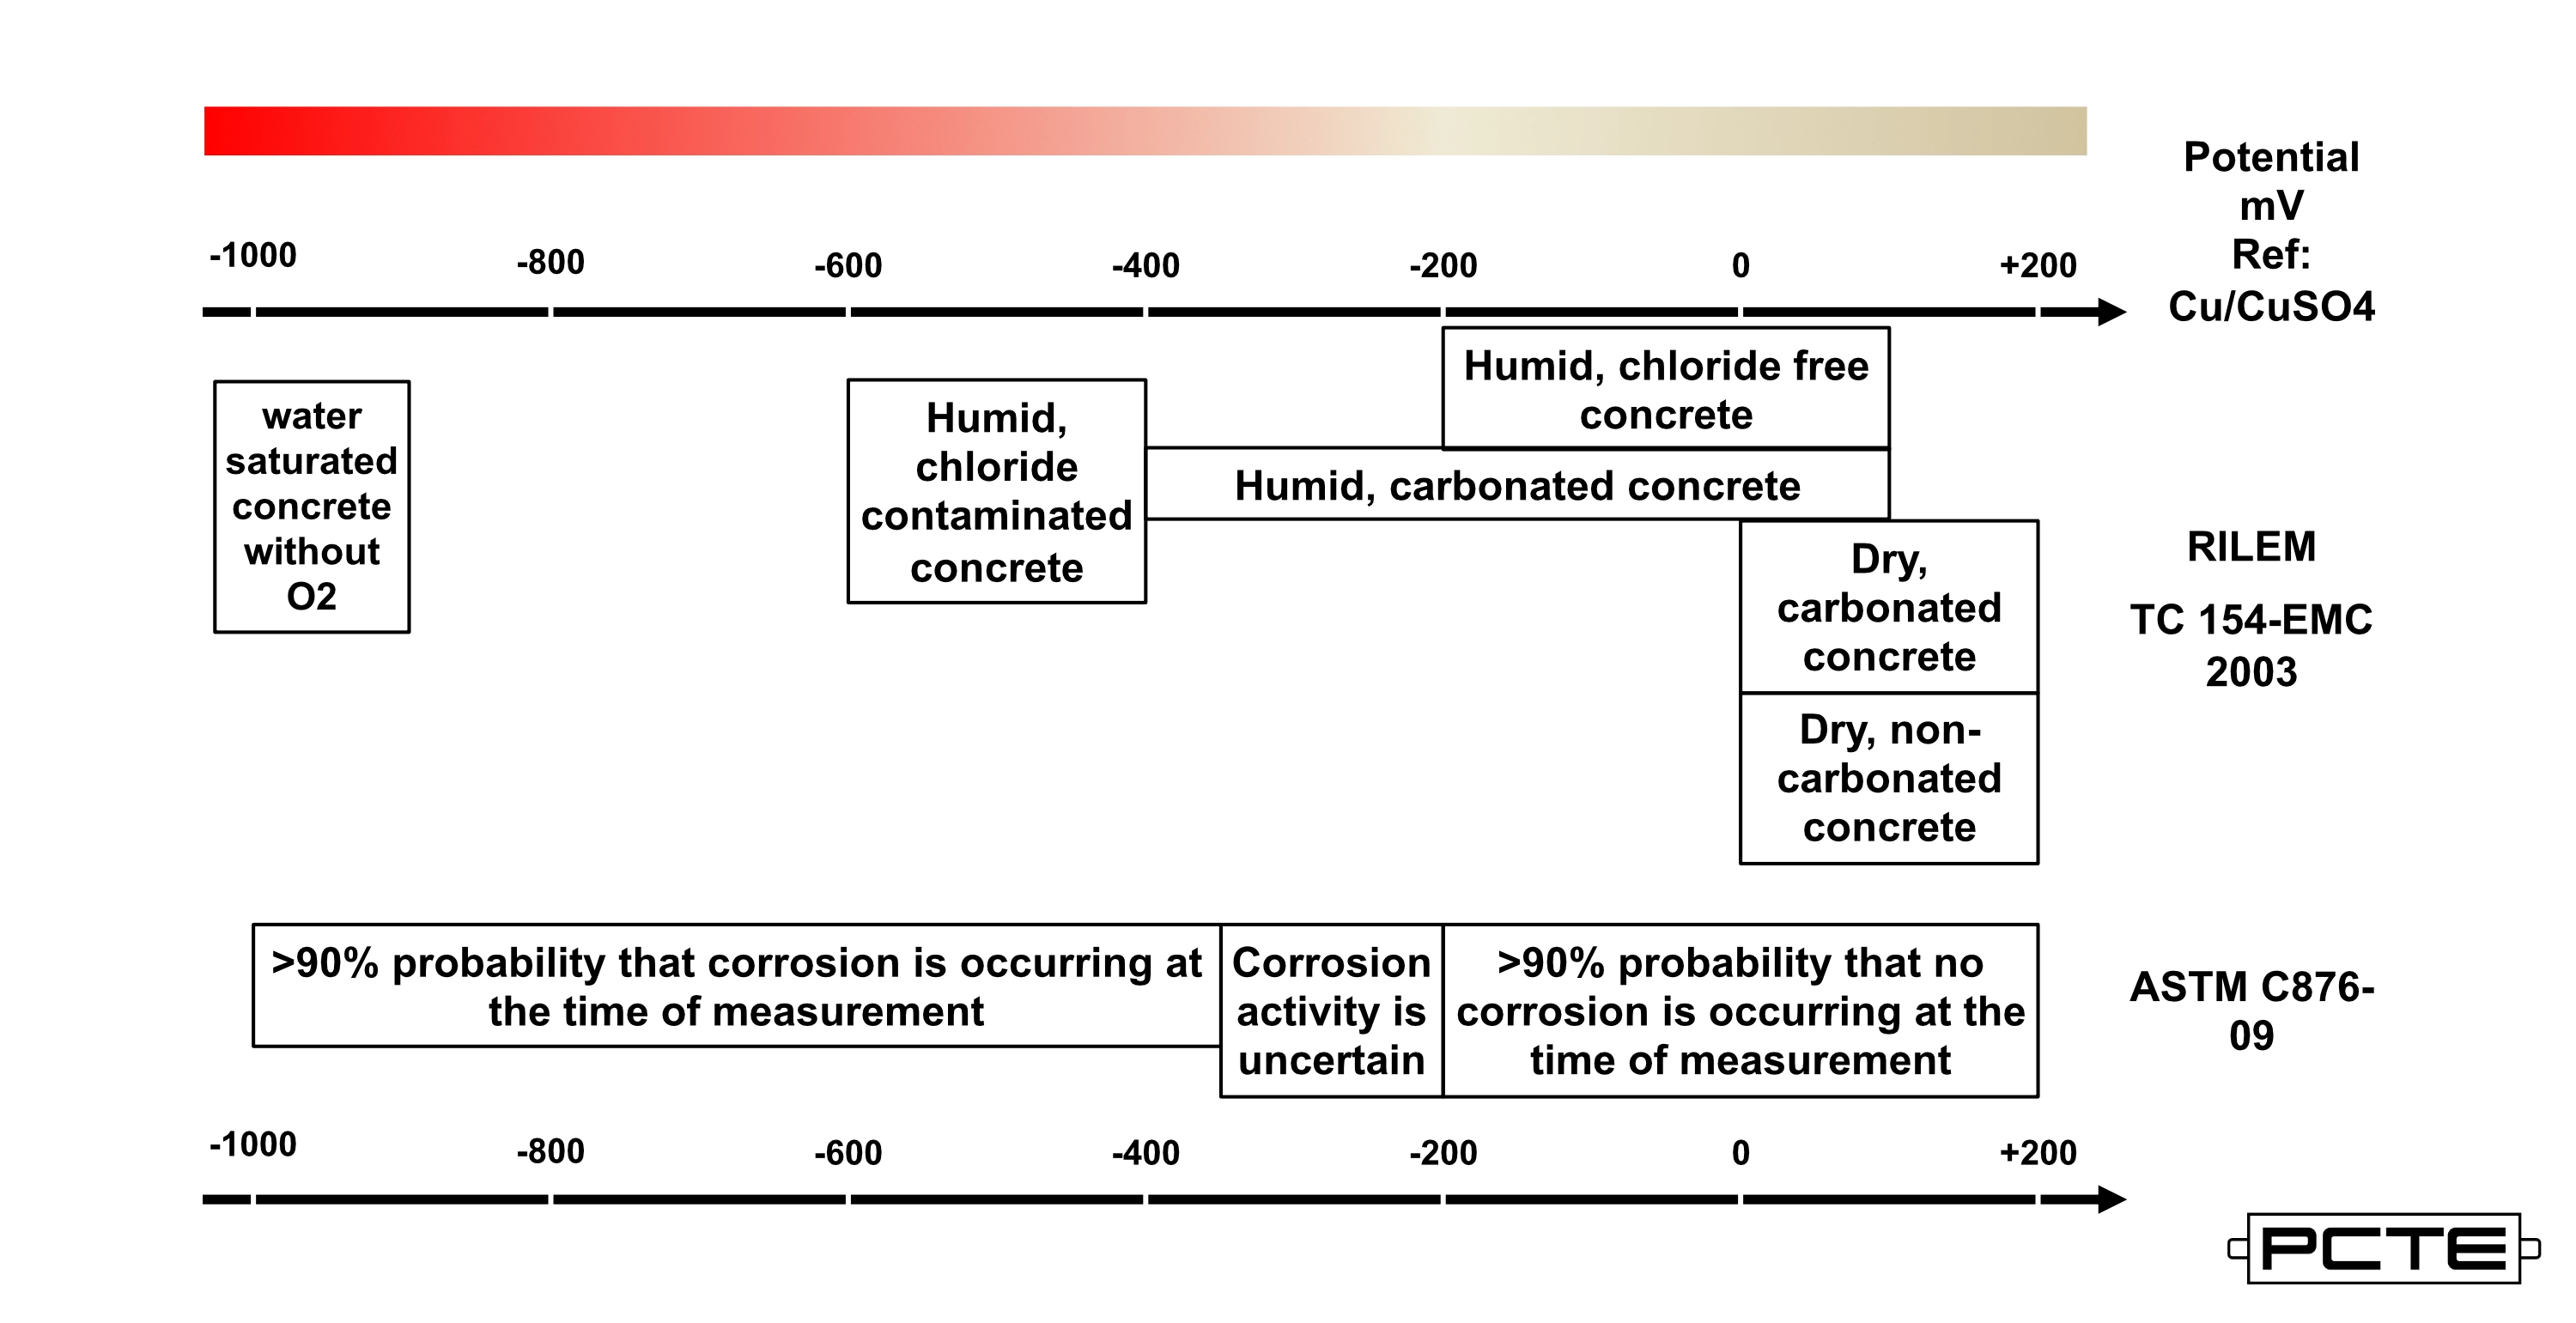
ASTM C876 values were produced in damp chloride contaminated concrete samples in the laboratory and with outdoor exposure.
Rilems typical values are more sophisticated, highlighting mV ranges typical for dry and wet concrete samples that are either carbonated, chloride contaminated or uncontaminated. They also include typical values for water saturated concrete in the absence of oxygen.
Both references include no information on the cover thickness or resistivity of the concrete samples used.
%20vector%20logo.svg)


