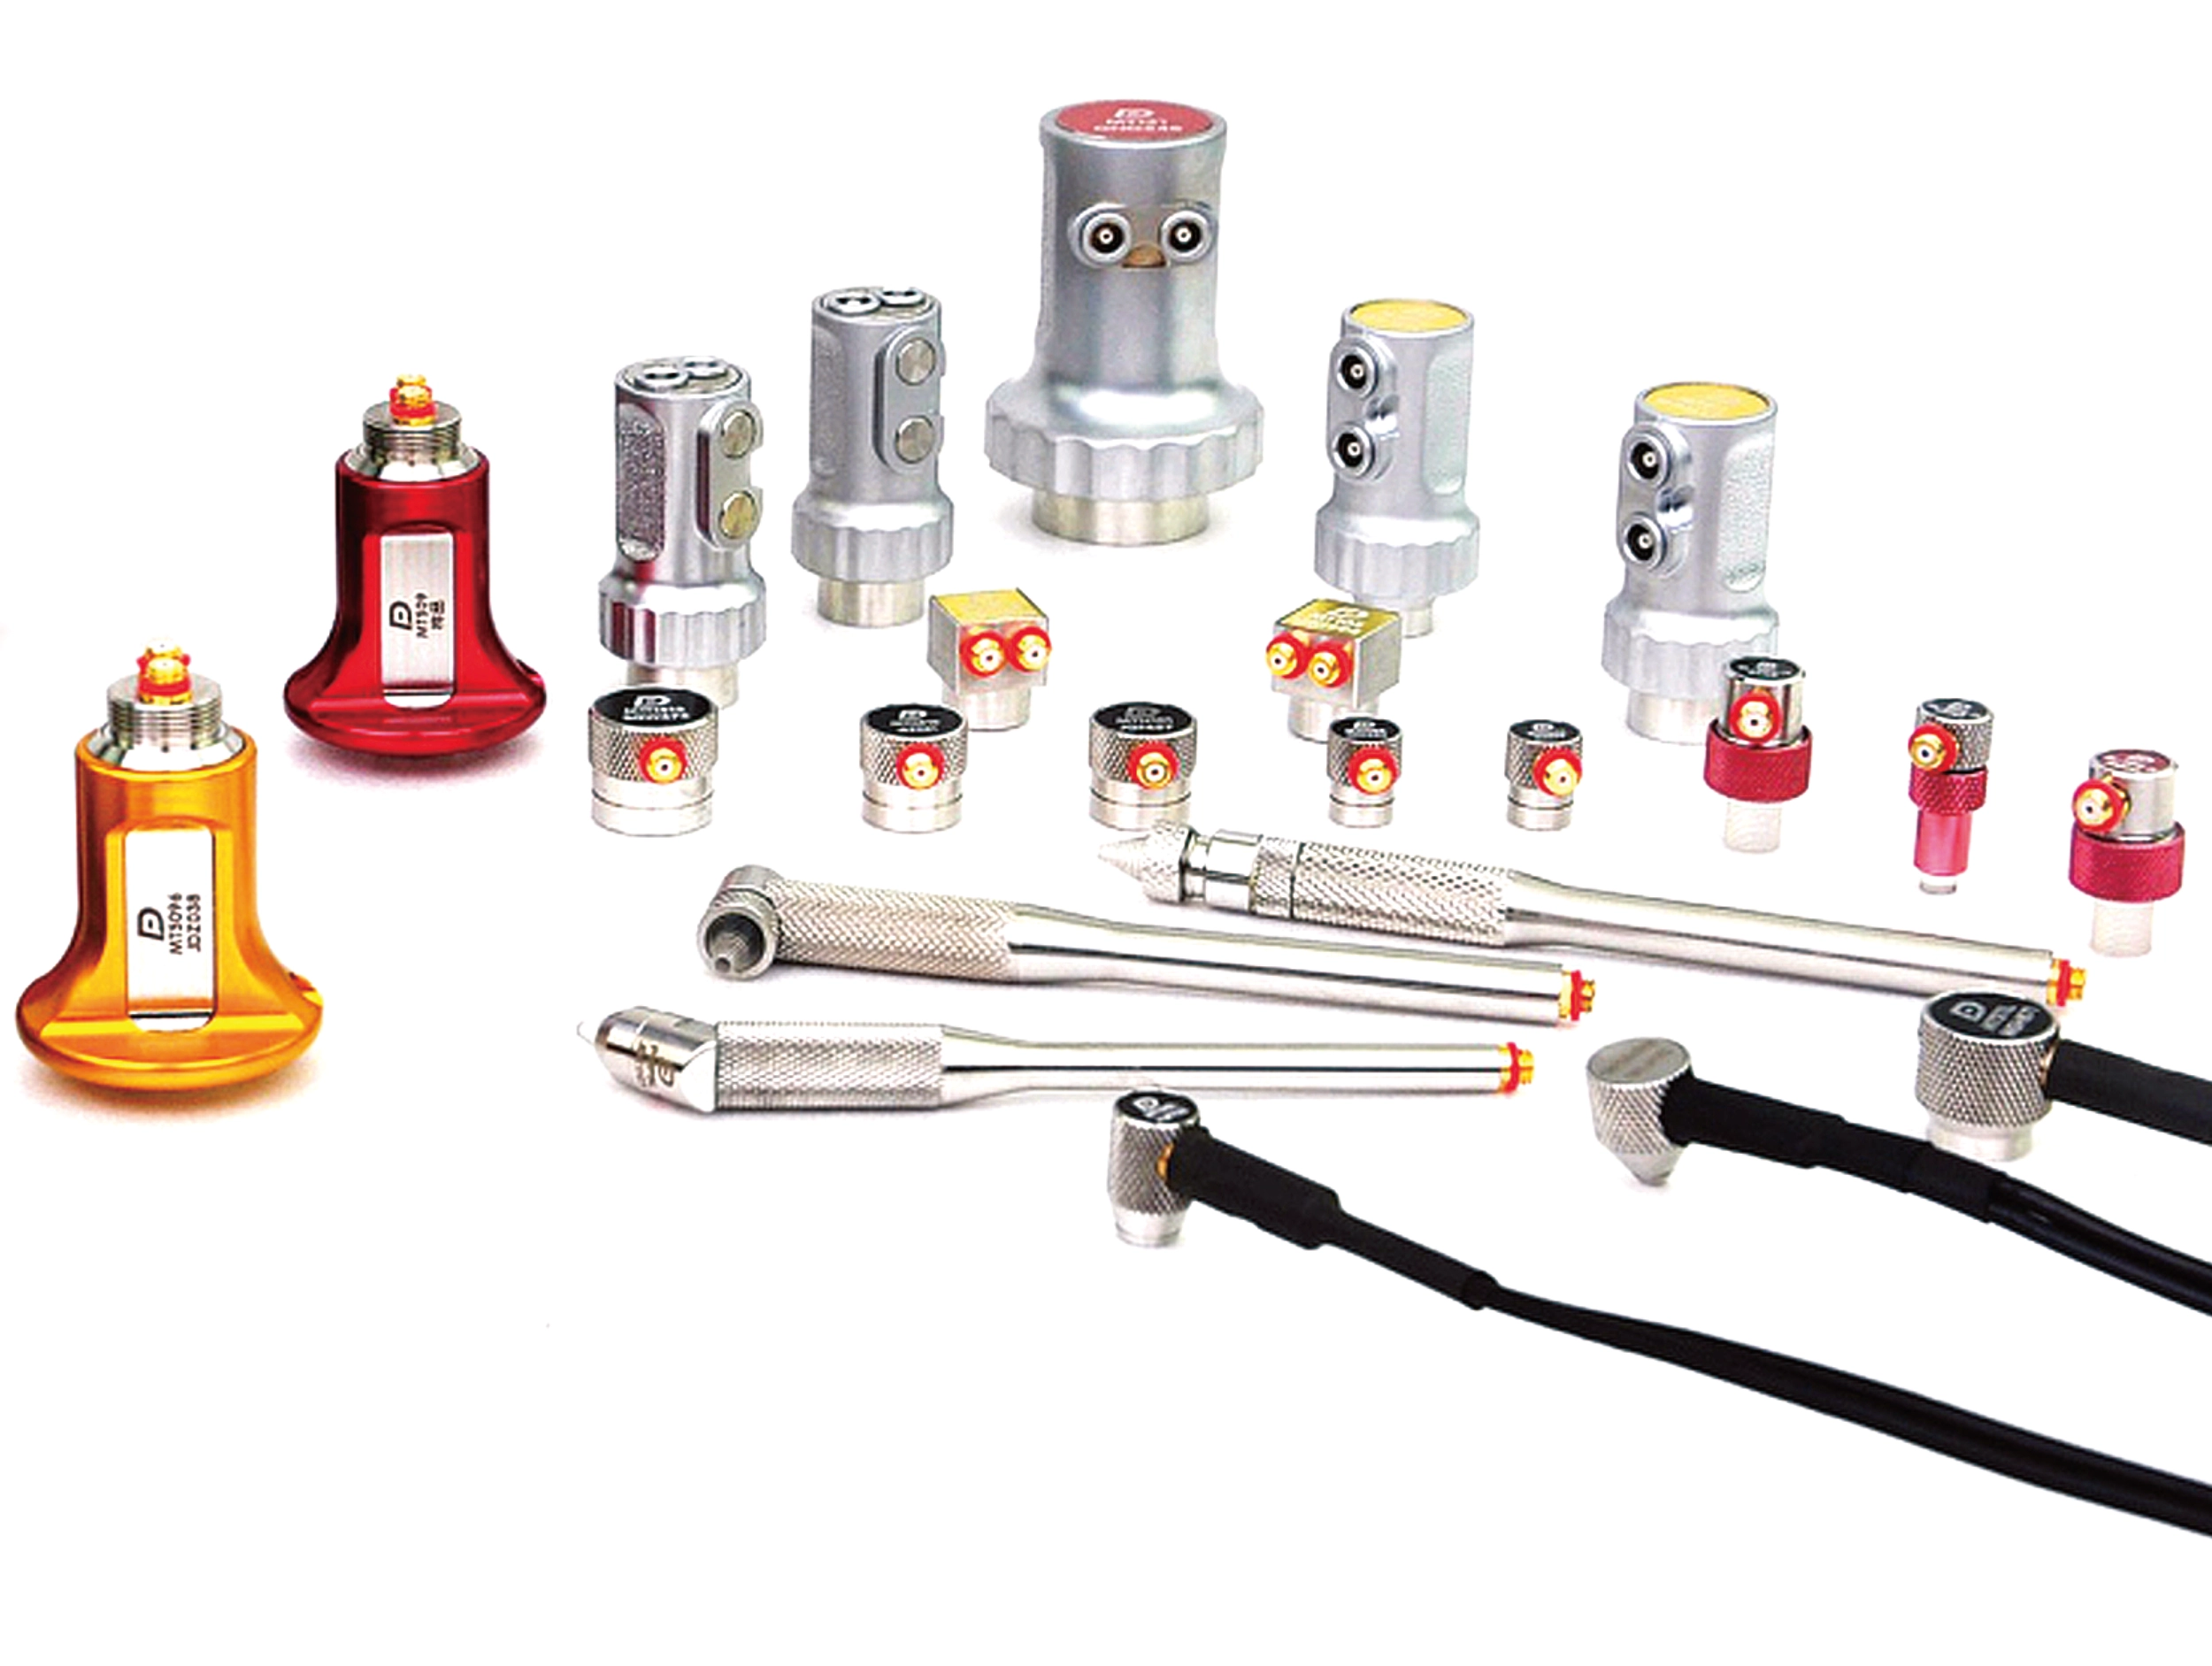
PM8500 Profometer Corrosion

The Profometer PM8500 is the most complete half-cell solution for rapid onsite mapping of corrosion potential in reinforced concrete.

$ 0.00 AUD

Variant out of stock, you may request a backorder quote. Please list the product specifications in the text field.

Request Quote
Thank you! Your submission has been received!
Oops! Something went wrong while submitting the form.

GS9000 Multichannel GPR for 3D Utility Mapping and Structural Assessment

Overview | GX1 vs GX2 | SUE & Utilities | Structures & Pavements | Software & Outputs | Case Studies | Specifications | Support

Discuss Your Application

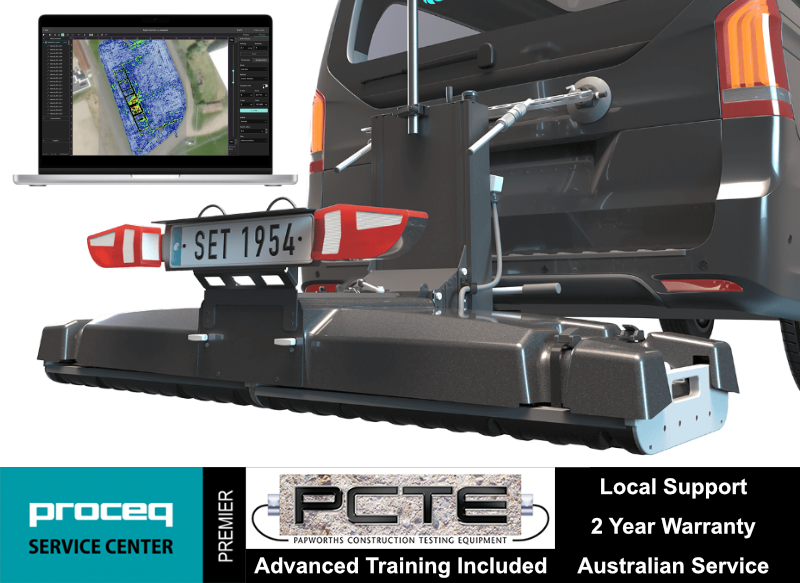
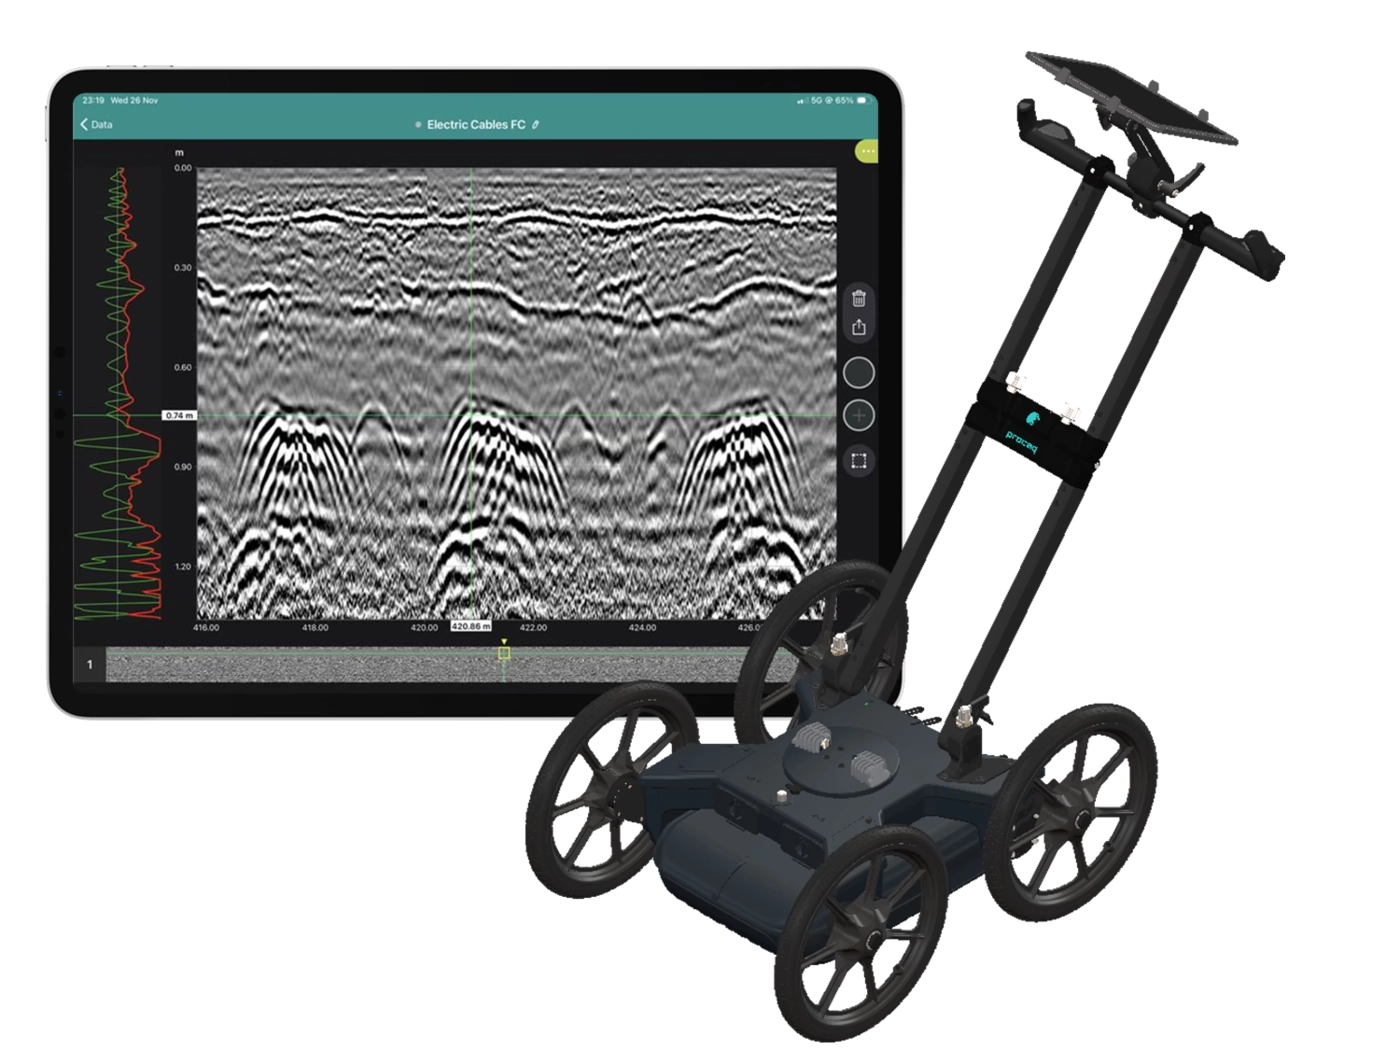
Collect high-density, georeferenced GPR data across wide areas and view the subsurface in 3D as you scan. Choose the GX2 array for SUE and utility mapping, or the GX1 array for structural, bridge and pavement investigations.

Book a GS9000 Demonstration

Best suited to:

  • Subsurface utility engineering
  • Utility locating and mapping
  • Civil and survey contractors
  • Road and corridor investigations
  • Void and subsurface anomaly surveys

Best suited to:

  • Bridge-deck investigations
  • Concrete cover and moisture mapping
  • Pavement and asphalt-layer assessment
  • Reinforcement mapping
  • Structural deterioration surveys

Recommended array: GX2

Recommended array: GX1

Why use the GS9000 instead of a conventional single-channel GPR?

Cover more ground

Collect multiple parallel profiles in one pass instead of uilding a grid line by line.

See results during acquisition

View georeferenced radargrams and time-slice information in the field rather than waiting until the data is returned to the office.

Produce repeatable mapped data

Combine wheel-positioned GPR data with GNSS, project coordinates and survey linework.

Use one platform for two very different applications

Exchange GX1 and GX2 arrays without purchasing two complete cart platforms.

High-density 3D GPR mapping for SUE and utility investigations

The GX2 transforms the GS9000 into a high-density subsurface utility mapping system. Its 11-channel, low-frequency GPR array captures an 83 cm-wide swath in each pass, helping operators detect and map buried pipes, ducts, cables, voids and other subsurface features. Live georeferenced data lets SUE teams review coverage on site and produce accurate CAD, GIS and project-coordinate deliverables.

  • Utility corridor mapping
  • Detection of pipes, ducts and cables
  • Mapping non-conductive services that may not respond to electromagnetic locating
  • Congested service investigations
  • Road-crossing and easement surveys
  • Potential void and cavity investigation
  • Pre-excavation and design-stage surveys
  • Utility mapping to project or local coordinates

The SUE field workflow

1. Plan the survey

Load satellite imagery, CAD information, project coordinates or survey control.

2. Collect dense multichannel data

Survey an approximately 0.82 m-wide swath with 11 channels in each pass.

3. Review data live

Examine radargrams, georeferenced time slices and marked features while still on site.

4. Interpret and digitise

Add points, linework, tags, photographs and field observations.

5. Process and deliver

Merge survey areas, apply processing and export mapped information for the customer’s CAD, GIS or reporting workflow.

SUE Outputs and Deliverables

  • Georeferenced time-slice maps
  • Radar profiles
  • Utility alignments and interpreted linework
  • Depth estimates
  • Survey trajectory
  • Points of interest
  • Field photographs and annotations
  • CAD, SHP and KML outputs
  • SEG-Y raw-data export
  • Project-coordinate and local-grid outputs
  • PDF or shareable project reports

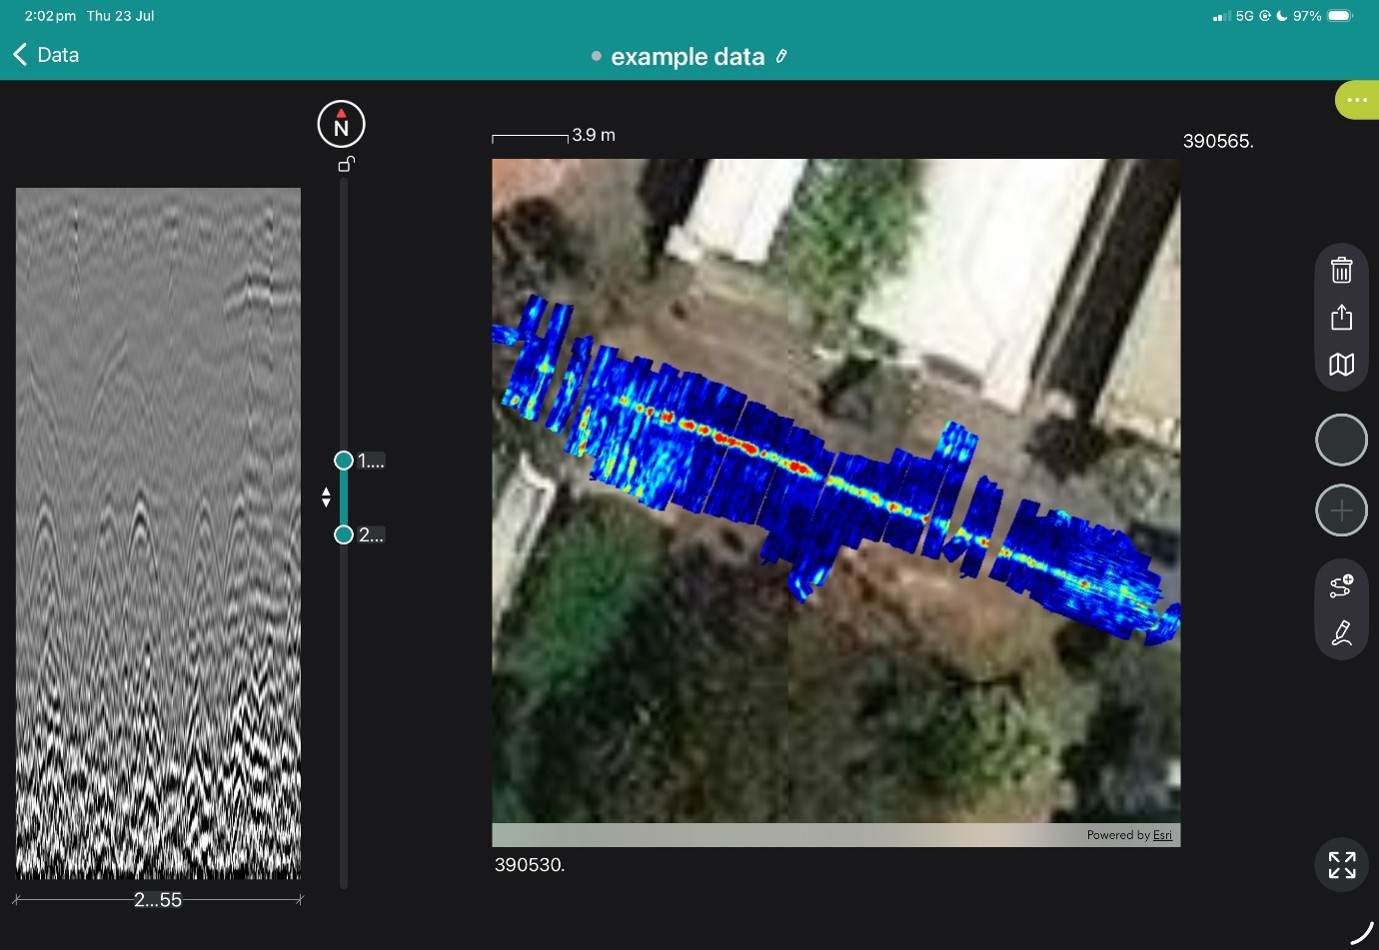
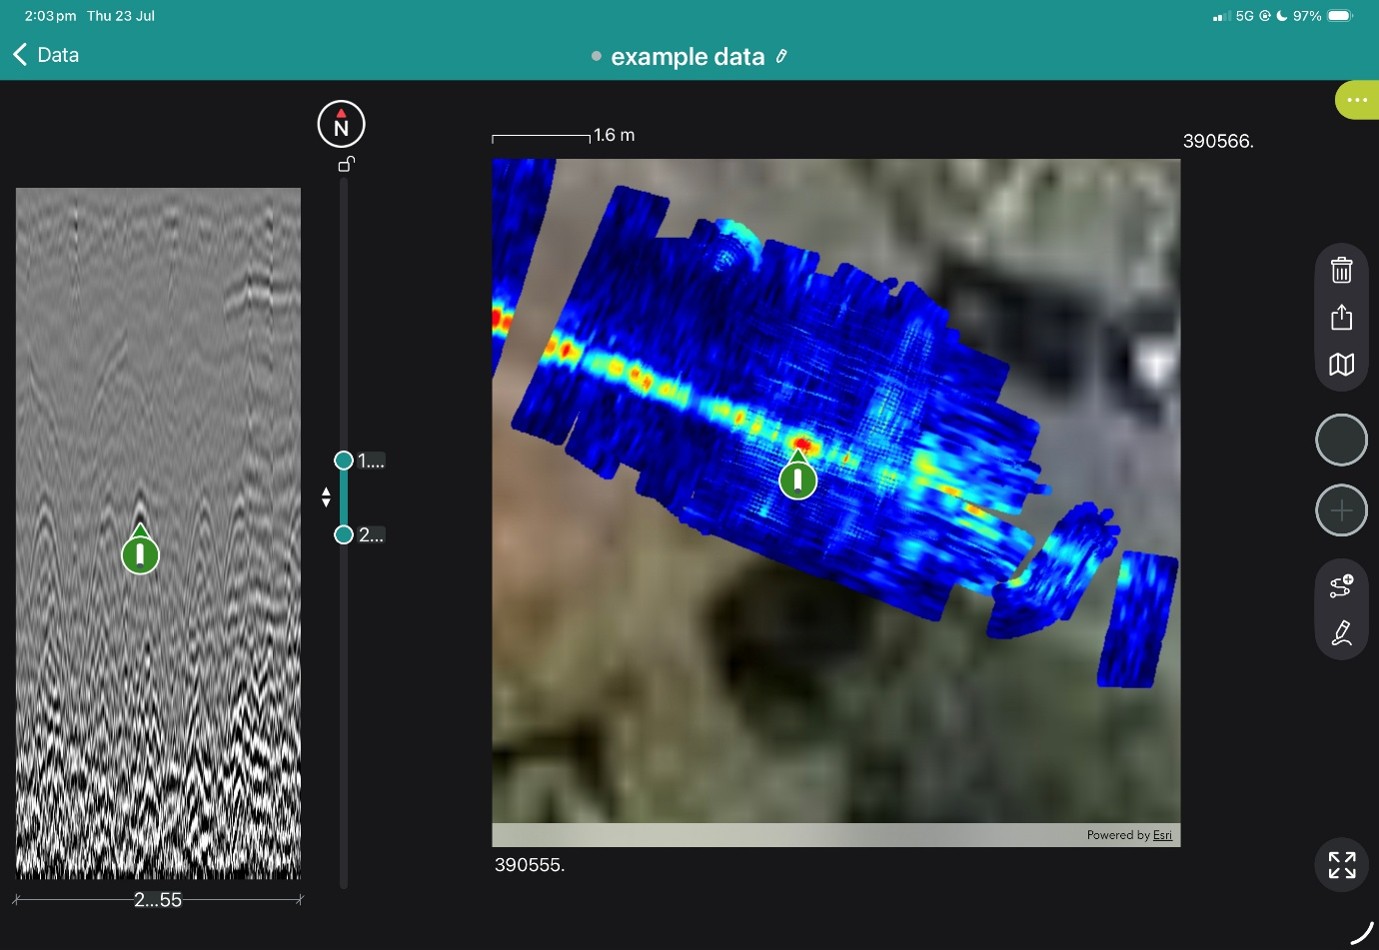
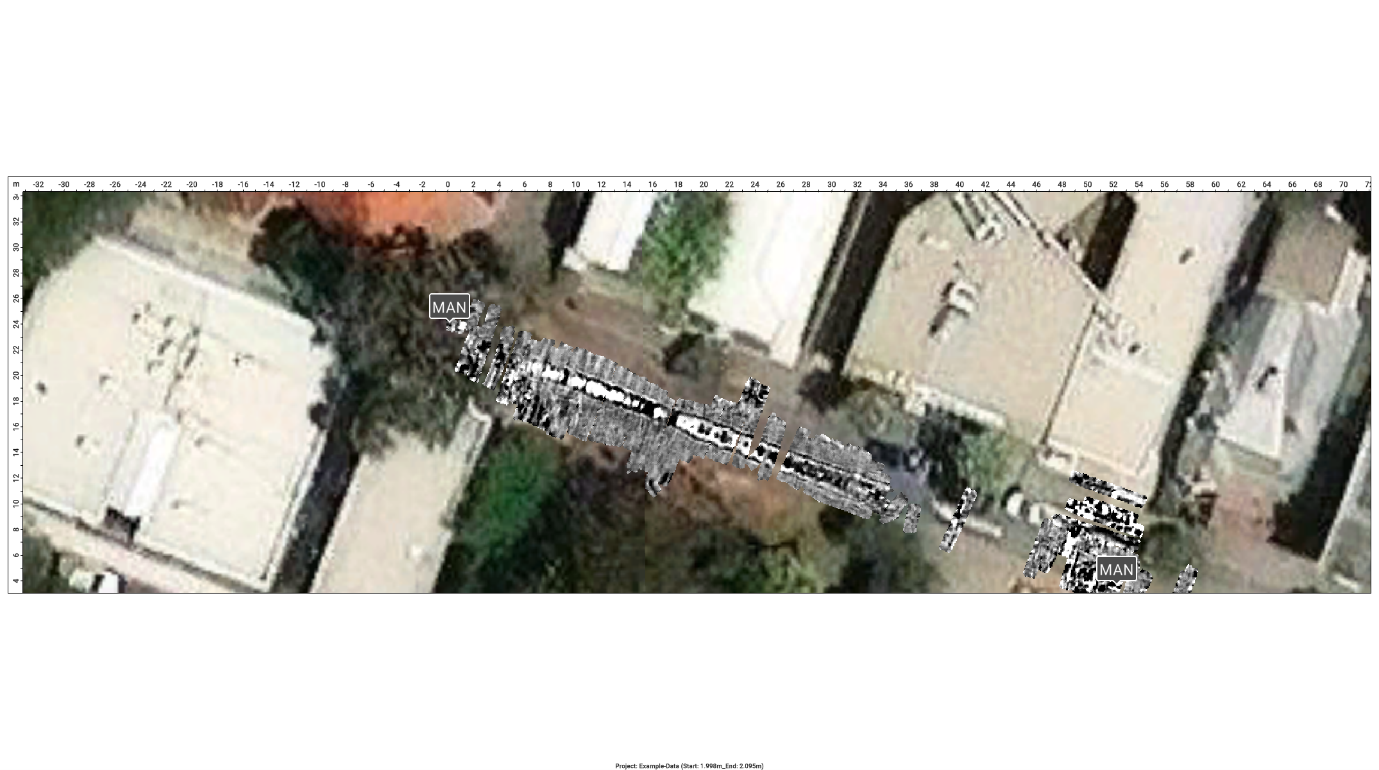
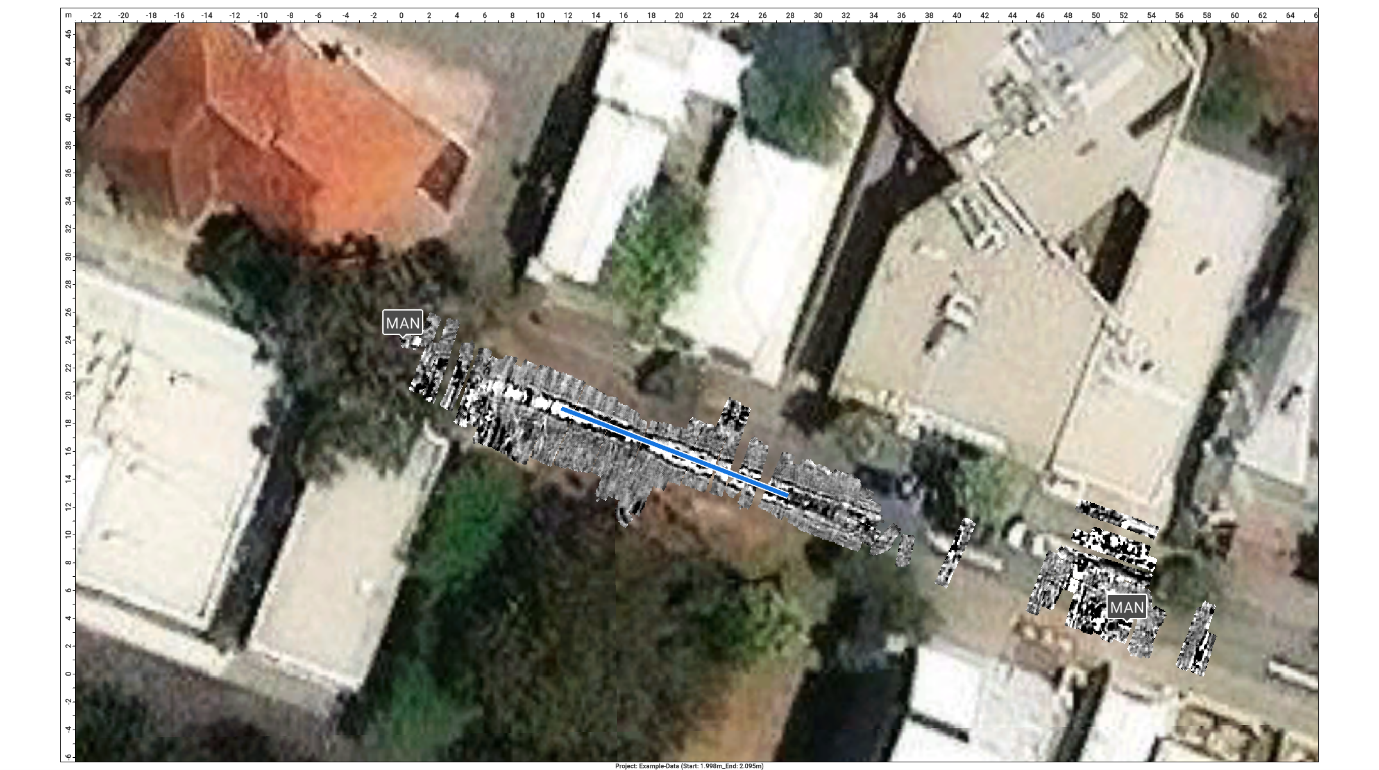
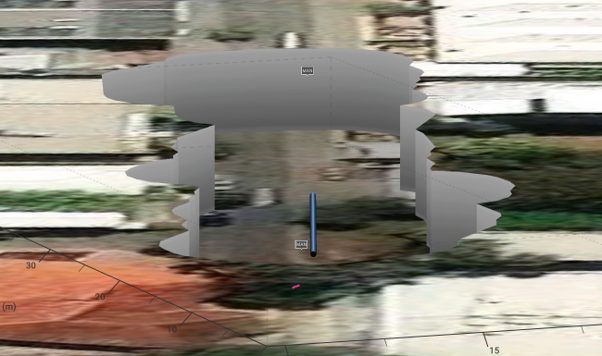
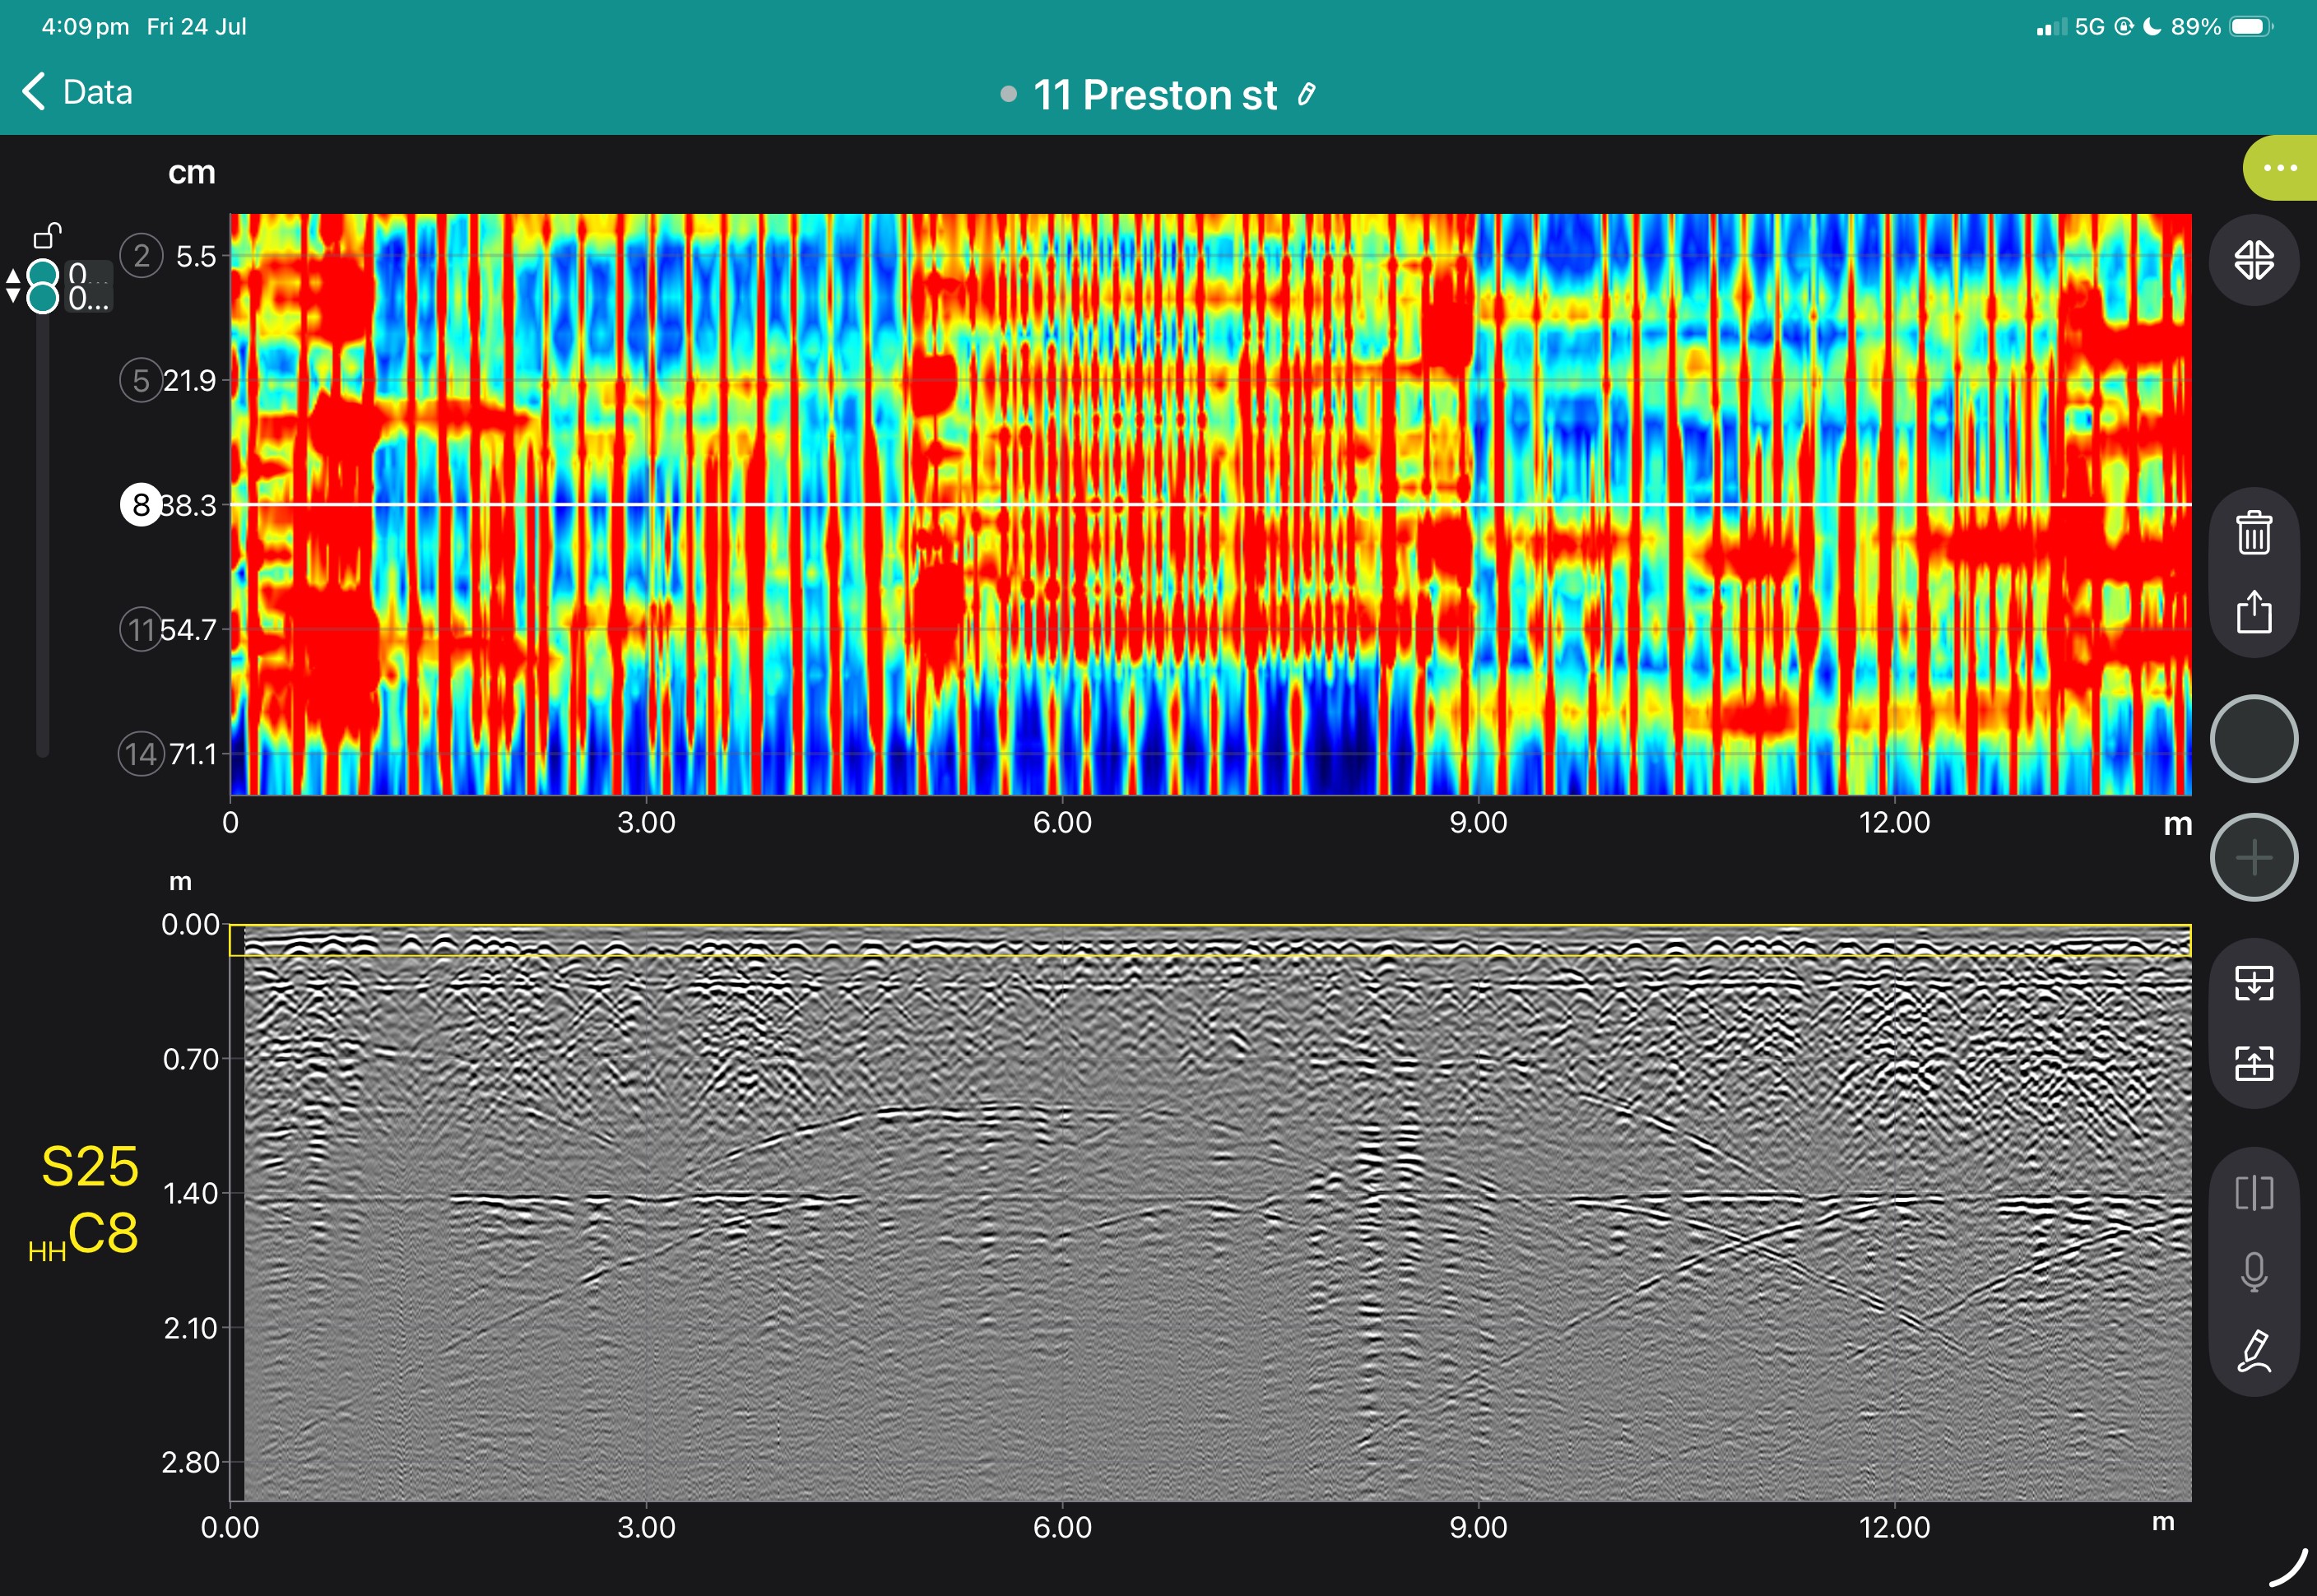
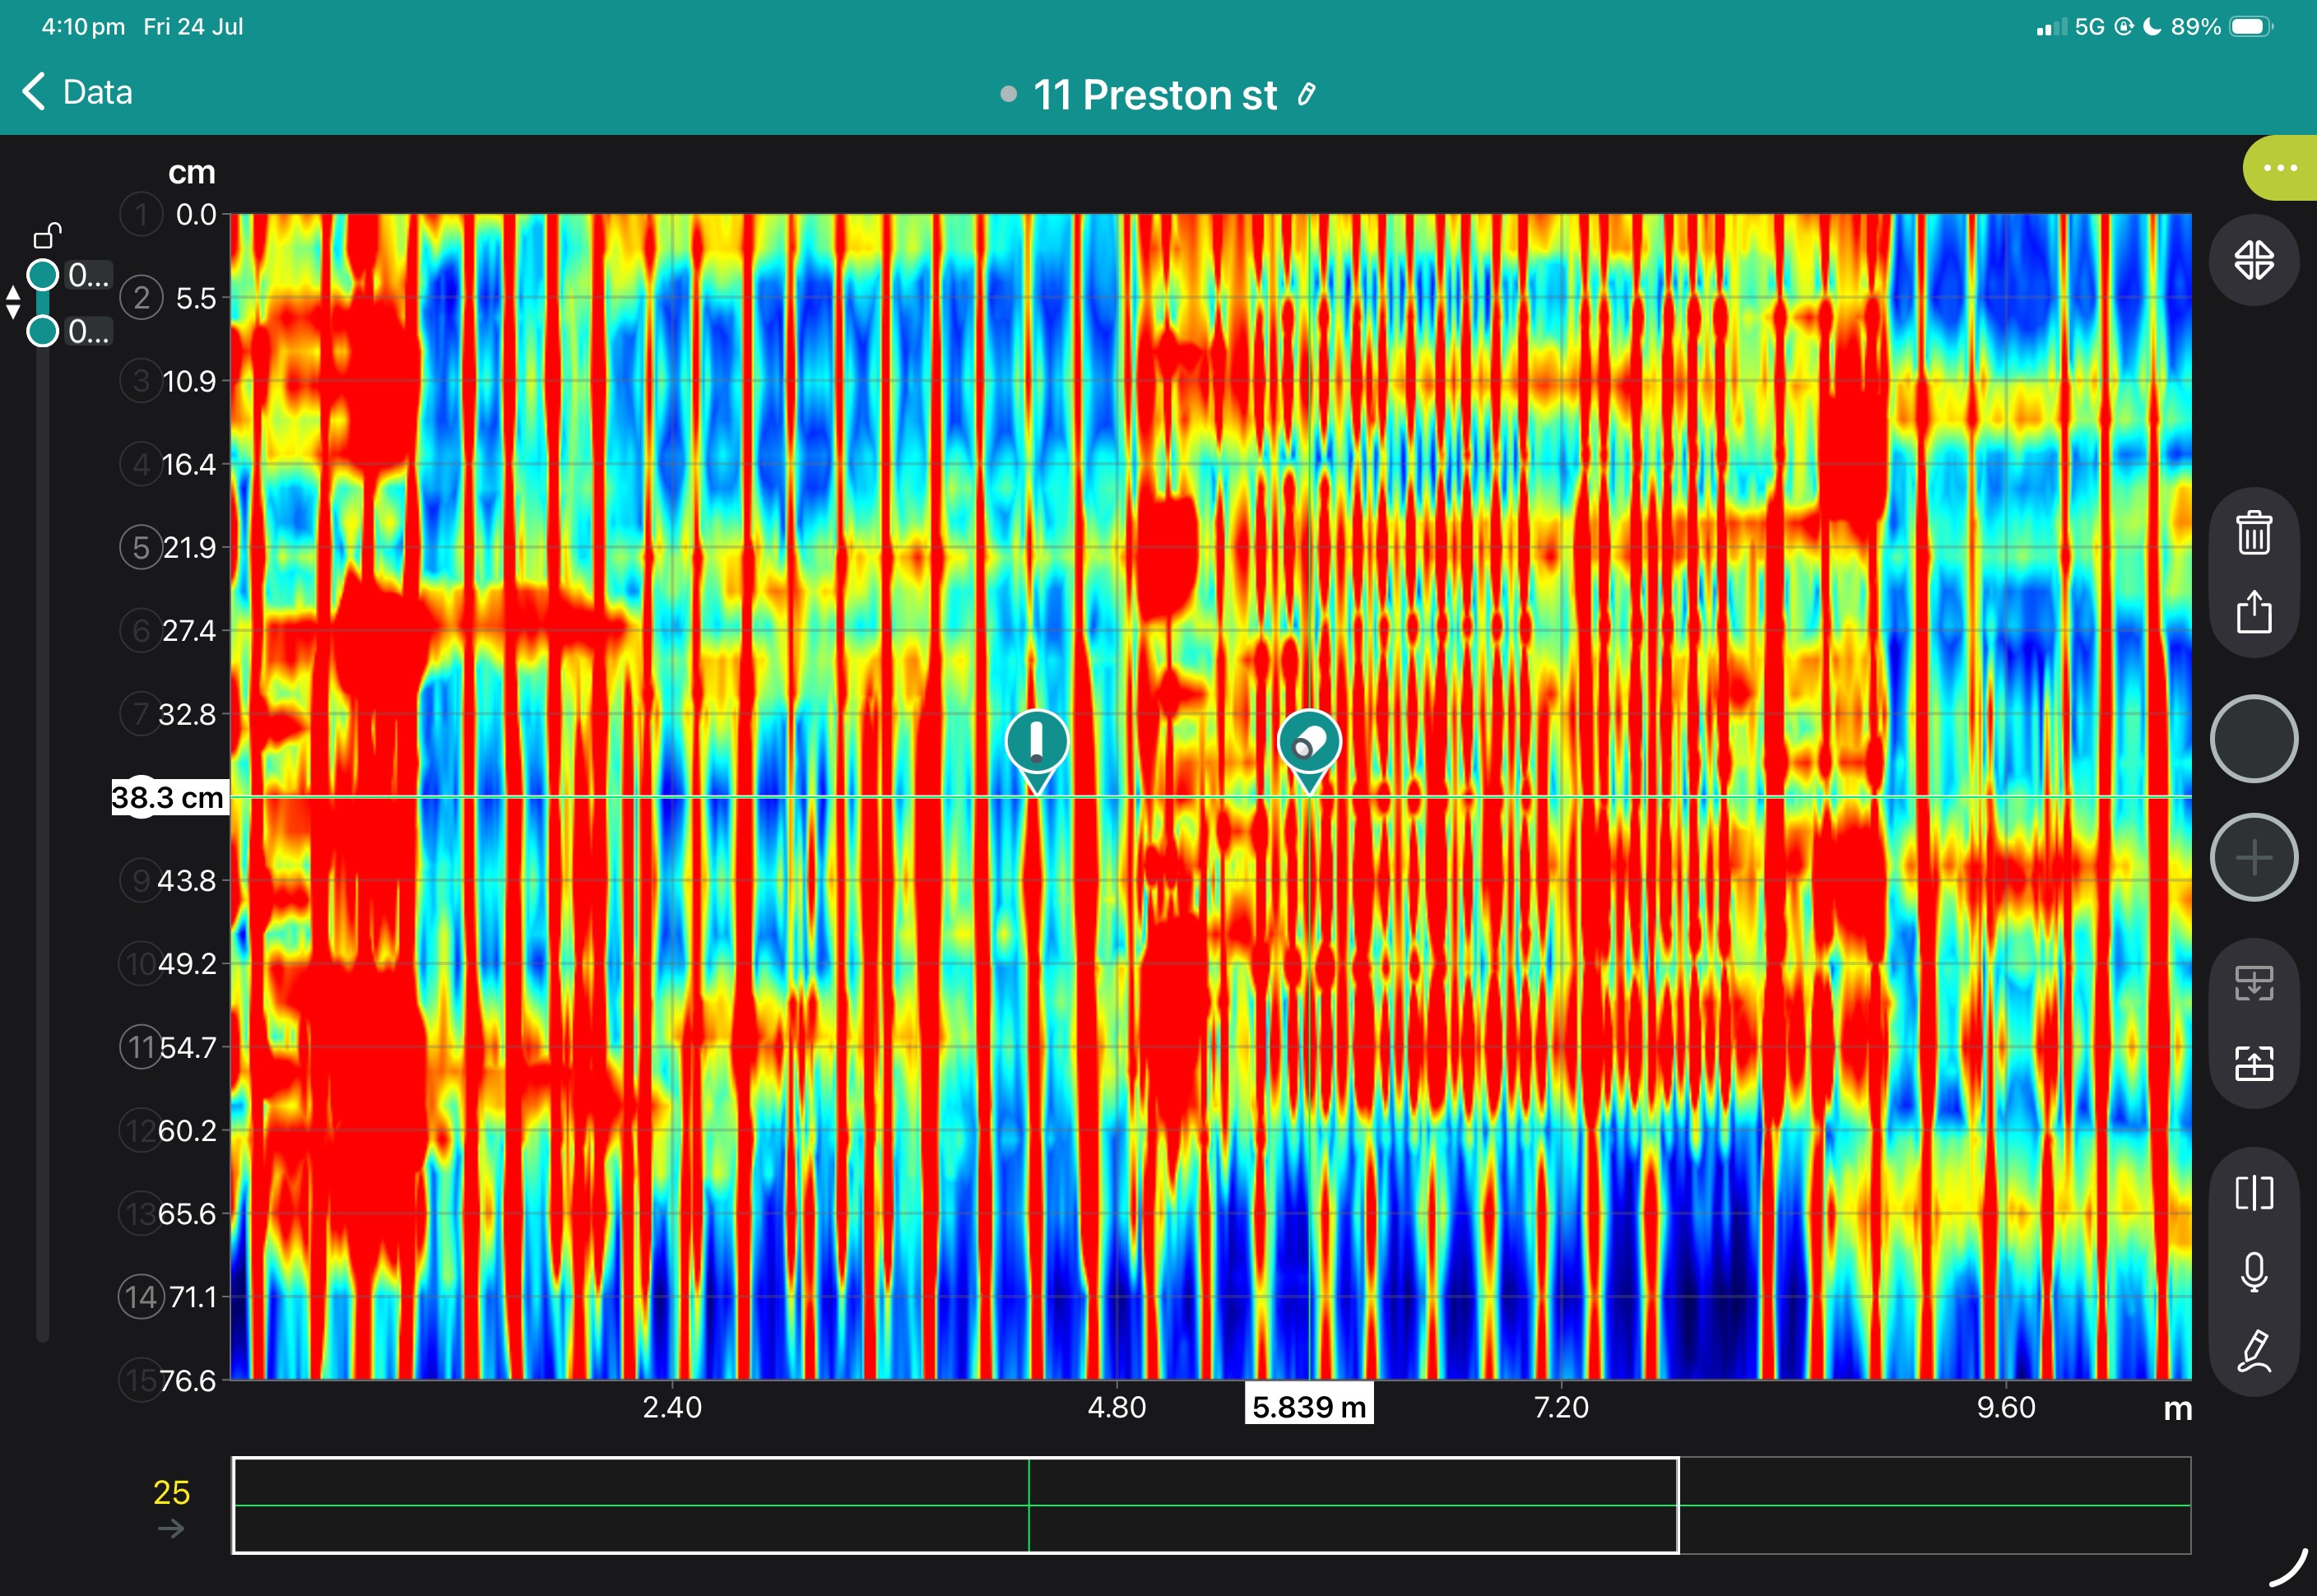
View the images below to see these in action.
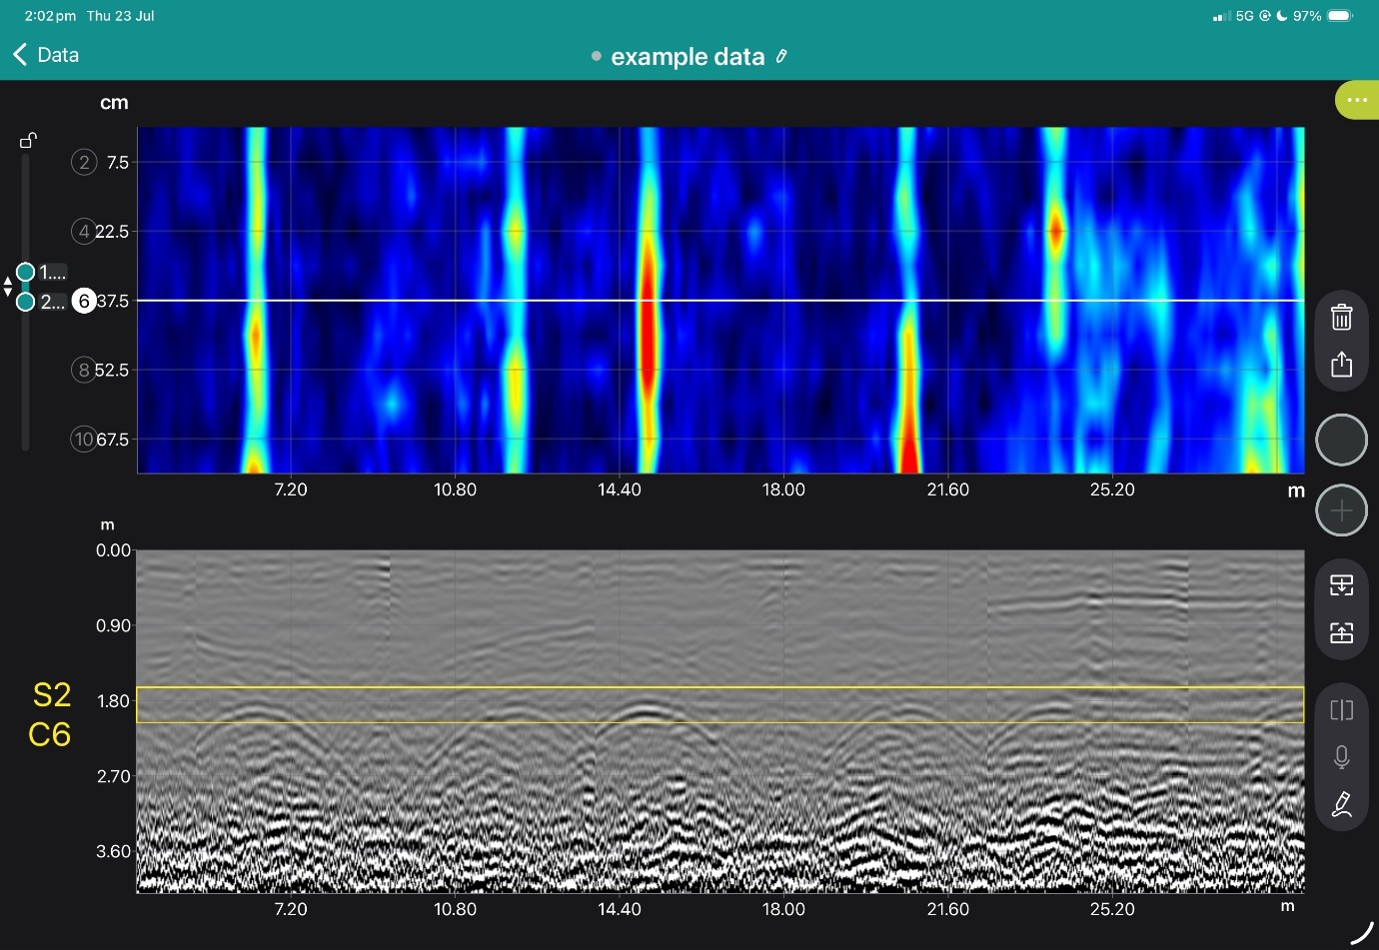
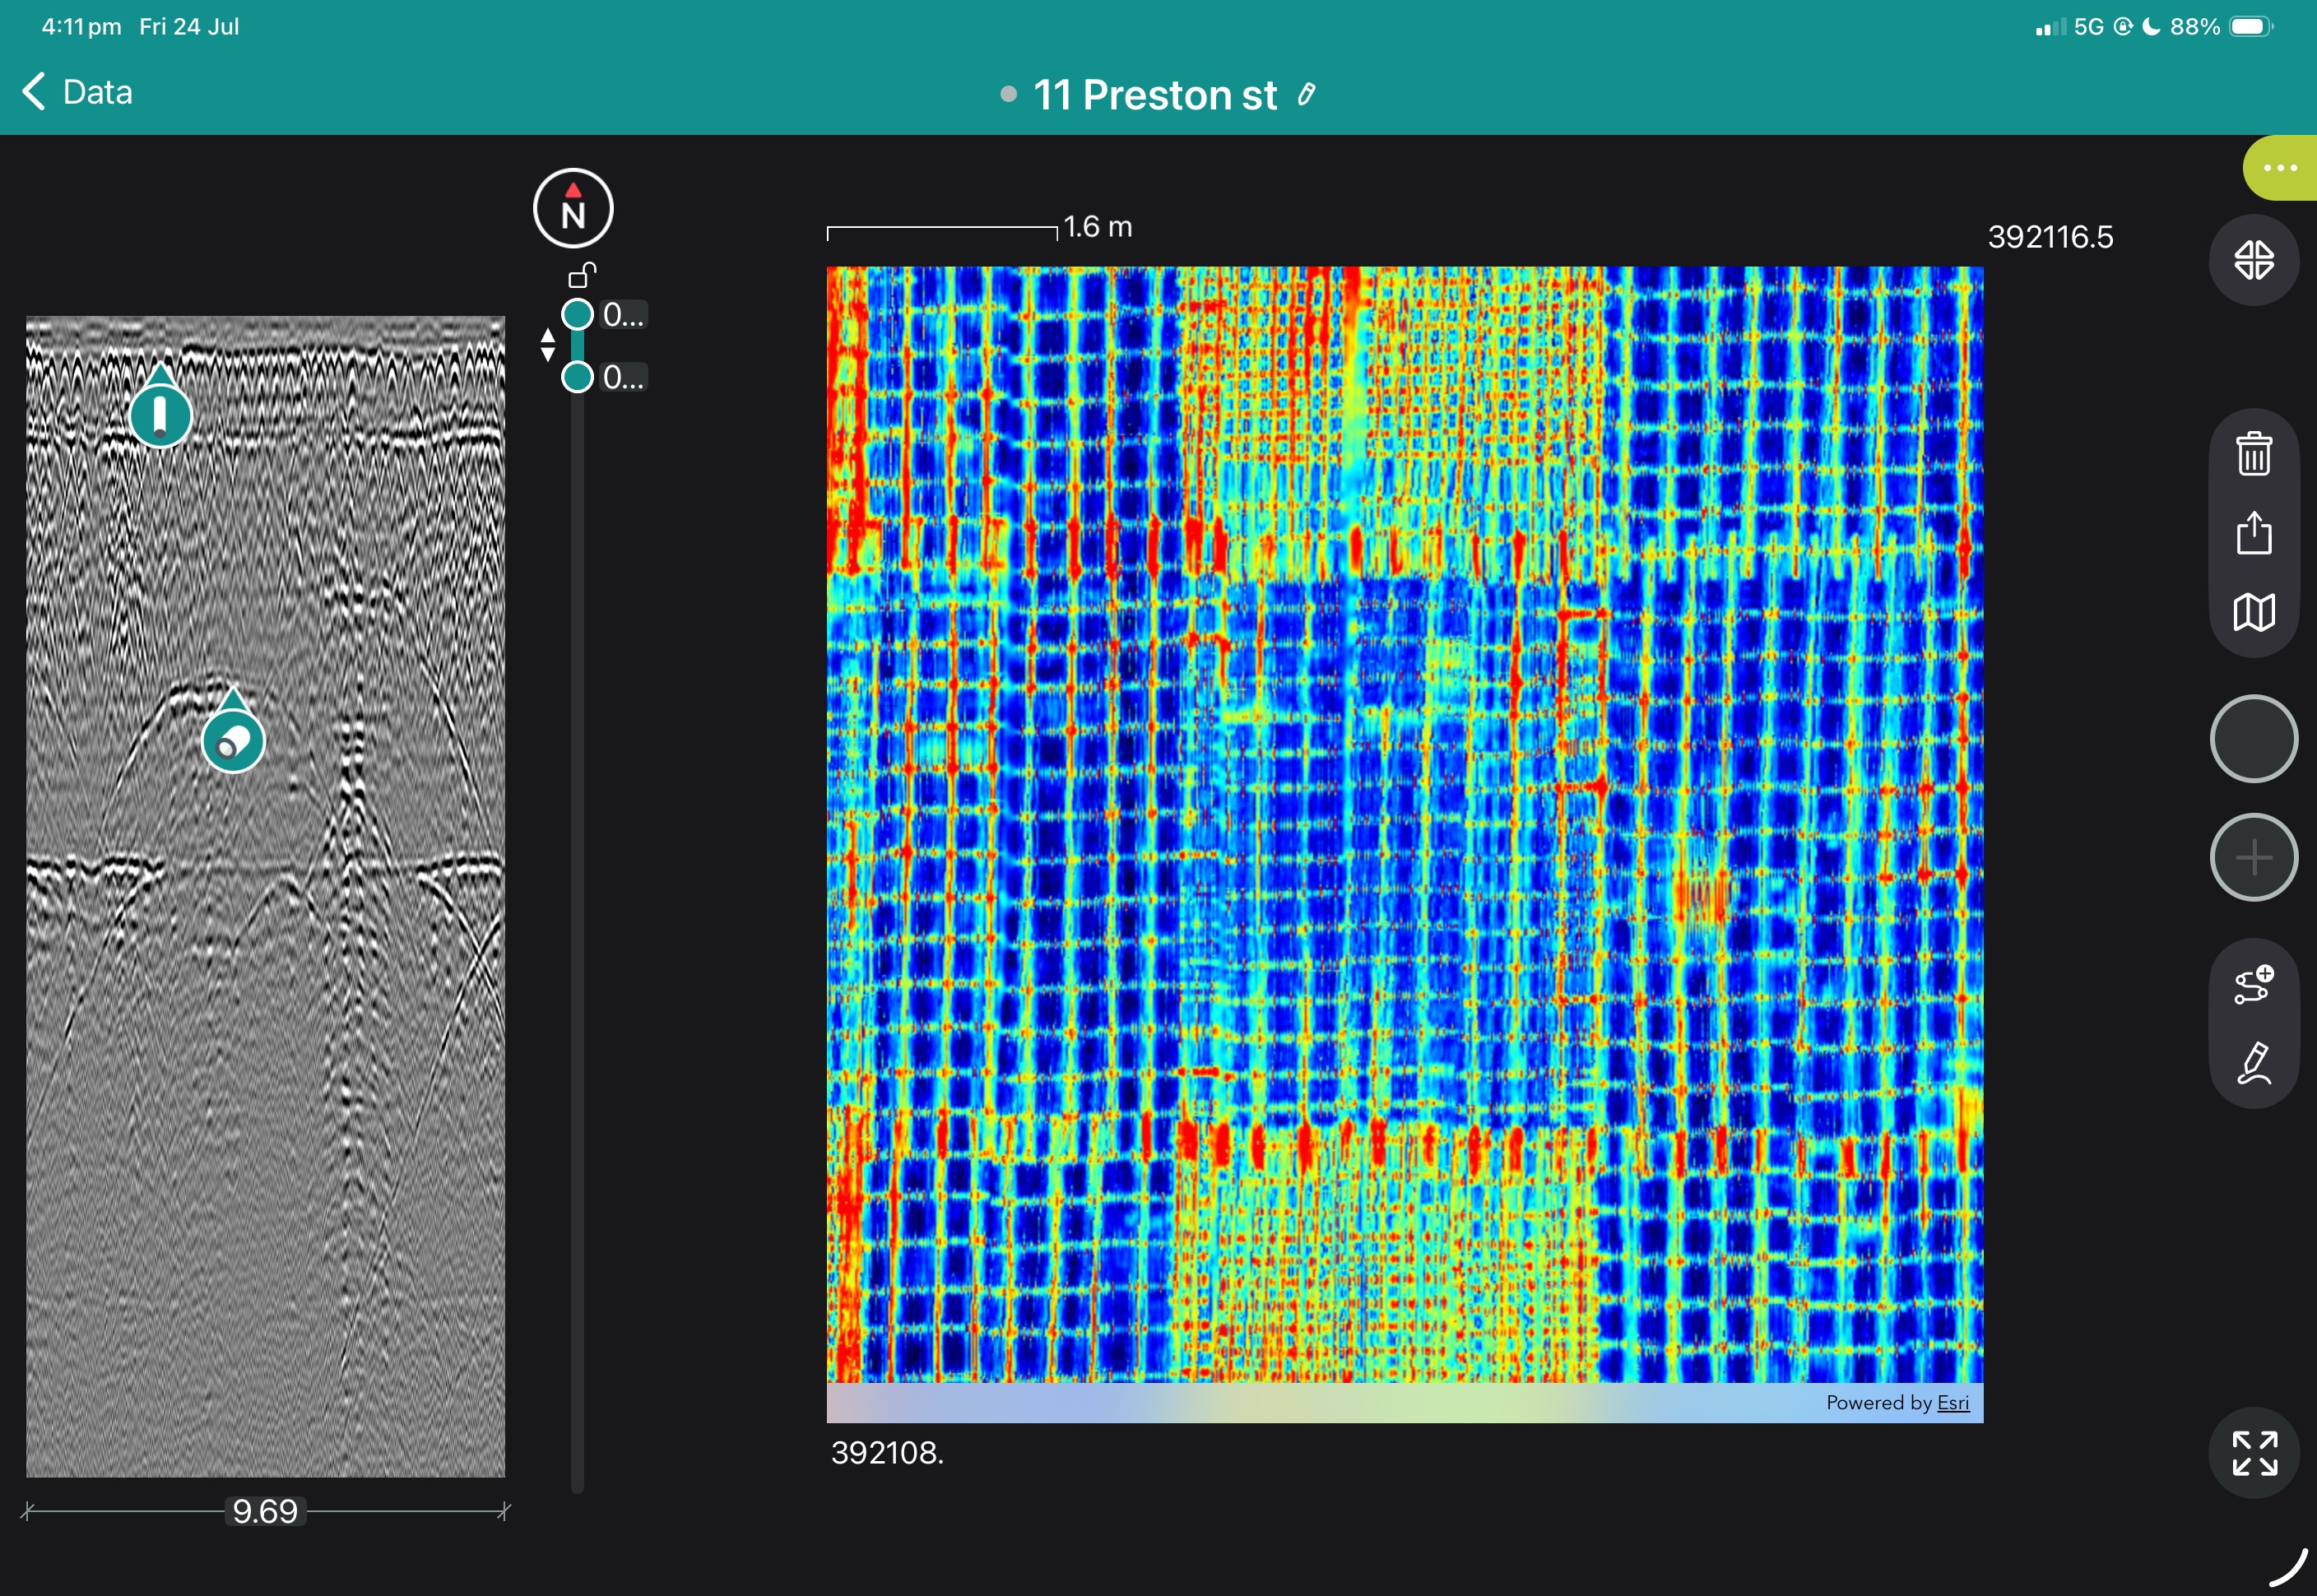
Superline and B Scan from App
Freepath and b-scan from app
Geolocated tag on freepath in app
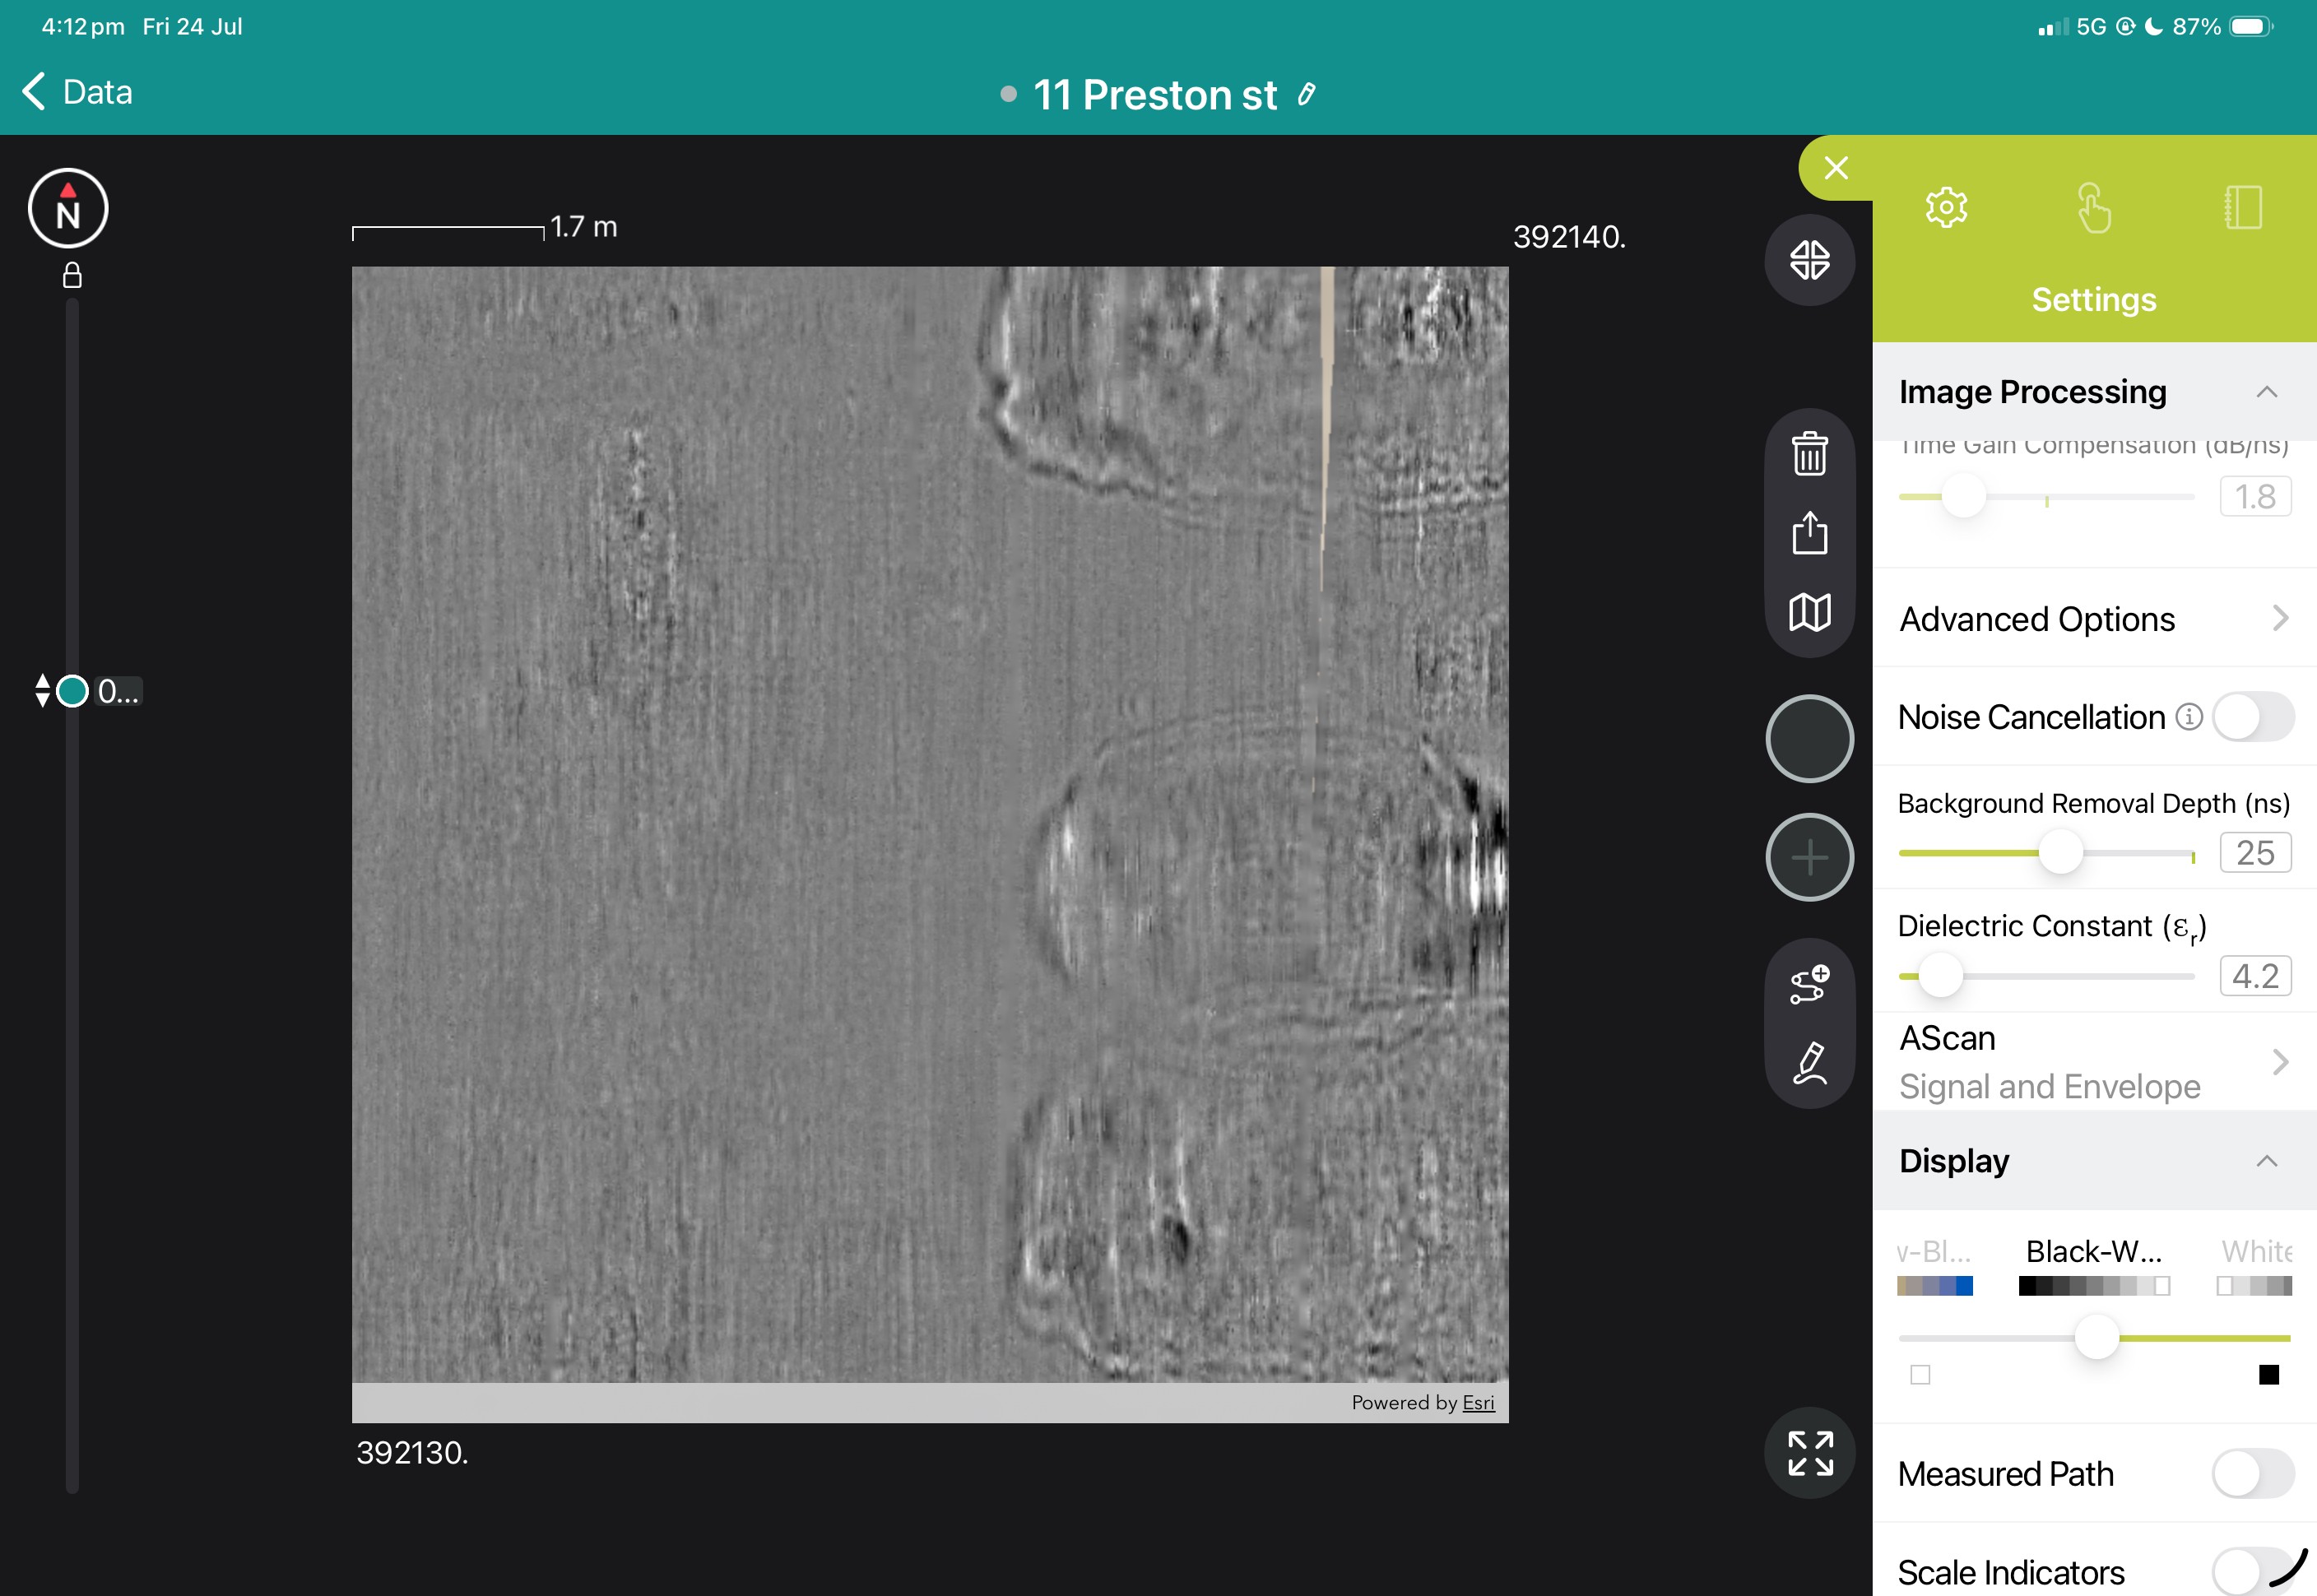
Freepath shown In GPR Insights without Hilbert Transformation
Geotagged linework added to a found sewer
3D view with a cutout showing the sewer
3d Sewer line with GPR data removed
Technology

Half Cell Potential Mapping

Measurement Units

Corrosion potential in millivolts (mV)

Connectivity

Wireless - Bluetooth

Influence Depth

First rebar layer

Measurement Range

-3000 mV to +3000 mV

Resolution

± 1 mV

No Items Found
No items found.
ASTM C876
Standard Test Method for Corrosion Potentials of Uncoated Reinforcing Steel in Concrete
Other Products...
PM8500 Technical Data Sheet

Technical data sheet for the PM8500 half cell potential mapping system.

GPR Augmented Reality Marker

Printable GPR Augmented Reality Marker, for use with AR Grid Scans.

PM8500 Quick Reference Guide

Quick reference guide for PM8500.

PM8500 Manual

Operation manual for the PM8500 corrosion mapping system.

No items found.

Screening Eagle Technologies have expanded their concrete portfolio with an advanced digital-first solution to one of the biggest challenges of the built world today – corrosion.

The light and wireless design with unique wheel electrodes enables the world’s fastest data acquisition with real-time data visualisation and analytics.

The state-of-the-art sensor comes with the powerful Profometer app software with a flexible, customisable grid, capable of handling up to 10’000 square meters scan capacity. Together, the sensor and software make the PM8500 an effective solution for any type of corrosion inspection on concrete structures such as underground parking columns, walls, slabs or bridge decks.

The half-cell method is used to identify active corrosion of rebars based on the electro chemical properties of reinforced concrete. All the Proceq electrodes (rod or wheel) are based on a Copper/Copper Sulphate (Cu/CuSO4) half-cell.

This is why the PM8500 voltage input range allows also the connection of Silver/Silver Chloride (Ag/AgCl) electrodes or Saturated Calomel (Hg/Hg2Cl2) reference electrode. The standard cable supplied may be connected to most third party rod electrodes.

Software Integration

Profometer INSPECT

Data is collected in the Profometer app for iPad, the very same application used for the Profometer PM8000 Cover Meter and rebar locator.

From there data is synchronised with Workspace, the cloud data storage system for all Proceq / Screening Eagle Technologies test systems.

For users who need to integrate Potential Mapping with other investigations, such as visual inspection, cover measurement, and laboratory reports, the latest version of Screening Eagle INSPECT will store PM8500 sensor data and allow for visualisation to be overlayed on 2D view maps of a structure.

System Features

Measurement Modes

  • Basic Mode
  • Expert Mode
  • Spot Scan (rod electrode)
  • Line Scan (wheel electrode)
  • Area Scan (wheel electrode)
  • Fixed Grid (rod electrode)
  • Flexible and Variable Grid (Wheel electrodes)

Review Modes

  • Potential View
  • Displays a heat map with the potential values
  • Statistic View
  • Distribution and cumulative distribution graph
  • Chipping Graph View
  • Displays the corroding areas based on chosen thresholds

Reference Electrode Configurations

Electrodes

The detection of the regions where active corrosion begins involves the measuring of the localized negative values of the half-cell potential (i.e. corrosion potential).

When using a rod electrode the user has to define a grid fine enough not to miss any local negative peak, while the use of a wheel electrode on the PM8500 ensures a new level of accuracy.

The wheel system is fast enough to measure the electrical potential continuously along its linear paths, ensuring the most negative measured value will always be recognized and stored with its associated location.

Why the GS9000 matters for SUE businesses

  • Increase area covered per field day
  • Reduce the number of manually positioned survey lines
  • Improve coverage in congested corridors
  • Review coverage before leaving site
  • Produce higher-value mapped deliverables
  • Combine GPR and GNSS in one workflow
  • Retain raw data for later reinterpretation
  • Expand from locating into mapping and subsurface modelling

Book a SUE Workflow Demonstration

High-resolution multichannel GPR for structures, bridges and pavements

The GX1 transforms the GS9000 into a high-resolution structural assessment system for concrete slabs, bridge decks and pavements. Its dense, dual-polarisation array captures detailed 3D data across wide areas, supporting reinforcement and cover mapping, moisture and deterioration assessment, and analysis of asphalt and pavement layers. Live visualisation helps confirm survey coverage on site, while post-processing tools produce clear, report-ready condition maps.

  • Bridge-deck reinforcement and condition mapping
  • Concrete-cover mapping
  • Reinforcement layout and spacing
  • Moisture-related and deterioration mapping
  • Asphalt and pavement-layer thickness
  • Road and runway investigations
  • Detection of embedded features
  • Large-area concrete-slab investigations
  • Comparative and repeat surveys

The structural assessment workflow

1. Define the inspection area

Import the structure, bridge, pavement or survey background.

2. Collect closely spaced profiles

Capture 35 longitudinal and 15 cross-polarised channels with dense spacing.

3. Review coverage in the field

Use live radargrams and time slices to confirm that the required area has been captured.

4. Process the dataset

Apply velocity, gain, background removal, migration, filtering and topographic correction as appropriate.

5. Generate diagnostic maps

Create depth slices, reinforcement maps, layer information or application-specific condition maps.

6. Integrate with the engineering assessment

Export figures, mapped anomalies and raw data for inclusion in the engineer’s final interpretation and report.

Structural outputs and engineering value

Field information

  • Live radargrams
  • Coverage map
  • Time-slice preview
  • Field annotations

Processed Diagnostic Information

  • 2D and 3D views
  • Depth slices
  • Reinforcement patterns
  • Cover trends
  • Layer-thickness information
  • Comparative amplitude or condition maps

Engineering deliverables

  • Georeferenced maps
  • Marked investigation areas
  • Selected radar profiles
  • Exported images and datasets
  • CAD/GIS overlays
  • Report-ready figures

When to use the GS9000 rather than a handheld GPR

Use a handheld or single-channel GPR when…

Use the GS9000 when…

  • The inspection area is small
  • You need local marking before drilling
  • Rapid spot checks are sufficient
  • Manoeuvrability is the main priority
  • The output is primarily site marking
  • Large areas must be covered
  • A completely mapped dataset is required
  • Large datasets are required
  • Productivity and spatial continuity are priorities
  • The output must support reporting or engineering interpretation

Book a Structural Assessment Demonstration

One GS9000 platform

  • Onboard instantaneously mapped results
  • Interchangeable array modules
  • Foldable carbon-fibre cart
  • Rear-wheel encoders
  • Hot-swappable power banks
  • Wireless iPad operation
  • IP65 protection
  • Integrated GNSS
  • Approximately 1–5 cm real-time GNSS accuracy where suitable corrections and conditions are available
  • Free-path and structured survey methodologies

Field software, post-processing and Workspace

Field App

Workspace

GPR Insights post-processing

  • Live radargrams and time slices
  • Satellite, GNSS and CAD overlays
  • Tags, photographs, voice markers and linework
  • Field calibration and processing
  • Immediate review of survey coverage
  • Synchronise projects
  • Store and share data
  • Collaborate remotely
  • Run connected GNSS and conversion services
  • Share projects through a URL
  • Merge multiple field projects
  • Advanced 2D and 3D visualisation
  • Filtering and migration
  • Topographic correction
  • Application-specific mapping tools

Configurations and what is included

GS9000 cart with:

  • GX1 and/or GX2 array option
  • MA8000 GNSS receiver and correction options
  • Latest version of GS App with live updates
  • Advanced GPR Insights processing software access
  • Cloud storage on Workspace
  • Batteries and chargers
  • Training
  • Commissioning
  • Kit with all required cables and tools

Why purchase from PCTE

  • Australian and New Zealand application advice
  • Local demonstrations
  • Configuration selection
  • On-site commissioning
  • Operator training
  • Data interpretation and workflow training
  • Local technical support
  • Service and repair coordination
  • Assistance with GNSS, coordinate systems and deliverables
  • Access to related GPR and structural NDT equipment

Heading 1

Heading 2

Heading 3

Heading 4

Heading 5
Heading 6

Lorem ipsum dolor sit amet, consectetur adipiscing elit, sed do eiusmod tempor incididunt ut labore et dolore magna aliqua. Ut enim ad minim veniam, quis nostrud exercitation ullamco laboris nisi ut aliquip ex ea commodo consequat. Duis aute irure dolor in reprehenderit in voluptate velit esse cillum dolore eu fugiat nulla pariatur.

Block quote

Ordered list

  1. Item 1
  2. Item 2
  3. Item 3

Unordered list

Text link

Bold text

Emphasis

Superscript

Subscript