Pundit Lab

The Pundit Lab is a flexible Ultrasonic Pulse Velocity system designed for use in the CMT or research laboratory.

$ 0.00 AUD

Variant out of stock, you may request a backorder quote. Please list the product specifications in the text field.

Request Quote
Thank you! Your submission has been received!
Oops! Something went wrong while submitting the form.

GS9000 Multichannel GPR for 3D Utility Mapping and Structural Assessment

Overview | GX1 vs GX2 | SUE & Utilities | Structures & Pavements | Software & Outputs | Case Studies | Specifications | Support

Discuss Your Application

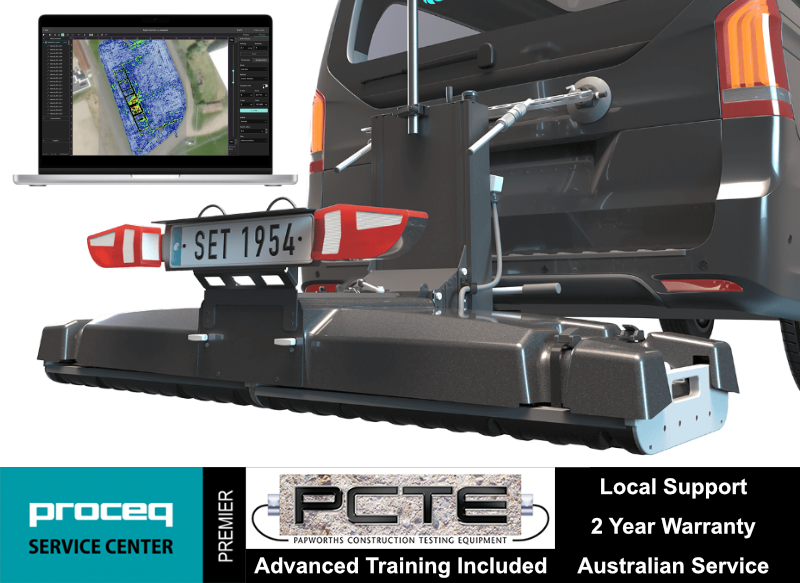
Collect high-density, georeferenced GPR data across wide areas and view the subsurface in 3D as you scan. Choose the GX2 array for SUE and utility mapping, or the GX1 array for structural, bridge and pavement investigations.

Book a GS9000 Demonstration

Best suited to:

  • Subsurface utility engineering
  • Utility locating and mapping
  • Civil and survey contractors
  • Road and corridor investigations
  • Void and subsurface anomaly surveys

Best suited to:

  • Bridge-deck investigations
  • Concrete cover and moisture mapping
  • Pavement and asphalt-layer assessment
  • Reinforcement mapping
  • Structural deterioration surveys

Recommended array: GX2

Recommended array: GX1

Why use the GS9000 instead of a conventional single-channel GPR?

Cover more ground

Collect multiple parallel profiles in one pass instead of uilding a grid line by line.

See results during acquisition

View georeferenced radargrams and time-slice information in the field rather than waiting until the data is returned to the office.

Produce repeatable mapped data

Combine wheel-positioned GPR data with GNSS, project coordinates and survey linework.

Use one platform for two very different applications

Exchange GX1 and GX2 arrays without purchasing two complete cart platforms.

High-density 3D GPR mapping for SUE and utility investigations

The GX2 transforms the GS9000 into a high-density subsurface utility mapping system. Its 11-channel, low-frequency GPR array captures an 83 cm-wide swath in each pass, helping operators detect and map buried pipes, ducts, cables, voids and other subsurface features. Live georeferenced data lets SUE teams review coverage on site and produce accurate CAD, GIS and project-coordinate deliverables.

  • Utility corridor mapping
  • Detection of pipes, ducts and cables
  • Mapping non-conductive services that may not respond to electromagnetic locating
  • Congested service investigations
  • Road-crossing and easement surveys
  • Potential void and cavity investigation
  • Pre-excavation and design-stage surveys
  • Utility mapping to project or local coordinates

The SUE field workflow

1. Plan the survey

Load satellite imagery, CAD information, project coordinates or survey control.

2. Collect dense multichannel data

Survey an approximately 0.82 m-wide swath with 11 channels in each pass.

3. Review data live

Examine radargrams, georeferenced time slices and marked features while still on site.

4. Interpret and digitise

Add points, linework, tags, photographs and field observations.

5. Process and deliver

Merge survey areas, apply processing and export mapped information for the customer’s CAD, GIS or reporting workflow.

SUE Outputs and Deliverables

  • Georeferenced time-slice maps
  • Radar profiles
  • Utility alignments and interpreted linework
  • Depth estimates
  • Survey trajectory
  • Points of interest
  • Field photographs and annotations
  • CAD, SHP and KML outputs
  • SEG-Y raw-data export
  • Project-coordinate and local-grid outputs
  • PDF or shareable project reports

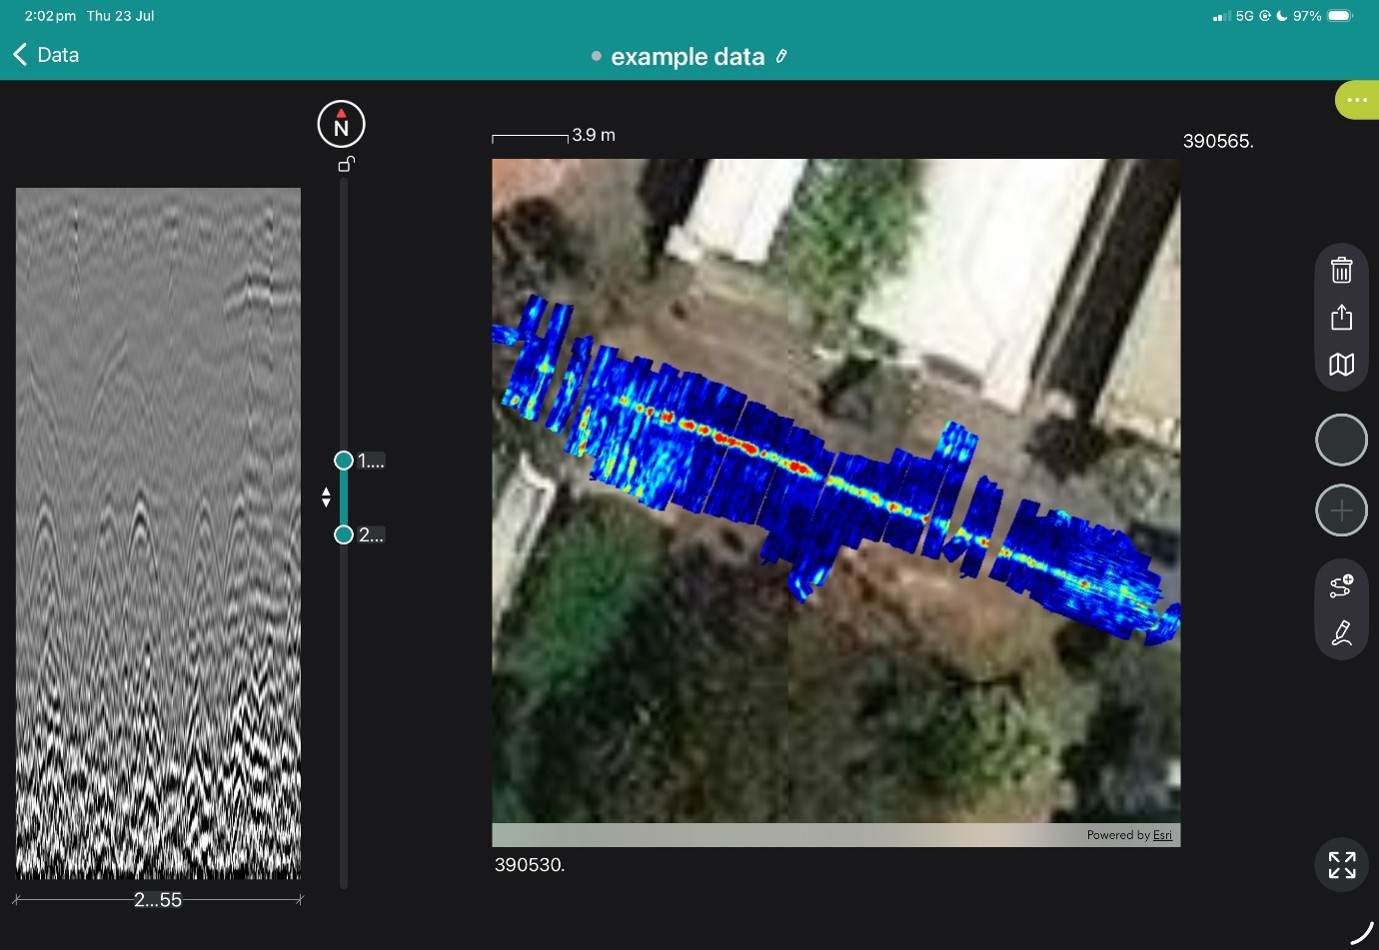
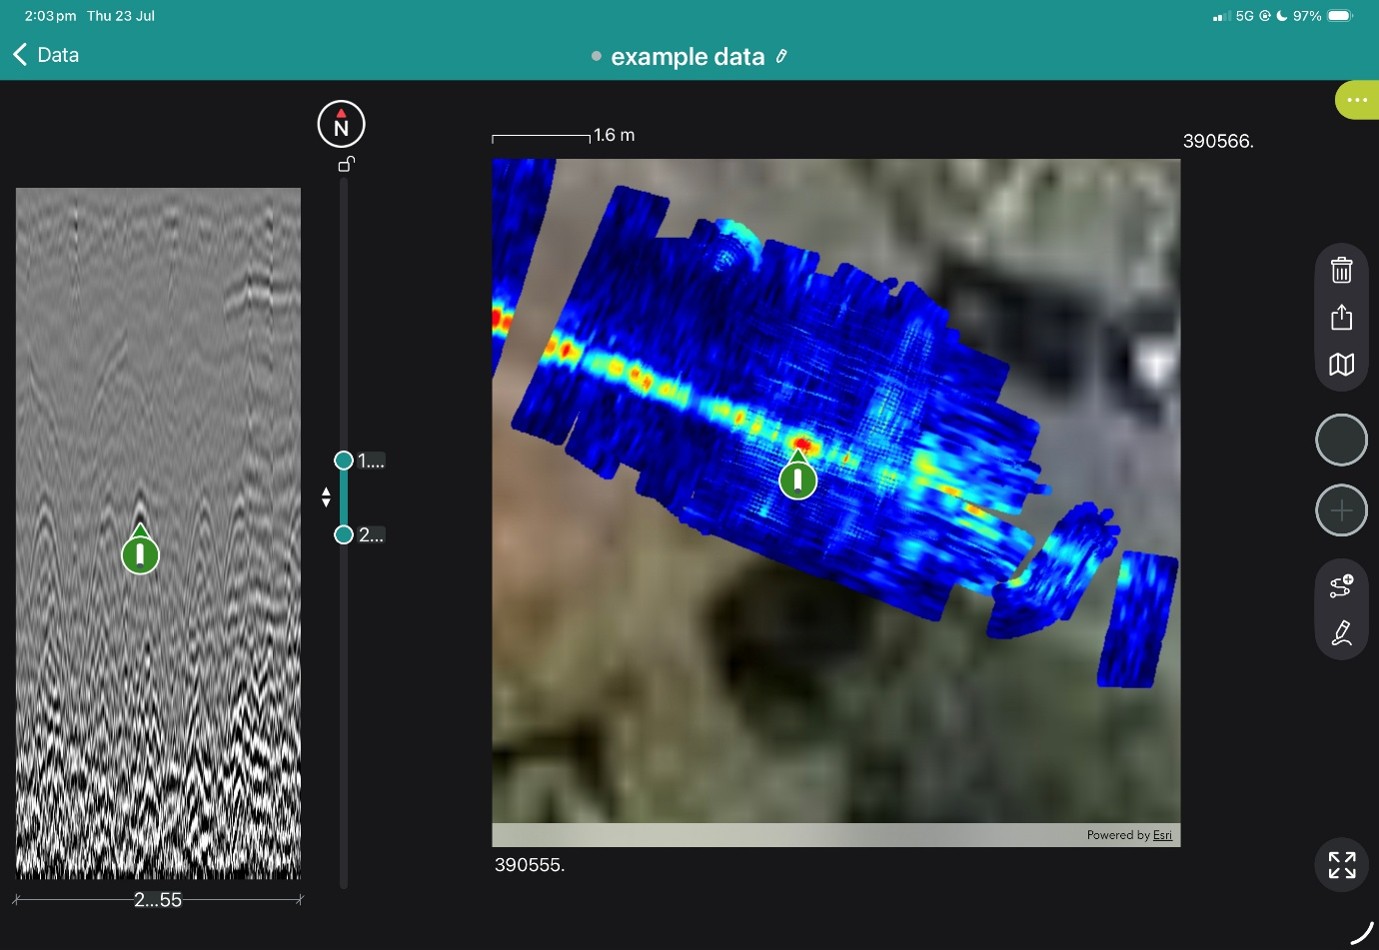
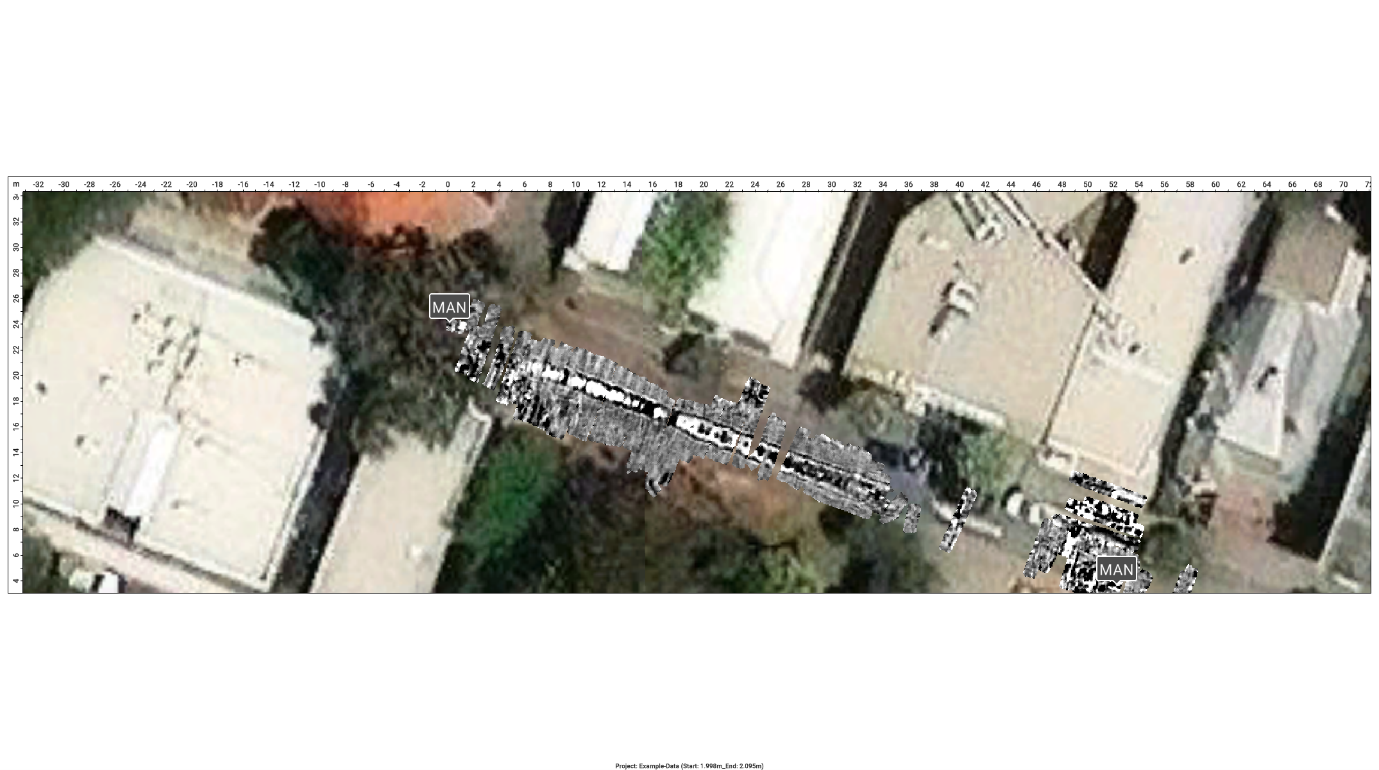
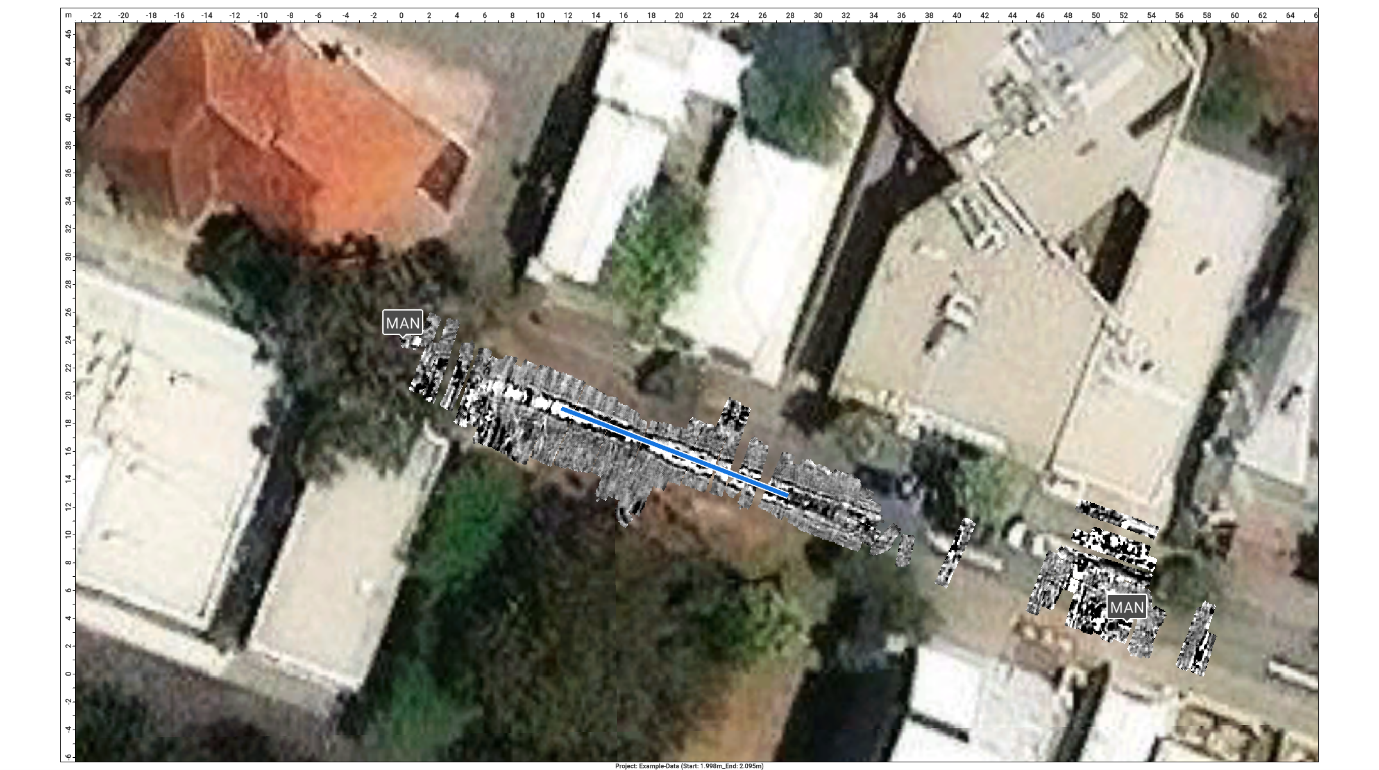
View the images below to see these in action.
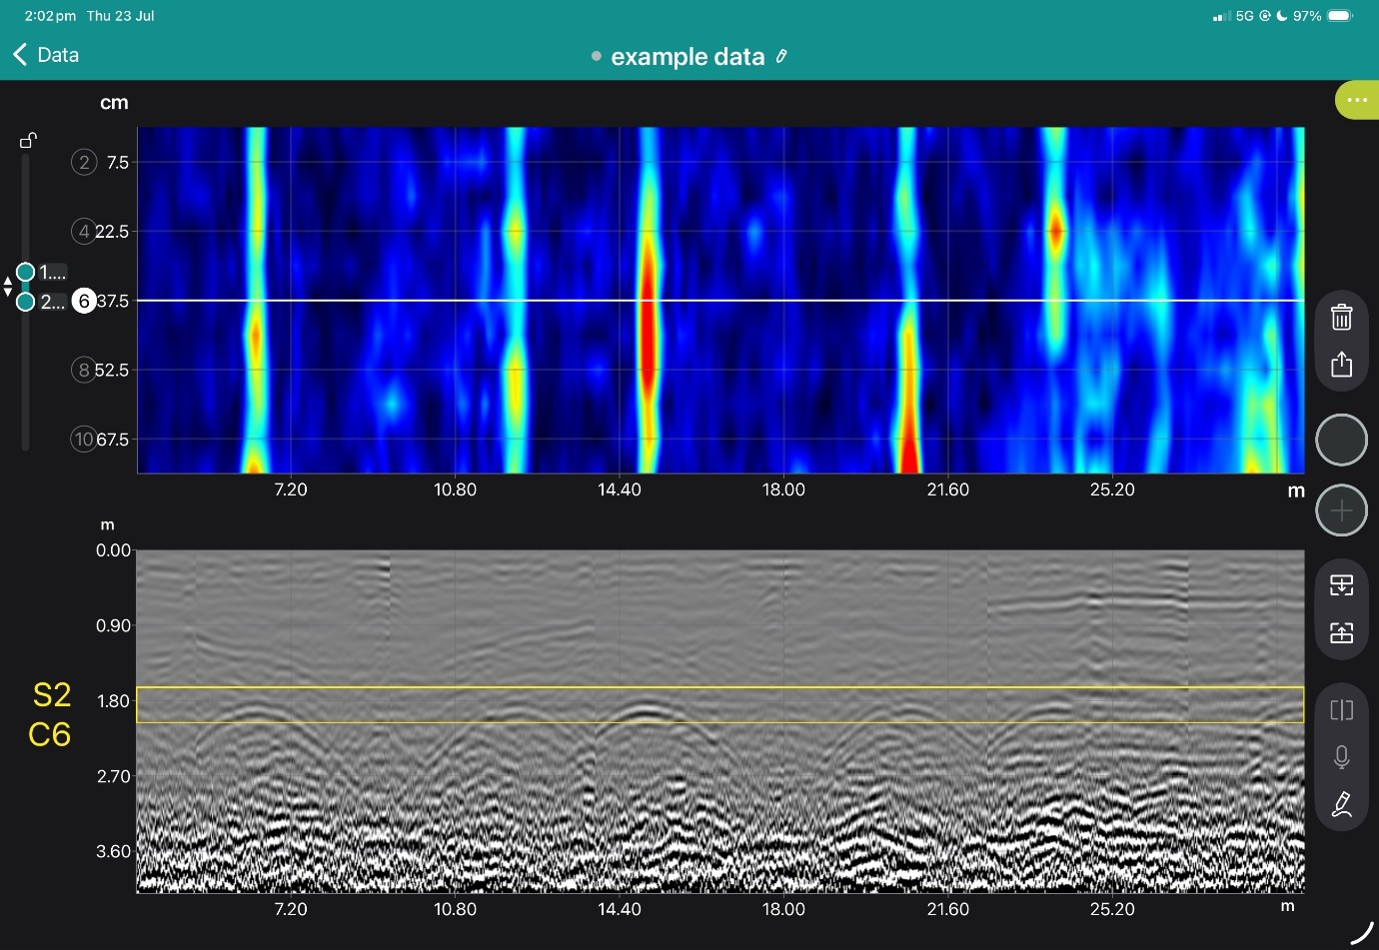
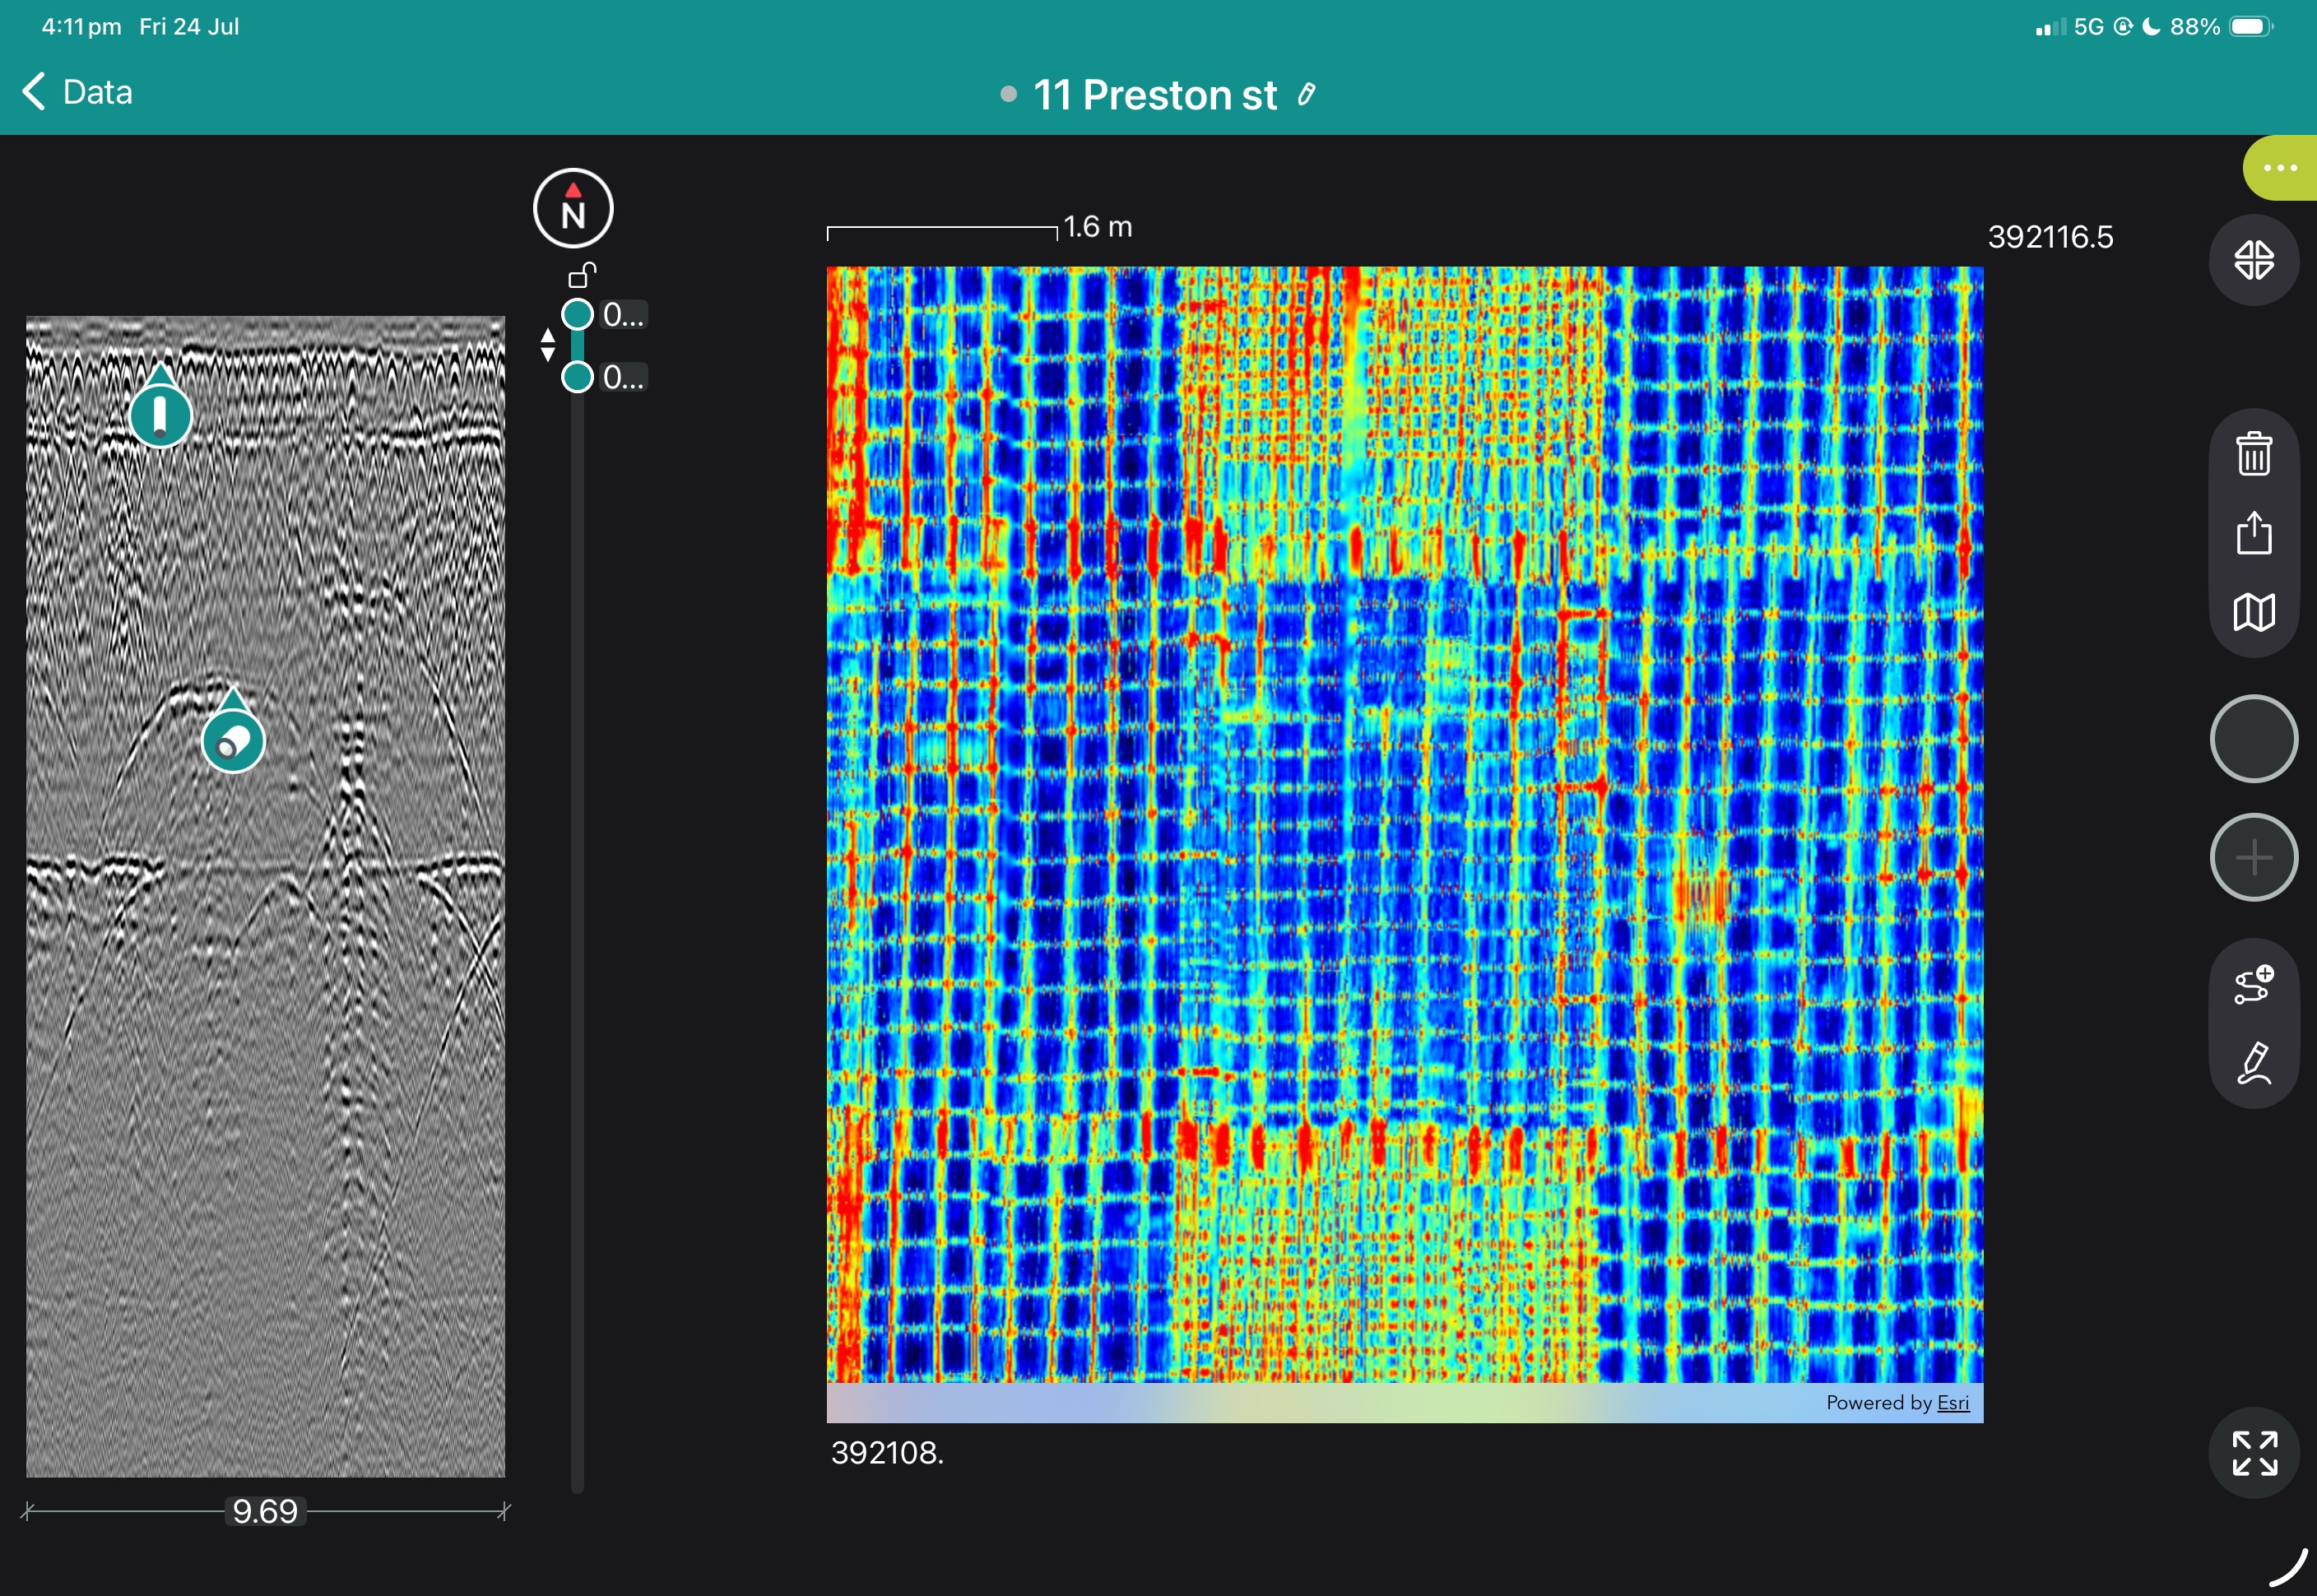
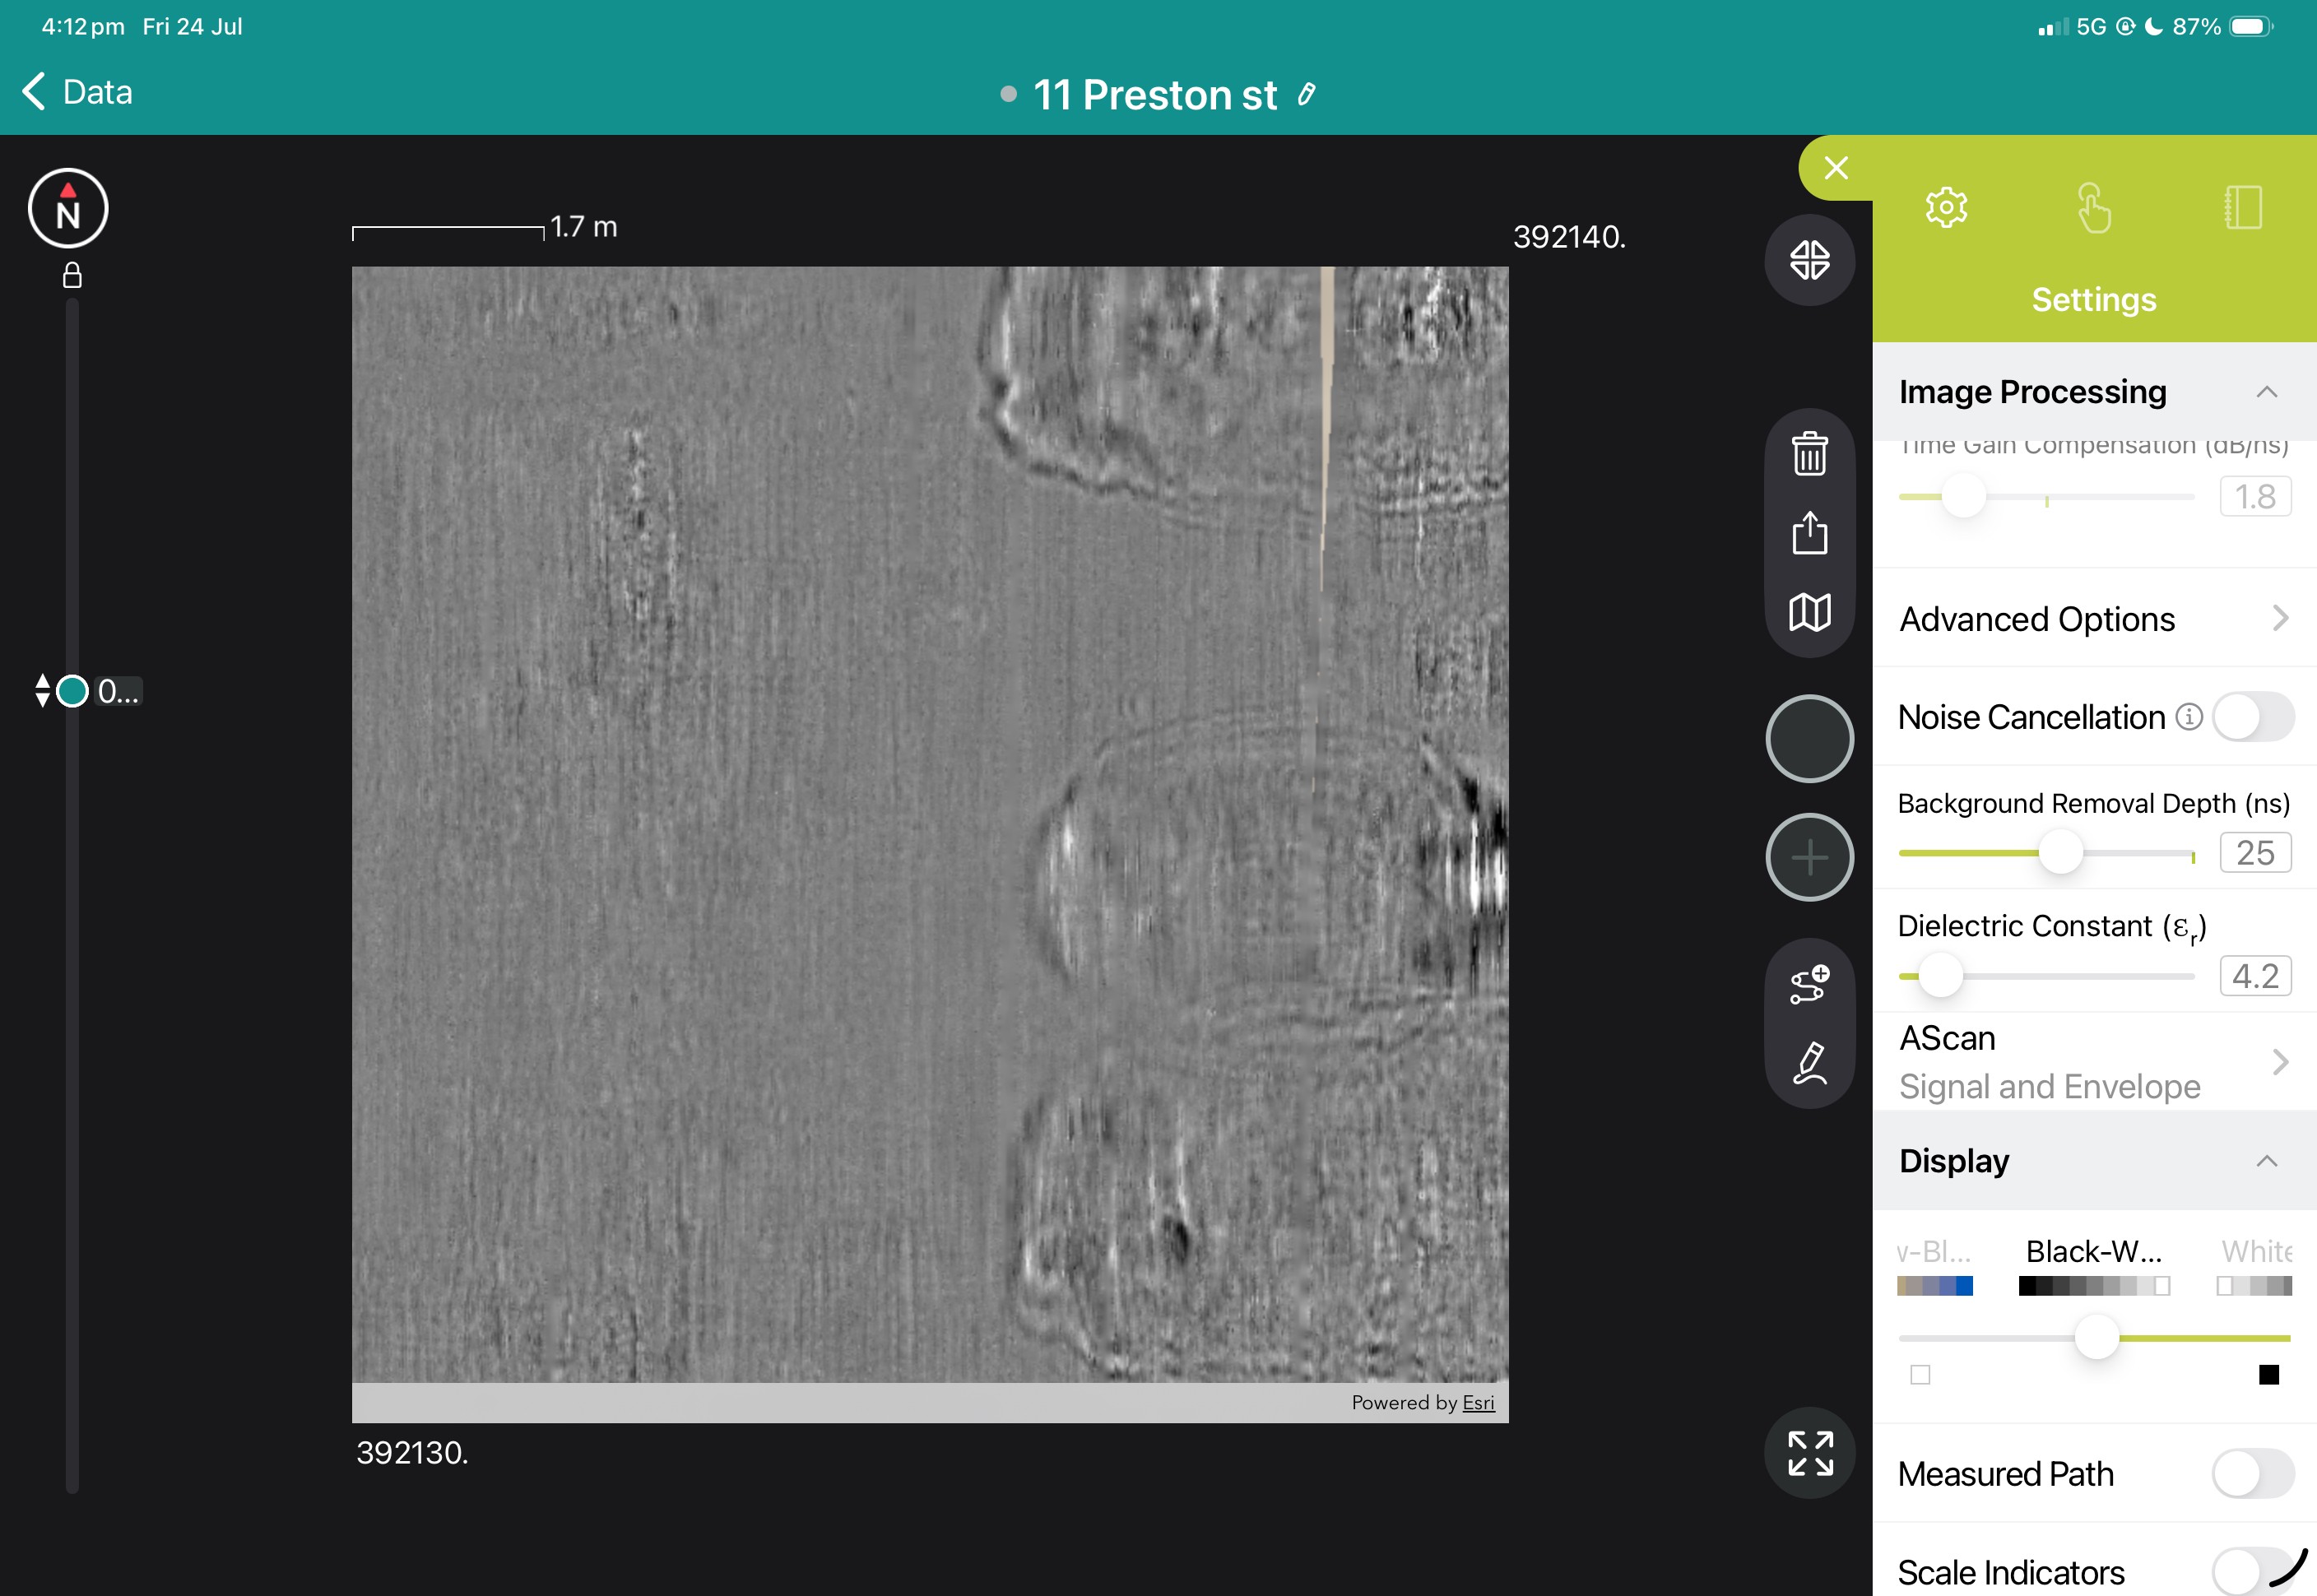
Superline and B Scan from App
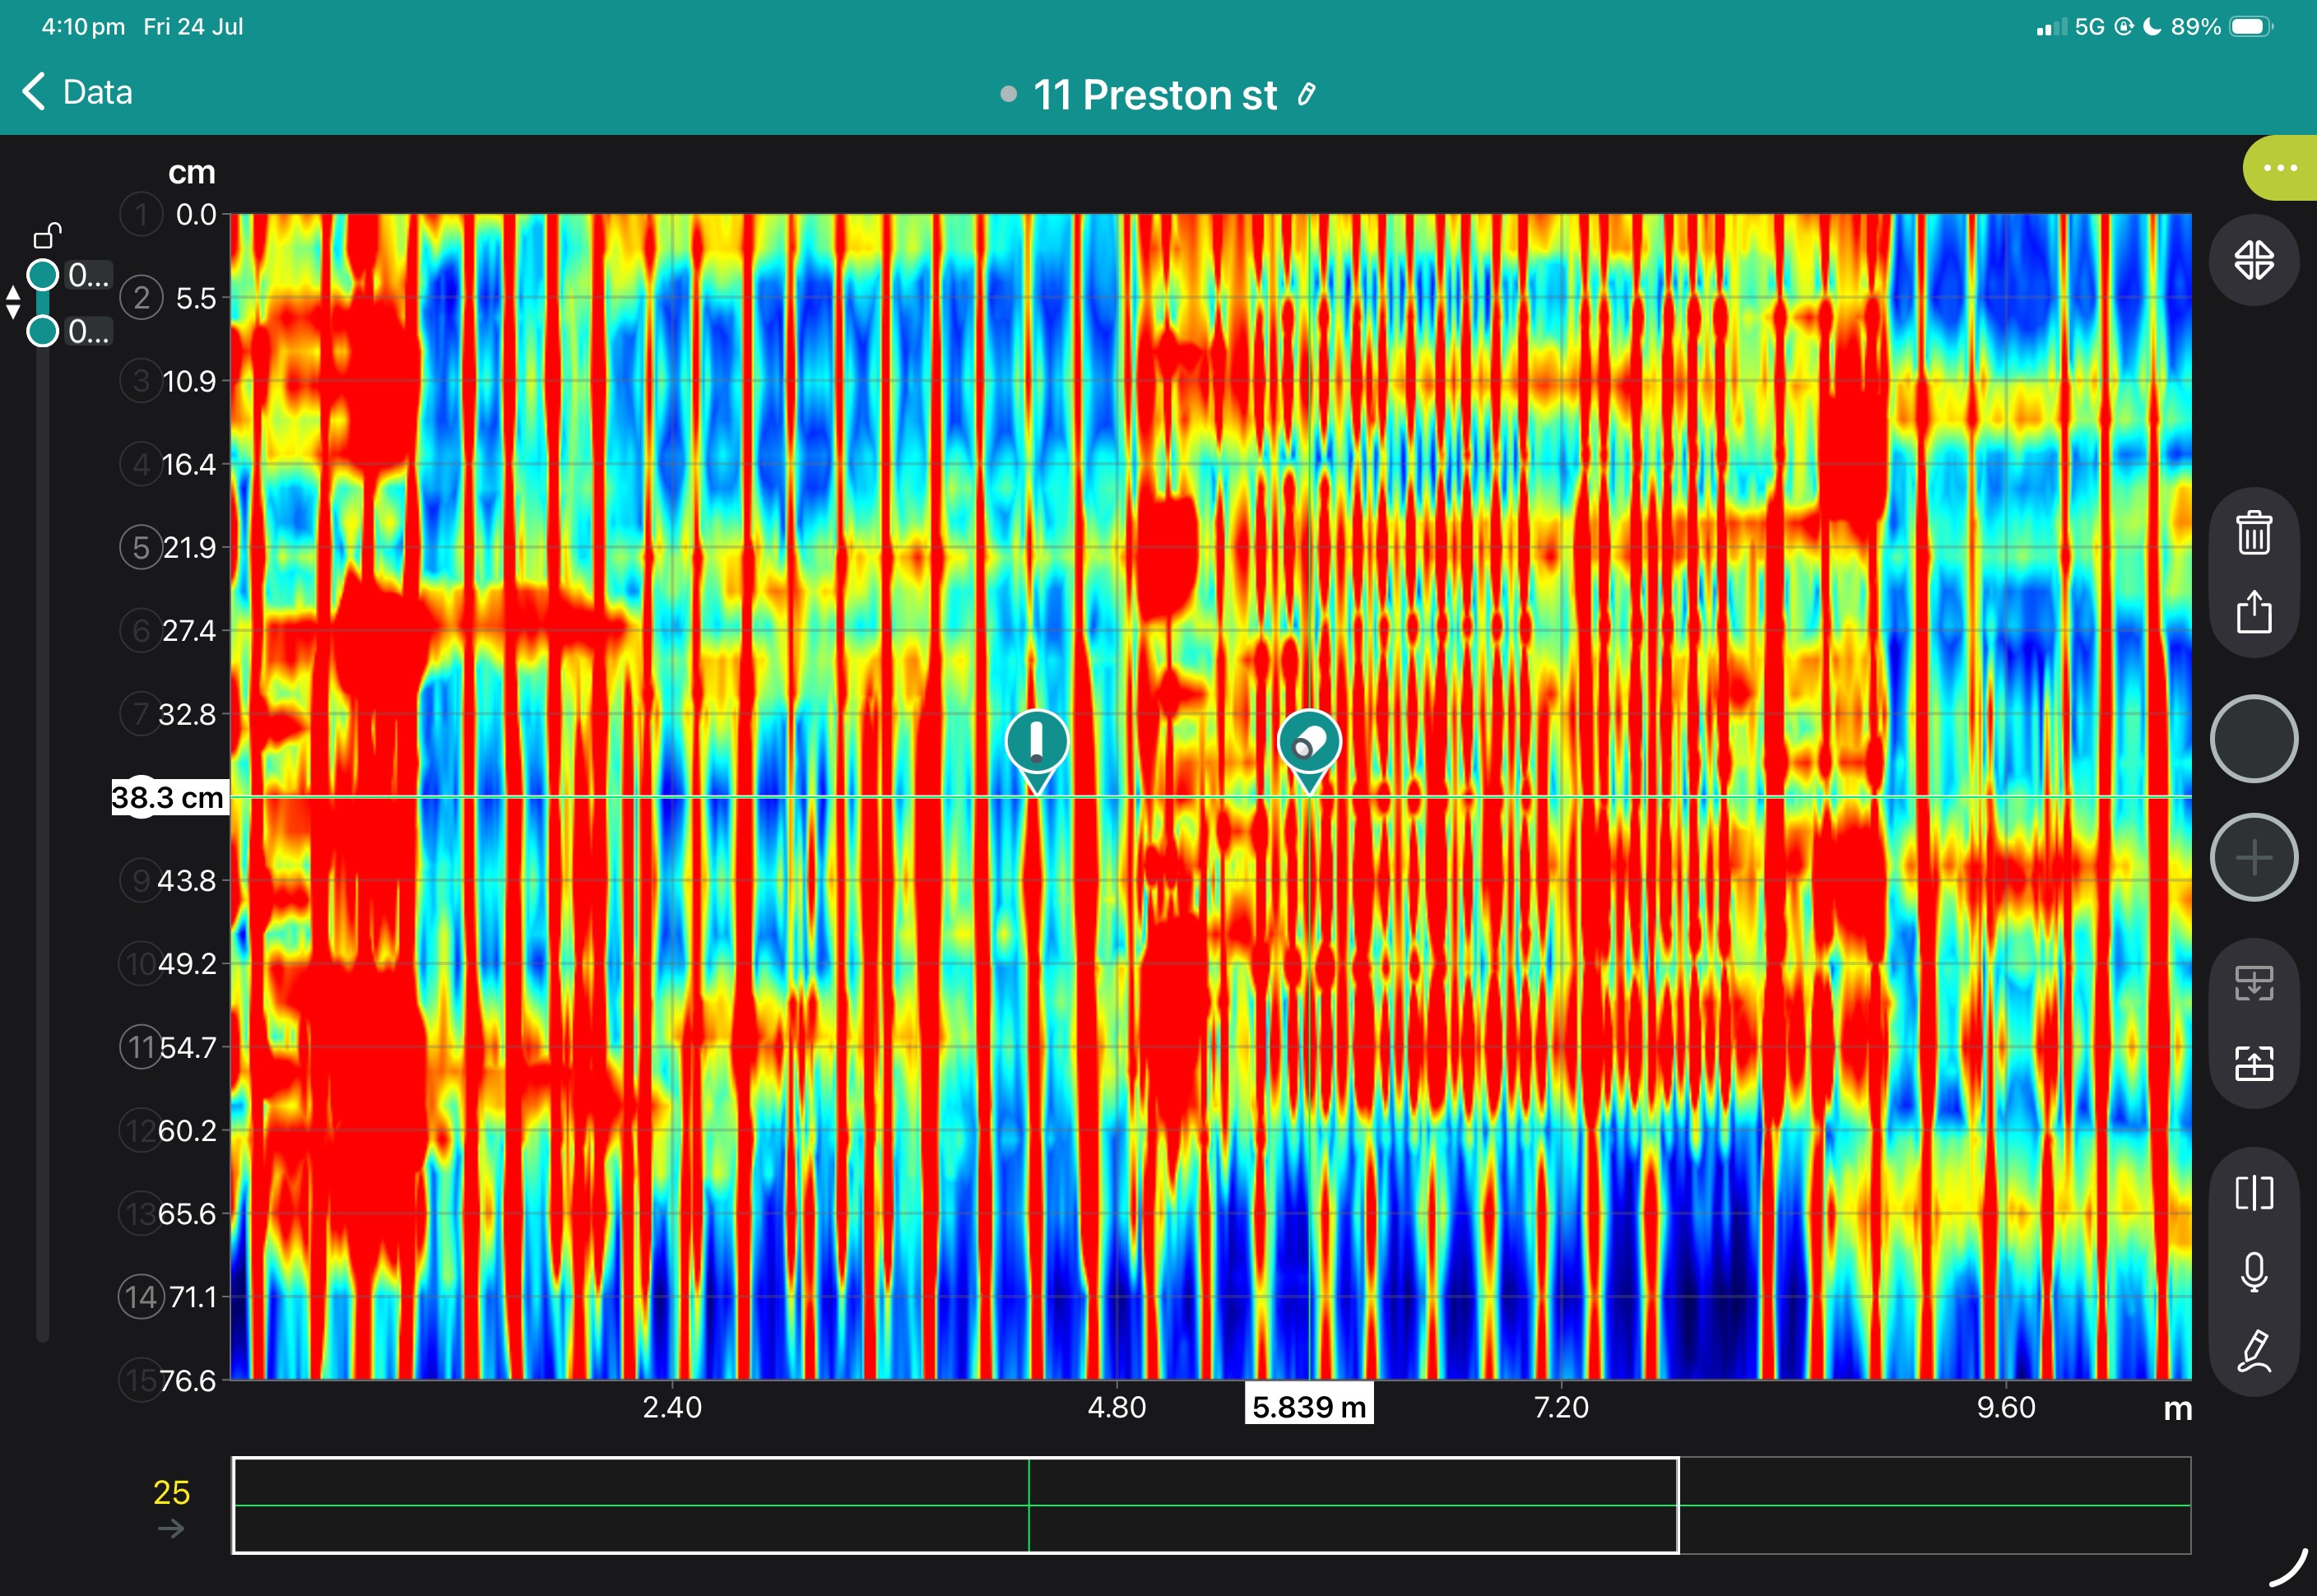
Freepath and b-scan from app
Geolocated tag on freepath in app
Freepath shown In GPR Insights without Hilbert Transformation
Geotagged linework added to a found sewer
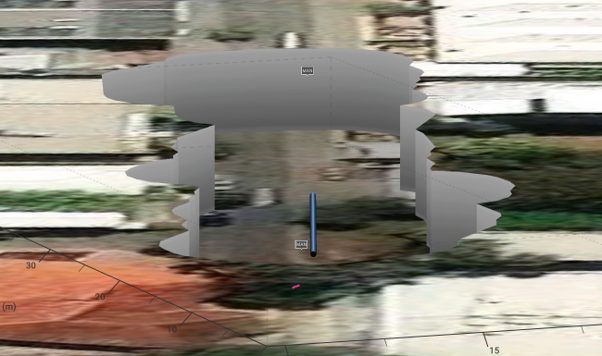
3D view with a cutout showing the sewer
3d Sewer line with GPR data removed

The pulse velocity in a material depends on its density and its elastic properties. These in turn are related to the quality and the strength of the material.

It is therefore possible to obtain information about the properties of components by sonic investigation. The Pundit offers users a reliable and accurate method for determining the sonic properties of materials.

Applications

Ultrasonic  testing can be used for:

  • The homogeneity of a material
  • The presence of voids, cracks or other internal imperfections or defects
  • Changes in the concrete which may occur with time (i.e. due to the cement hydration) or damage from fire, frost or chemical attack
  • The strength or modulus of a material
  • The quality of the concrete in relation to specified standard requirements

Materials

An essential tool for investigating a wide range of materials:

  • Concrete
  • Ceramics and Refractories
  • Timber
  • and many others

Test Method

Ultrasonic Pulse Velocity testing in its most basic mode is called time of flight. This refers to timing the arrival of an ultrasonic pulse from one transducer to another through a solid medium. The ultrasonic pulse in this instance is a p-wave (or compression wave).  The ultrasonic pulse velocity (UPV) is calculated by dividing the distance between the transducer by the time of arrival.

A image depicting UPV transducer orientation, Direct places a sending and receiving transducer on each side of a concrete block, Semi-Direct on a vertical and horizontal face near to a corner and Indirect on the same face of the concrete block.

Access for Testing

Pundit UPV Tester offers three methods of transmission. These can be seen in the image (right).  The method of transmission is determined by access to the concrete elements surfaces and the characteristic being tested. Pundit Lab has an automatic function for indirect (surface wave) measurements). Pundit Lab is calibrated in accordance with EN 12504-4.

Field Features for Pundit

Crack Depths

The Pundit has an automated feature which allows crack depths (BS method) to be determined perpendicular to the concrete surface.

Combination of Pundit-SCHMIDT for the Concrete Strength

This is a method (often referred to as the Rebultra method) by which the concrete strength can be calculated using a combination of the rebound value of the concrete and the UPV. Using these two independent factors will give greater accuracy, but must be calibrated using local materials.

Pundit Link Analysis Software

The Windows based software Pundit Link, developed by Proceq SA, unlocks the full capabilities of the Pundit Lab, providing the user with:

  • waveform visualisation and analysis
  • interactive adjustment of trigger point
  • on-line time data acquisition
  • full remote control of the instrument
  • export of data to third party applications

The figure above shows a screenshot from the software.

System requirements: Windows XP, Windows Vista, Windows 7, USB port. An Internet connection is necessary for future software and firmware updates.

Transducer Frequencies

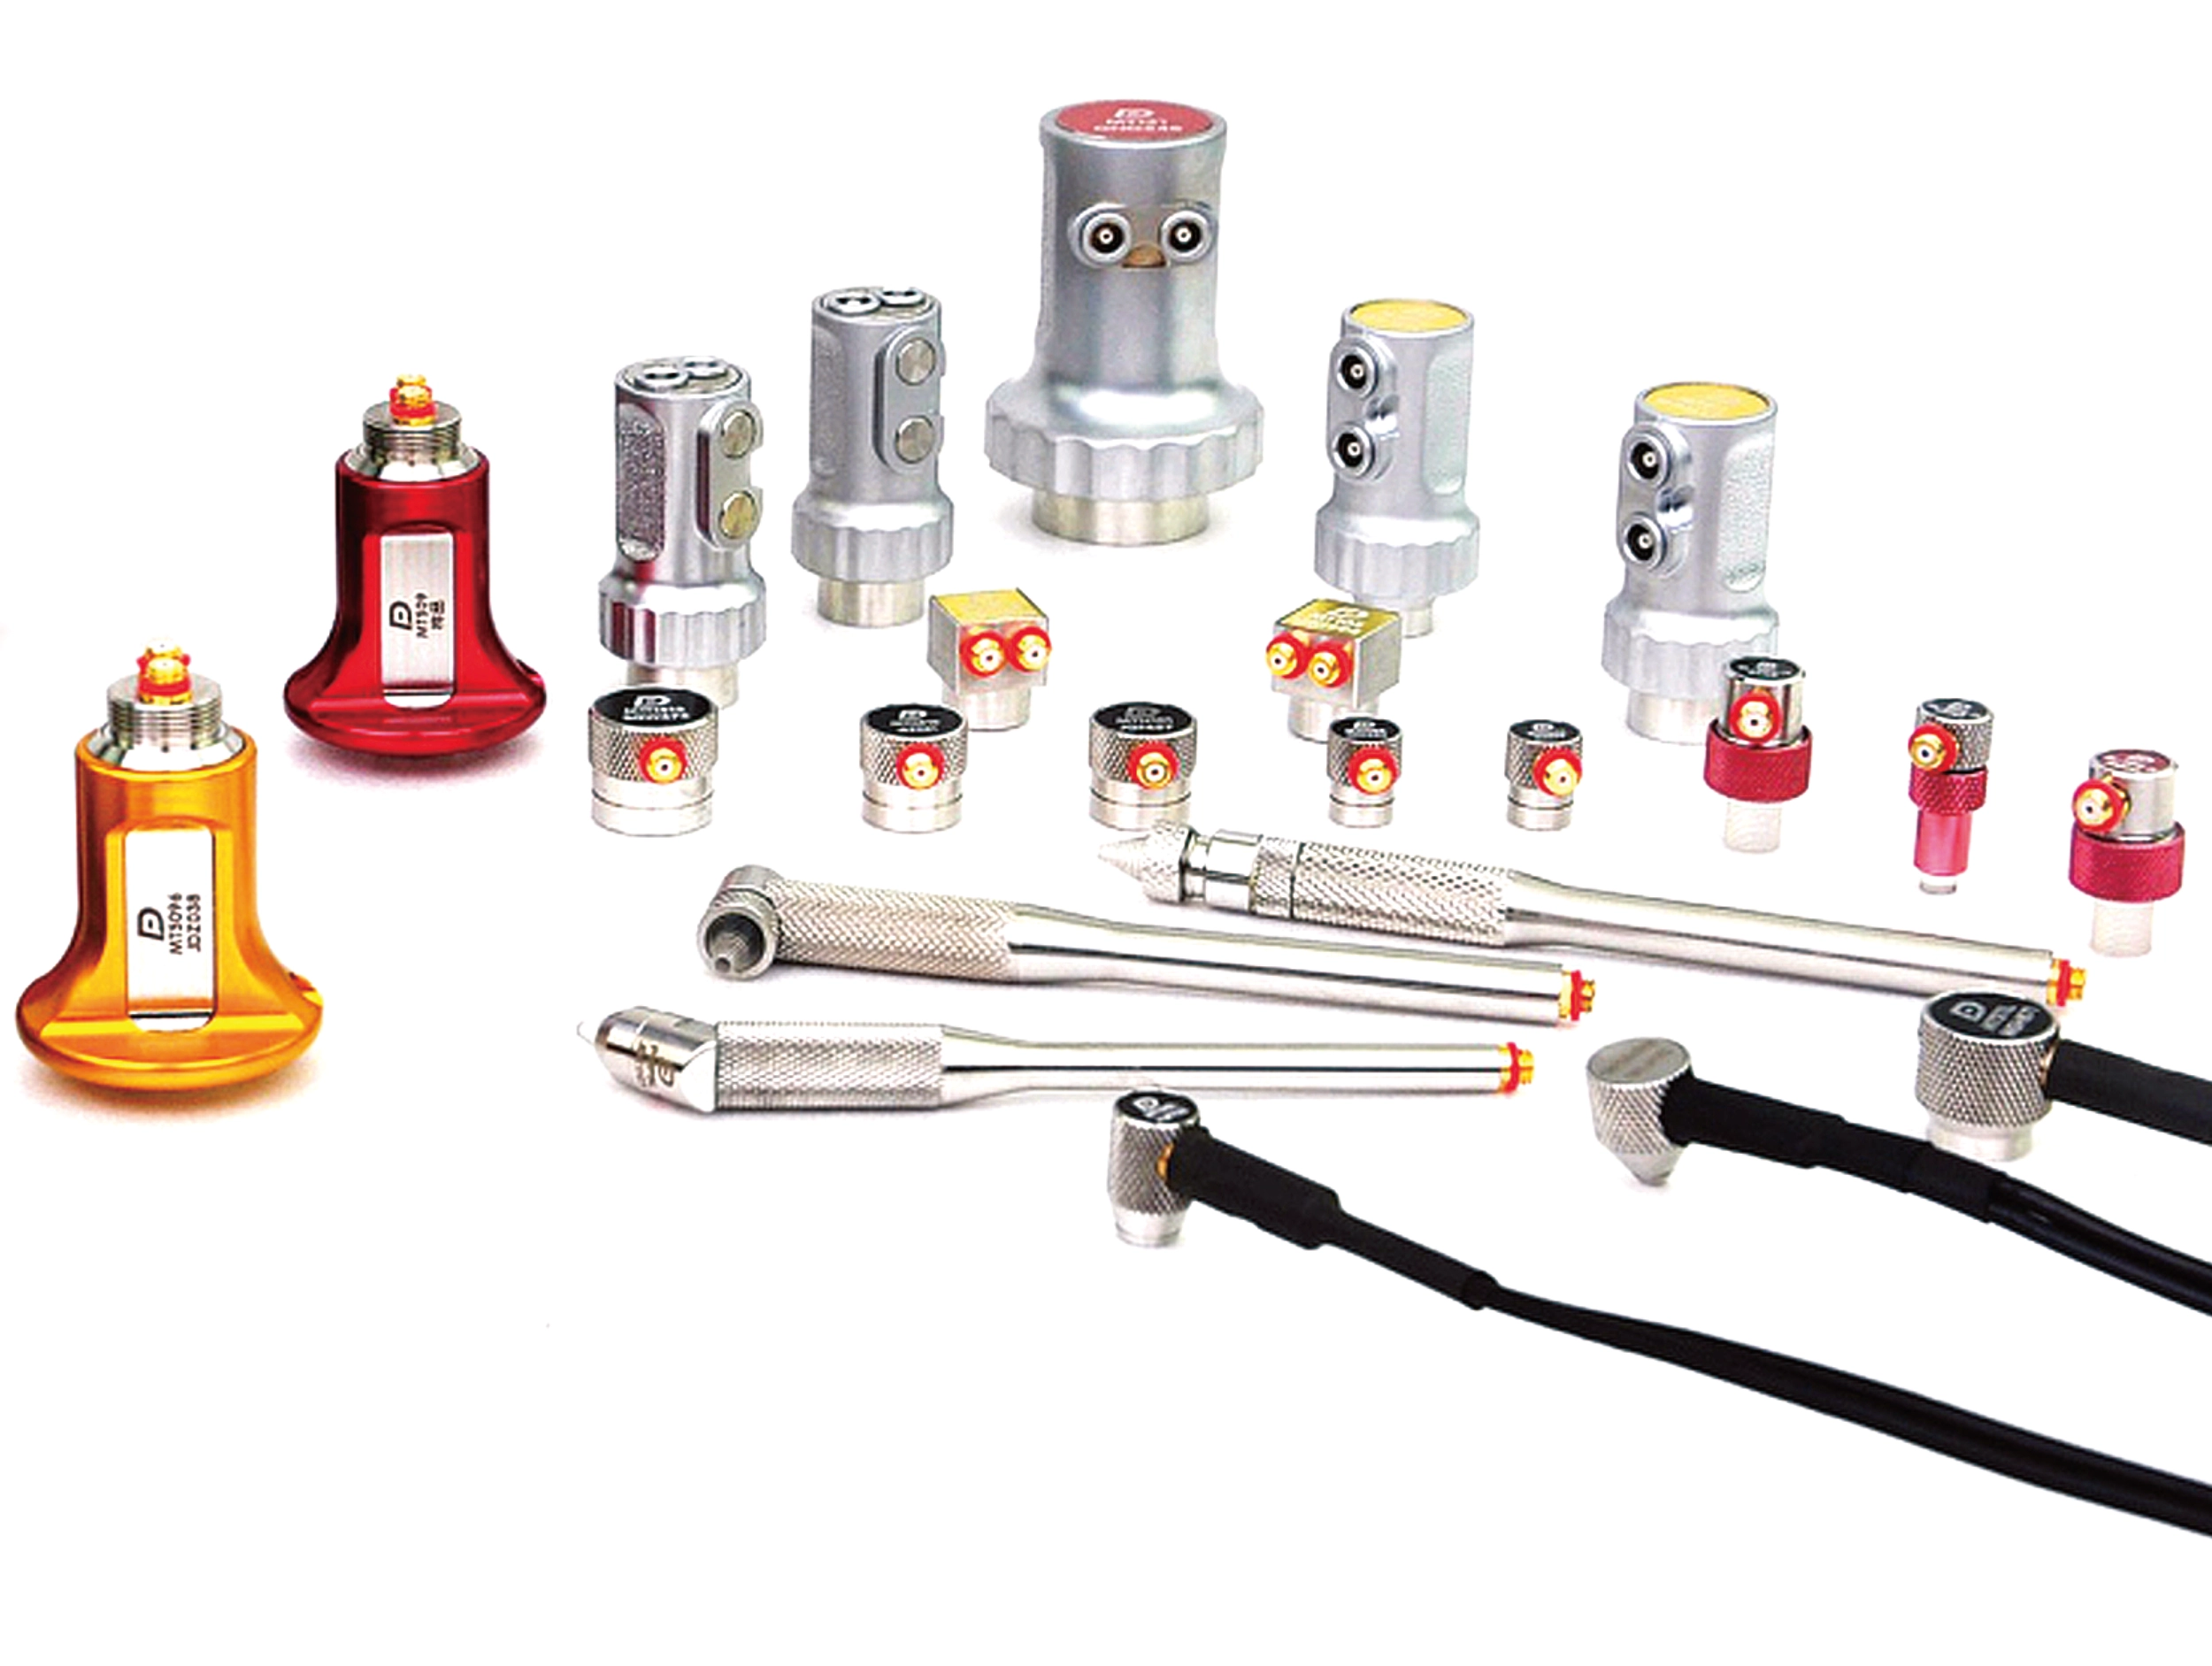
Comes standard with 54 kHz transducers, although a range of frequencies are available from 24 kHz to 250kHz. There are also exponential transducers available for dry coupling and wood applications. There is also new 40 kHz Dry Point Shear Wave transducers available for E-Modulus.

Form Supplied

The Pundit comes standard with:

  • Pundit Unit
  • Two 54 kHz transducers
  • Two 1.5m transducer cables
  • Ultrasound couplant
  • Calibration Bar
  • USB charger with USB-cable
  • Pundit link Software
  • Operating Manual

Why the GS9000 matters for SUE businesses

  • Increase area covered per field day
  • Reduce the number of manually positioned survey lines
  • Improve coverage in congested corridors
  • Review coverage before leaving site
  • Produce higher-value mapped deliverables
  • Combine GPR and GNSS in one workflow
  • Retain raw data for later reinterpretation
  • Expand from locating into mapping and subsurface modelling

Book a SUE Workflow Demonstration

High-resolution multichannel GPR for structures, bridges and pavements

The GX1 transforms the GS9000 into a high-resolution structural assessment system for concrete slabs, bridge decks and pavements. Its dense, dual-polarisation array captures detailed 3D data across wide areas, supporting reinforcement and cover mapping, moisture and deterioration assessment, and analysis of asphalt and pavement layers. Live visualisation helps confirm survey coverage on site, while post-processing tools produce clear, report-ready condition maps.

  • Bridge-deck reinforcement and condition mapping
  • Concrete-cover mapping
  • Reinforcement layout and spacing
  • Moisture-related and deterioration mapping
  • Asphalt and pavement-layer thickness
  • Road and runway investigations
  • Detection of embedded features
  • Large-area concrete-slab investigations
  • Comparative and repeat surveys

The structural assessment workflow

1. Define the inspection area

Import the structure, bridge, pavement or survey background.

2. Collect closely spaced profiles

Capture 35 longitudinal and 15 cross-polarised channels with dense spacing.

3. Review coverage in the field

Use live radargrams and time slices to confirm that the required area has been captured.

4. Process the dataset

Apply velocity, gain, background removal, migration, filtering and topographic correction as appropriate.

5. Generate diagnostic maps

Create depth slices, reinforcement maps, layer information or application-specific condition maps.

6. Integrate with the engineering assessment

Export figures, mapped anomalies and raw data for inclusion in the engineer’s final interpretation and report.

Structural outputs and engineering value

Field information

  • Live radargrams
  • Coverage map
  • Time-slice preview
  • Field annotations

Processed Diagnostic Information

  • 2D and 3D views
  • Depth slices
  • Reinforcement patterns
  • Cover trends
  • Layer-thickness information
  • Comparative amplitude or condition maps

Engineering deliverables

  • Georeferenced maps
  • Marked investigation areas
  • Selected radar profiles
  • Exported images and datasets
  • CAD/GIS overlays
  • Report-ready figures

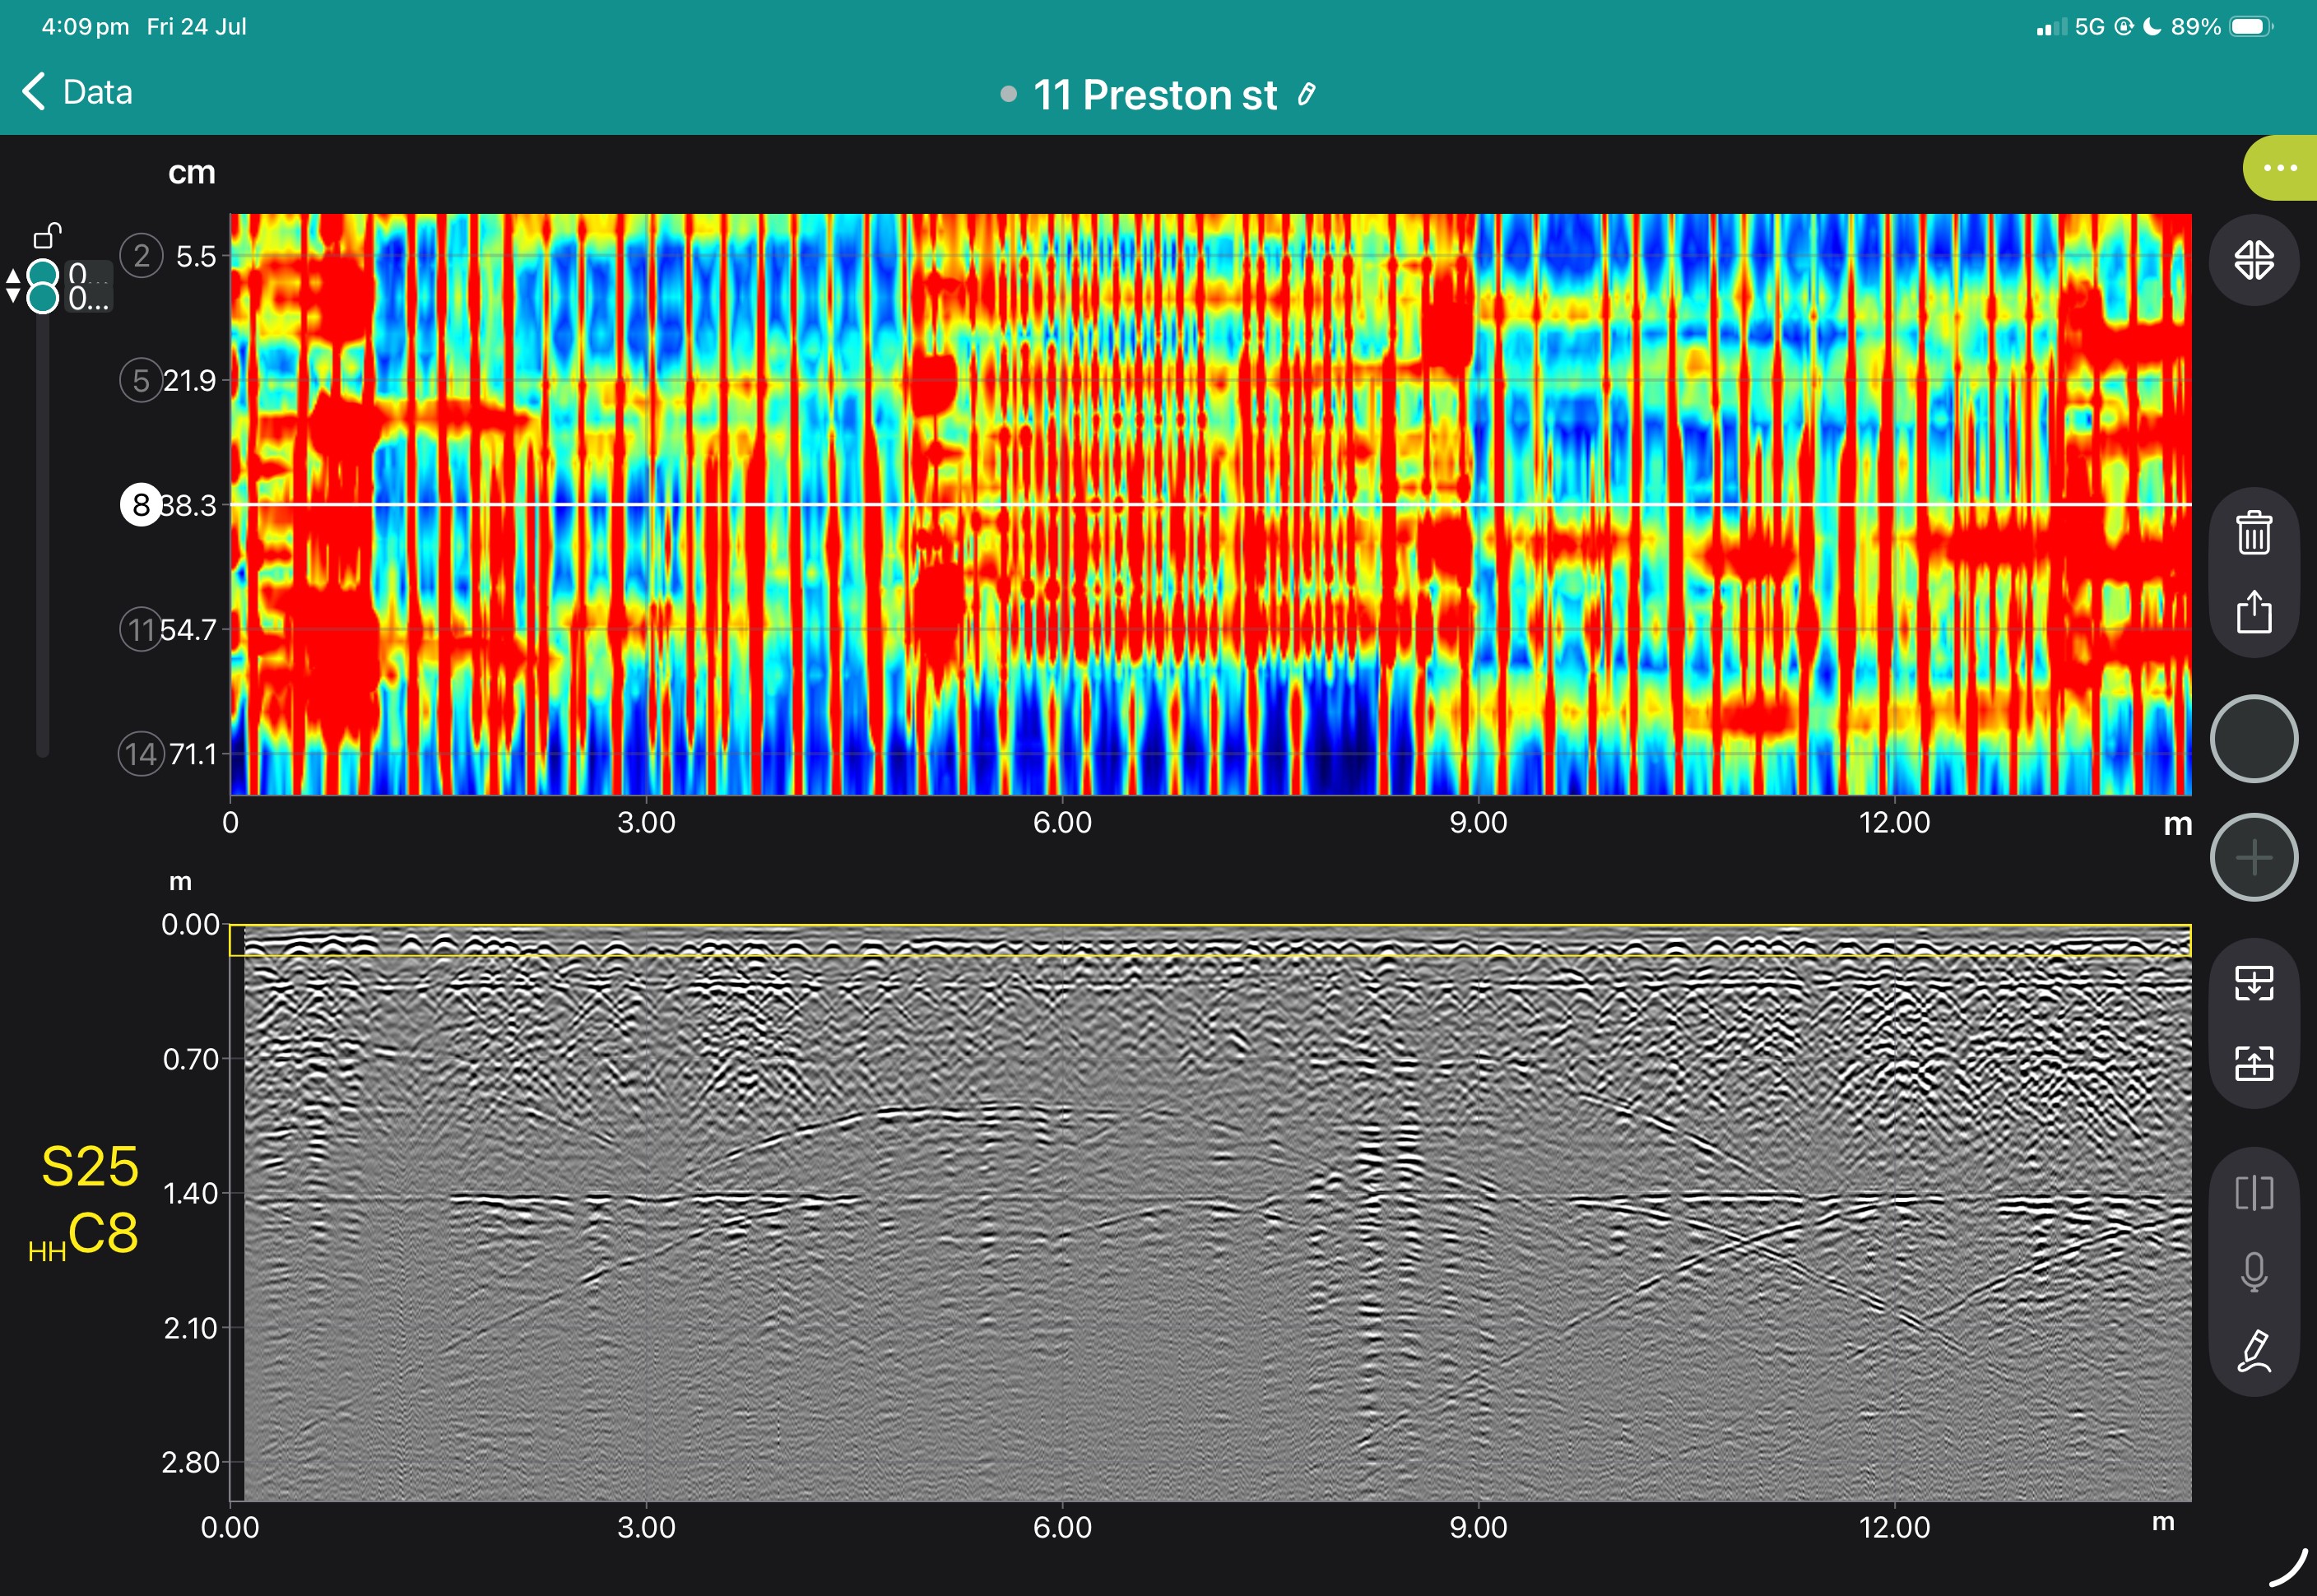
View some of these features at work below, and our case study if you'd like to see more of what the GS9000 can do.

When to use the GS9000 rather than a handheld GPR

Use a handheld or single-channel GPR when…

Use the GS9000 when…

  • The inspection area is small
  • You need local marking before drilling
  • Rapid spot checks are sufficient
  • Manoeuvrability is the main priority
  • The output is primarily site marking
  • Large areas must be covered
  • A completely mapped dataset is required
  • Large datasets are required
  • Productivity and spatial continuity are priorities
  • The output must support reporting or engineering interpretation

Book a Structural Assessment Demonstration

One GS9000 platform

  • Onboard instantaneously mapped results
  • Interchangeable array modules
  • Foldable carbon-fibre cart
  • Rear-wheel encoders
  • Hot-swappable power banks
  • Wireless iPad operation
  • IP65 protection
  • Integrated GNSS
  • Approximately 1–5 cm real-time GNSS accuracy where suitable corrections and conditions are available
  • Free-path and structured survey methodologies

Field software, post-processing and Workspace

Field App

Workspace

GPR Insights post-processing

  • Live radargrams and time slices
  • Satellite, GNSS and CAD overlays
  • Tags, photographs, voice markers and linework
  • Field calibration and processing
  • Immediate review of survey coverage
  • Synchronise projects
  • Store and share data
  • Collaborate remotely
  • Run connected GNSS and conversion services
  • Share projects through a URL
  • Merge multiple field projects
  • Advanced 2D and 3D visualisation
  • Filtering and migration
  • Topographic correction
  • Application-specific mapping tools

Configurations and what is included

GS9000 cart with:

  • GX1 and/or GX2 array option
  • MA8000 GNSS receiver and correction options
  • Latest version of GS App with live updates
  • Advanced GPR Insights processing software access
  • Cloud storage on Workspace
  • Batteries and chargers
  • Training
  • Commissioning
  • Kit with all required cables and tools

Why purchase from PCTE

  • Australian and New Zealand application advice
  • Local demonstrations
  • Configuration selection
  • On-site commissioning
  • Operator training
  • Data interpretation and workflow training
  • Local technical support
  • Service and repair coordination
  • Assistance with GNSS, coordinate systems and deliverables
  • Access to related GPR and structural NDT equipment

Bandwidth 20 to 500 kHz
Technology Ultrasonic Pulse Velocity
Measuring Resolution 0.1 us
Pulse Voltage ±125 to ±500 V (UPV)
Receiver Gain 1x, 10x, 100x, AUTO, Pundit Lab+ up to 1000x
Nominal Transducer Frequency 24 – 500 kHz
Pulse Shape Square Wave
Pulse Delay -
Number of Channels 1
Display 79 x 21 mm passive matrix OLED
Memory >500 measured values
Measurement Modes Pulse velocity
Surface velocity
Data logging
E-modulus
Compressive strength correlation
Crack depth
Measuring Range 15 m depending on concrete
Special Features Open interface
Integrated amplifier gain stage
Real time stamp
No Items Found
No items found.
EN12504-4
Testing concrete - Determination of ultrasonic pulse velocity
Other Products...
ASTM C597
Standard Test Method for Pulse Velocity Through Concrete
Other Products...
BS 1881, Part 203
Testing concrete - Recommendations for measurement of velocity of ultrasonic pulses in concrete
Other Products...
CIA Z11
CIA Recommended Practice - Z11 In-situ Strength Assessment of Concrete Structures and Components (2021)
Other Products...
Pundit Lab Manual

Manual for the Pundit Lab UPV tester range.
No items found.