%20vector%20logo.svg)

How to Configure RTK on the Proceq GS8000 for High-Accuracy Data Collection
September 3, 2024
July 29, 2026

OUTCOME: A single 351.14 m² dataset captured the slab, the occupied space below and the lower deck - then carried the interpretation through to 3D and CAD-ready outputs.

The subject was a suspended slab forming the upper level of a two-storey car park. The investigation needed to do more than locate reinforcement. It had to connect plan-view patterns with cross-sectional depth, distinguish responses inside the concrete from objects in the air space below, and package the results for engineering and CAD workflows.

The required outputs were deliberately varied:
WHY THE FULL DATASET MATTERED: The same georeferenced acquisition could be revisited at different depths and in different views, rather than treating each deliverable as a separate survey.
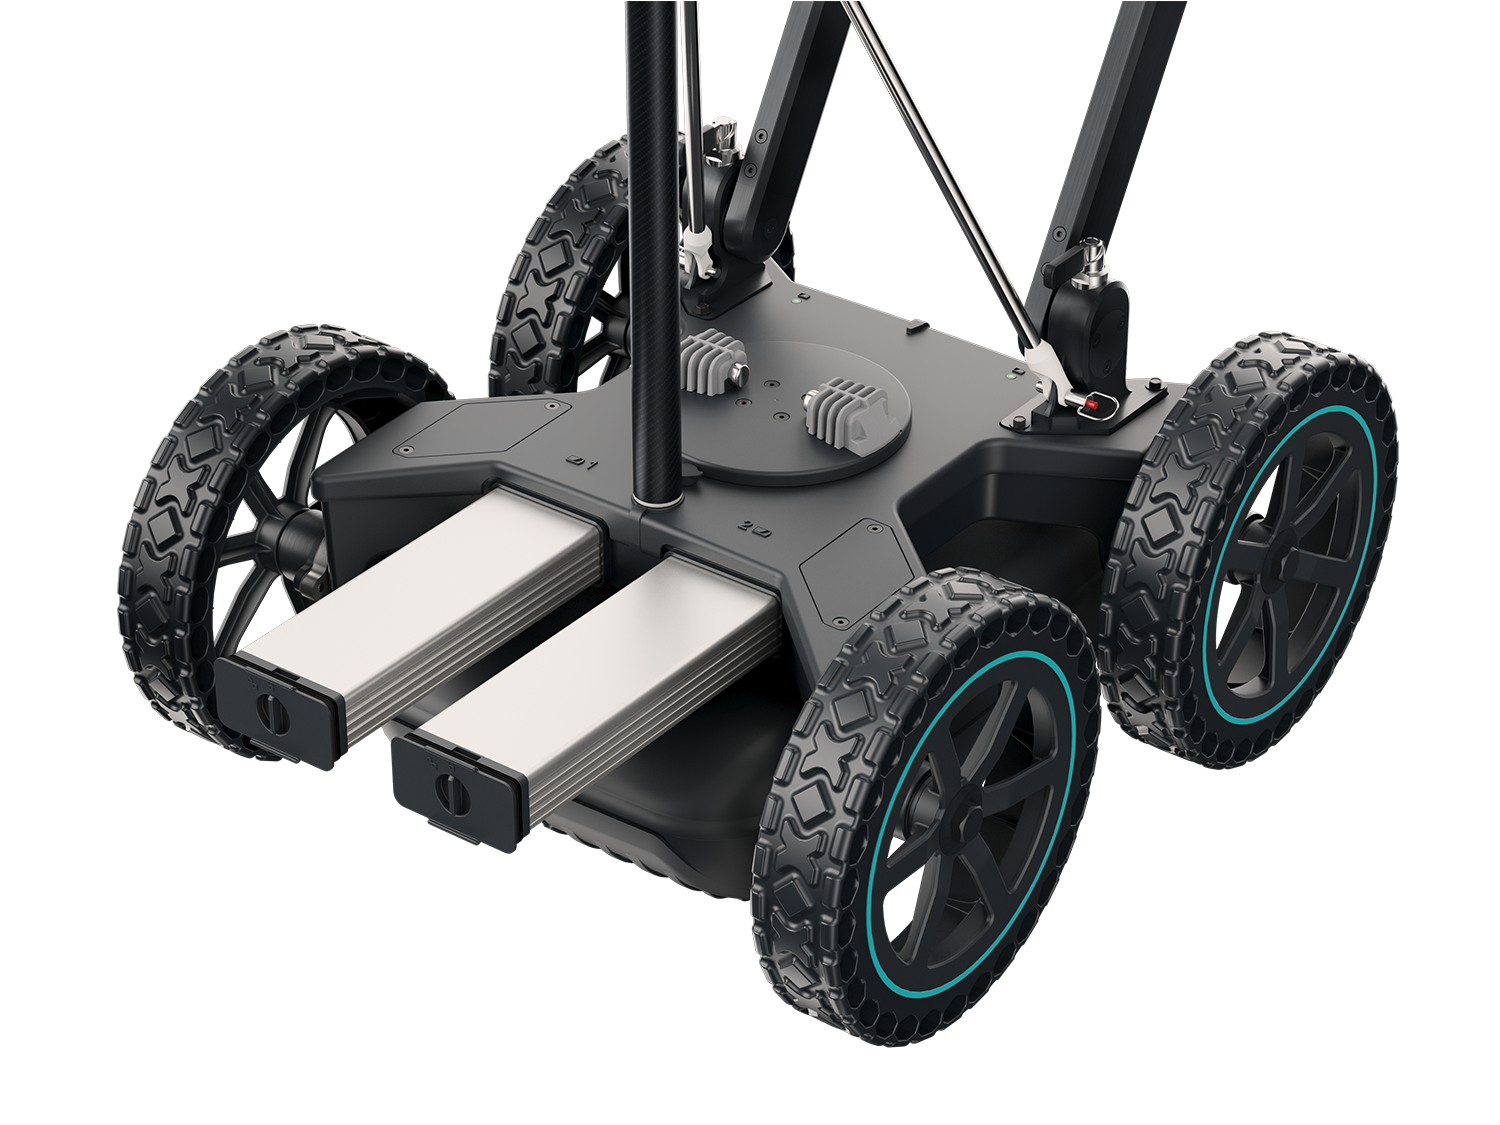
The dataset was collected with the GS9000 pushcart fitted with the GX1 array, paired with an MA8000 receiver using RTK corrections. The project draft records a 1 cm spatial interval, equal to the system's maximum specification of up to 100 scans per metre.
The GS9000 and GX1 combination provided the technical basis for the survey:
Technical basis: GS9000 User Manual v1.0, pp. 7-9, 31-34, 40-44, 51 and 70. The 1 cm interval and project configuration are taken from the source case-study draft
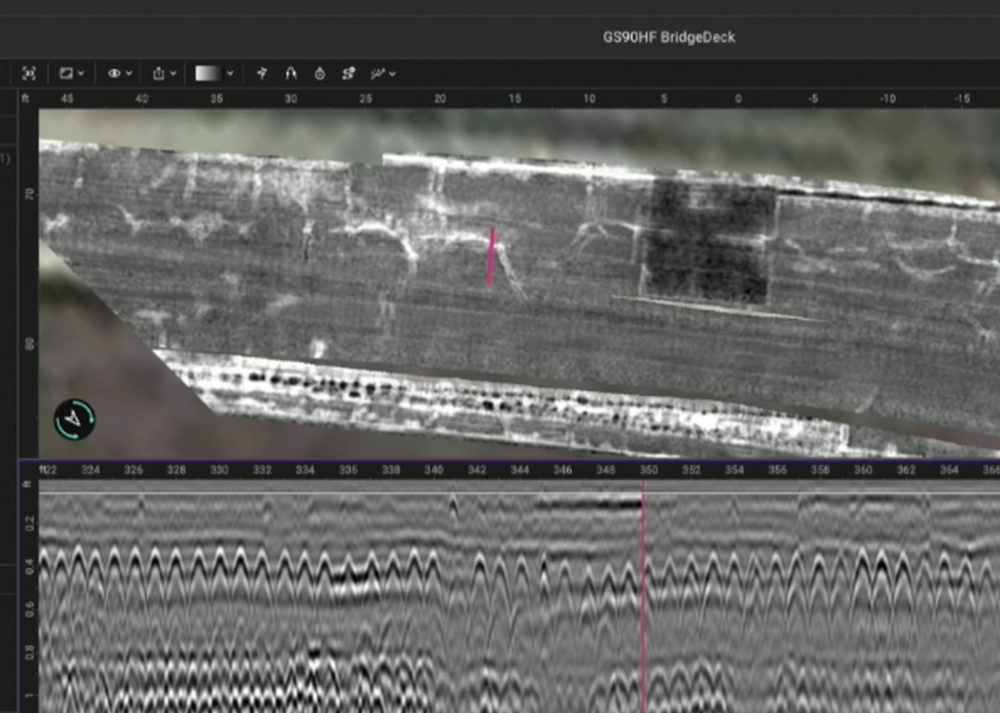
A representative HH-polarised radargram showed far more than the first layer of reinforcement. It resolved the concrete section, a second reinforcement layer, the slab underside, large targets within the air space and a deeper interface consistent with the lower deck.

The interpreted vertical sequence was:
INTERPRETATION PRINCIPLE: Travel time becomes depth only after an appropriate velocity or dielectric calibration. The dimensions reported here are project-specific interpreted values, not generic system limits.
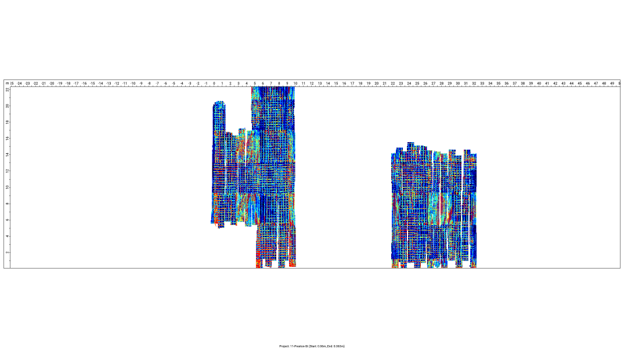
Plan-view slicing combined the multi-channel information into a readable reinforcement image. The top grid is visible across the survey, while local square patterns and denser responses align with additional negative reinforcement around column locations.

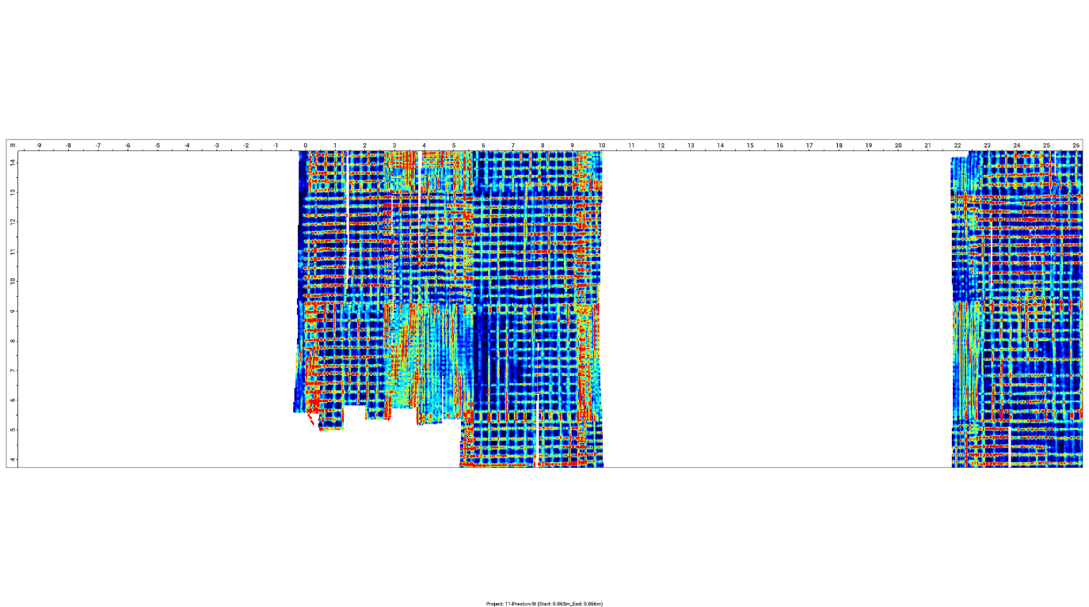
GPR Insights defines a slice as a horizontal plan view extracted from a 3D representation of the survey data; linked B-scan and slice views allow locations to be checked in both plan and section.
GPR Insights' Analytics workflow uses AI-assisted hyperbola detection to identify the first rebar layer. For GX1 data, the software uses the HH input for these detections. The points can then be reviewed, edited and filtered by confidence before the map is accepted.


IMPORTANT LIMITATION: The manual describes the cover map as an approximation based on a constant velocity or dielectric. It is best used to compare relative cover across the deck and calibrated against another cover method where required.
The same AI-detected first-rebar layer was used to generate a qualitative deterioration map. In the ASTM D6087 workflow for asphalt-covered concrete decks, lower reflection amplitudes indicate a higher likelihood of deterioration at or above the first reinforcement layer.

Approximately 5.75 m², or 1.6% of the scanned area, fell within the red category. The pattern did not show a strong spatial correlation with the lowest-cover areas. That is an important practical result: reduced cover and lower reflection amplitude are different indicators and should not be treated as interchangeable.
USE WITH ENGINEERING JUDGEMENT: This is a qualitative screening output. The D6087 approach is intended for asphalt-covered bridge decks, requires suitable scan orientation relative to the top reinforcement, and may be affected by deck construction and material conditions. Targeted verification should follow where decisions depend on the result.
Technical basis: GPR Insights User Manual v3.6, pp. 57-61.
For a representative area, the reinforcement was interpreted manually and a separate object was created for the dense negative reinforcement around a support. GPR Insights objects carry x, y and z positions and can be assigned cross-sections, dimensions, comments and visual textures.

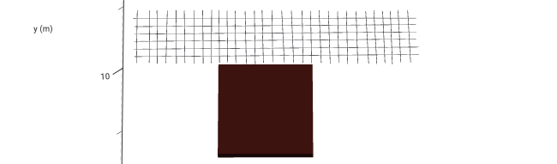
Technical basis: GPR Insights User Manual v3.6, pp. 55-57.
The interpreted geometry was then opened in CAD. This step matters because the value of the survey is not limited to a software screenshot: interpretation items can be exported from GPR Insights as DXF, SHP, KML, CSV or XYZ depending on the active view and object type.

That export pathway supports a practical chain of custody for the interpretation:
COLLABORATION BENEFIT: The exported interpretation can be combined with drawings and other survey information without forcing every stakeholder to work inside the GPR analysis environment.
Technical basis: GPR Insights User Manual v3.6, pp. 64-66.
The slab underside was followed with the horizon-mapping workflow. The algorithm traces a selected positive or negative amplitude peak through a depth window in each B-scan, after which the analyst can adjust the line and generate depth, thickness or amplitude maps.
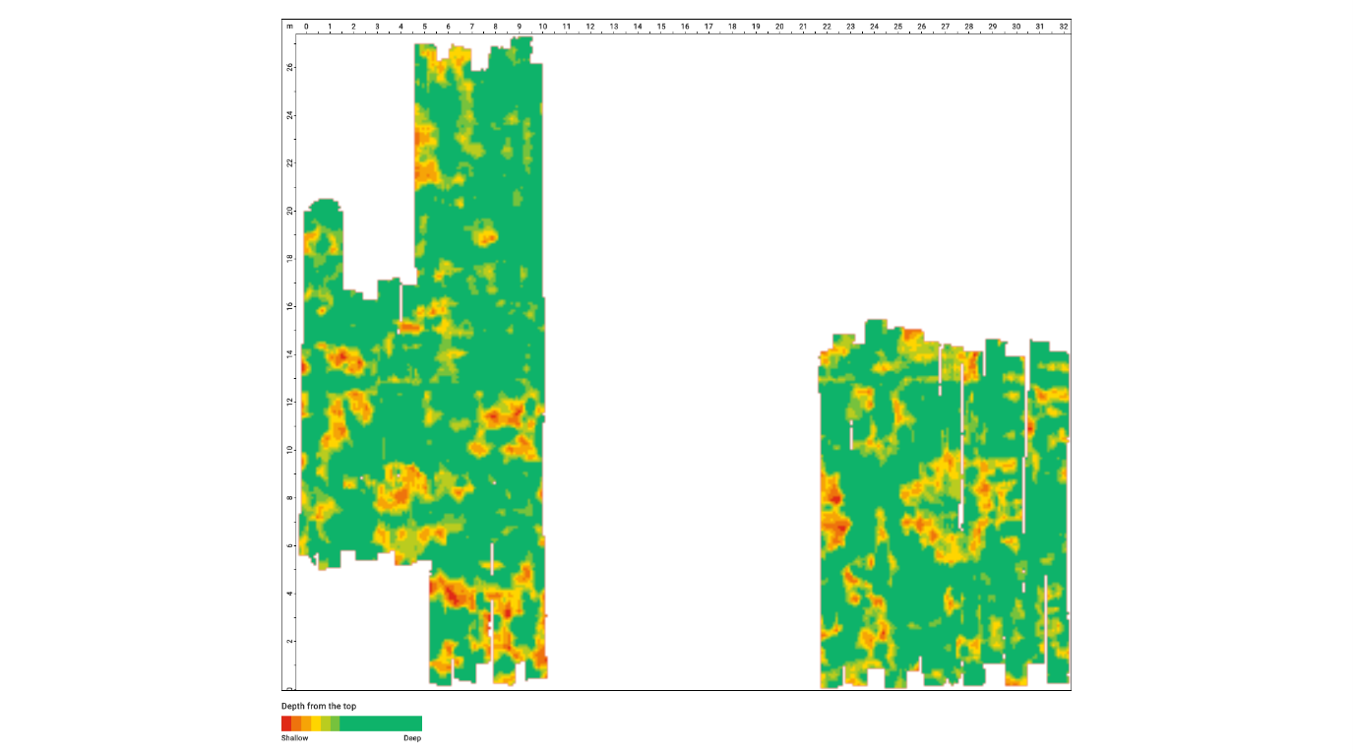
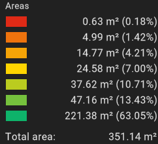
The interpreted range was approximately 245-285 mm. Only 0.18% of the scanned area fell in the red class, while the majority of the area was in the green class. The map therefore highlighted localised thin zones without losing the broader context of the deck.
A mapped result is more useful when the reader can trace it back to the underlying signal. Here, the horizon line is visible directly on the B-scan, allowing the analyst to check whether the automated trace follows the intended slab interface and to edit it where required.
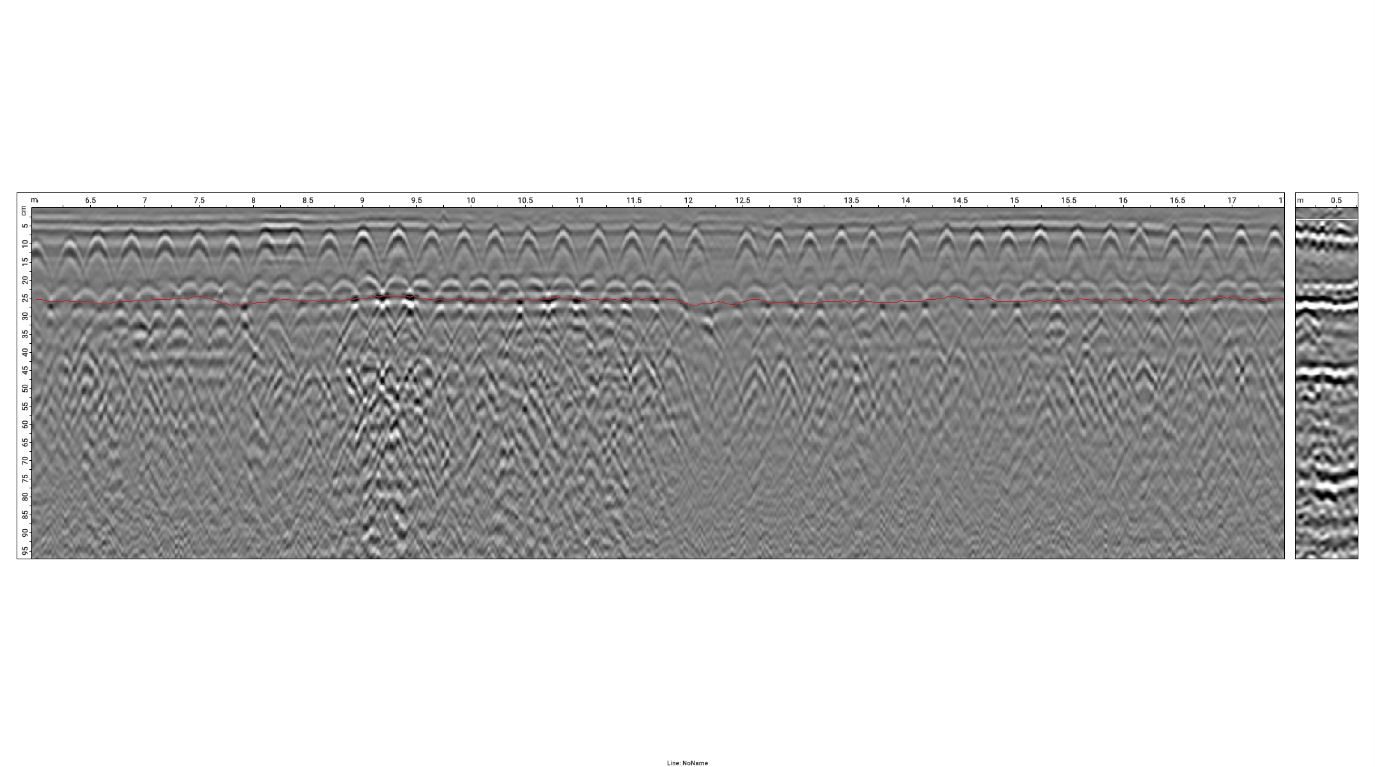
MARKETING VALUE WITHOUT LOSING TECHNICAL TRUST: The colour map communicates the result quickly; the retained B-scan horizon shows how that result was derived.
Technical basis: GPR Insights User Manual v3.6, pp. 62-64.
A deeper slice showed large targets beneath the upper slab. Their position within the interpreted air-filled zone, where relative permittivity approaches 1, separated them from responses inside the concrete. Site observation confirmed the targets as vehicles on the lower level.

THE RESULT: One survey produced a coherent structural narrative: reinforcement layout, relative cover, qualitative condition, slab-thickness variation, support-zone interpretation, deep-object context and CAD-ready geometry.
For asset owners and engineers, the practical advantage is continuity. The interpretation can move from a georeferenced plan, to the exact B-scan behind it, to a 3D object and finally into a wider CAD workflow. That makes the dataset useful both for immediate review and for future project coordination.

Reuben is PCTE's Managing Director and has been using and training users of GPR for more than 20 years.