
Construction NDT News April - June 2019
Choosing a Profometer Over a Profoscope
For cover meter users who need to record or present their measurements the Profometer is an excellent choice. Excellent for diagrams of rebar layout, analysis of cover distributions or investigation before remediation or cathodic protection work. Visualisation modes can show diagrams of rebar position and depth, surface maps of cover depth or bar size and the statistical view can how detail on average cover depth and distribution of results.
The Profometer platform also support Half Cell Potential Mapping for use during corrosion investigation of concrete structures. The combination of cover depth & potential mapping area scans are perfect to highlight regions with active corrosion and areas under imminent risk of corrosion with low cover.
Grouting for Precast
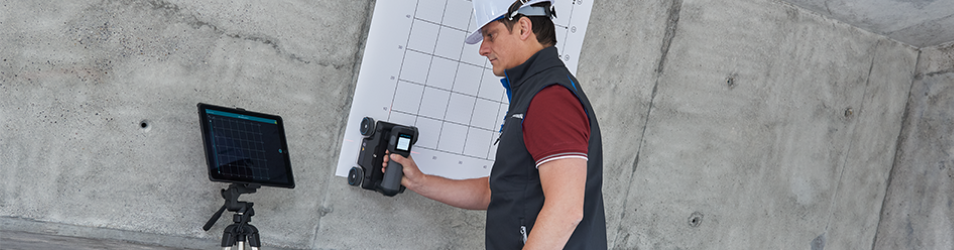
This article visually presents the most commonly used sonic/seismic test equipment for concrete inspection, and how it may be used to confirm the correct in-situ grouting of precast wall elements. In general, sonic tests are the most appropriate tool to locate regions of voiding, cold joins and delamination between layers in concrete structures.
Ultrasonic Pulse Velocity, Impact Echo, Ultrasonic Pulse Echo and SASW [Spectral Analysis of Surface Waves] testing equipment is discussed, either to evaluate the grouting of the base of the element, or within dowel pockets.
Precast Wall Elements
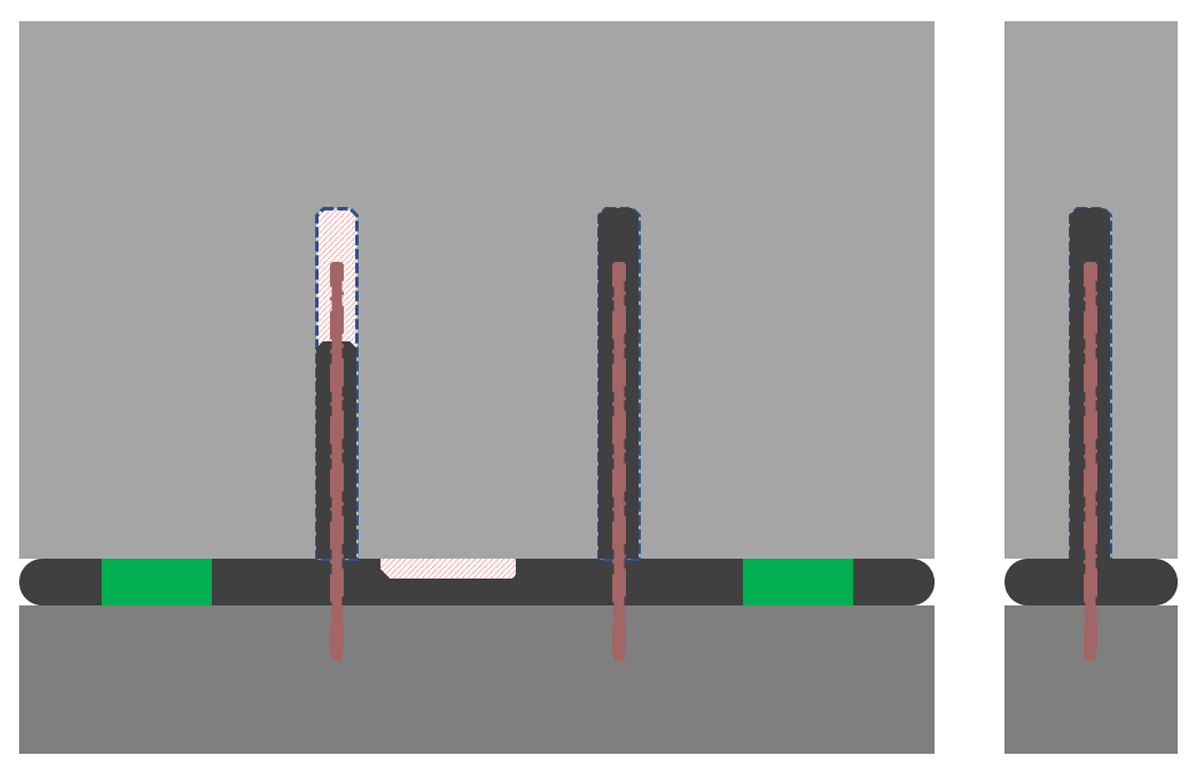
For those unfamiliar with precast construction the precast wall segments are defined in "AS 3850.2:2015 Prefabricated Concrete Elements, Part 2: Building Construction" and the simplified image below shows an example, resting on two contact shims with rebar in pockets. Potential grouting defects are highlighted in red.
Inspection of Base Grouting
Base grouting voids can exist in the gap between the footing and the precast element. If it is possible to access both sides of the precast element Ultrasonic Pulse Velocity may be apropriate to locate voids within the grout. If access is only from one side SASW testing is suitable.
Ultrasonic Pulse Velocity
Ultrasonic Pulse Velocity [UPV] is the oldest and best understood sonic test method for concrete structures. It is a transmission technique where a sonic pulse is sent from one point on a structure to a receiving sensor distant from that point. To test a region with UPV the operator needs to be able to place the sending and receiving transducer on the surface, in a direct line between the region being inspected, and calculate the distance between them.
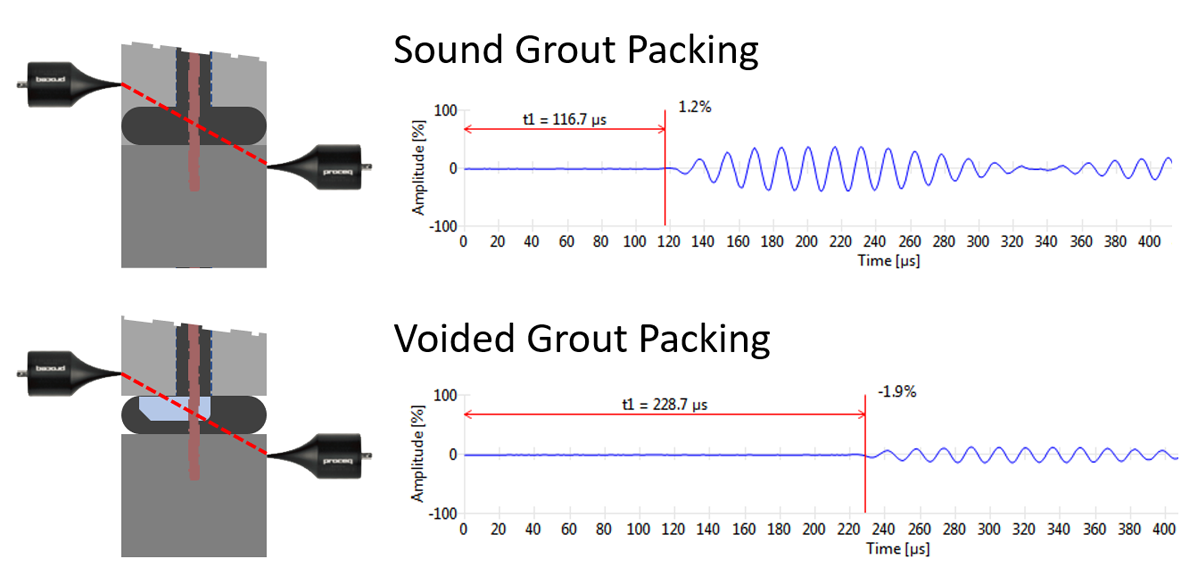
UPV testing results are presented as a transmission time or velocity measurement. In the example below two possible UPV measurements are shown, one representative of transmission through unvoided grout packing, and another with a void in the direct path between sensors. Where there is a void the transmission time is longer, and the velocity slower for that region.
 Spectral Analysis of Surface Waves
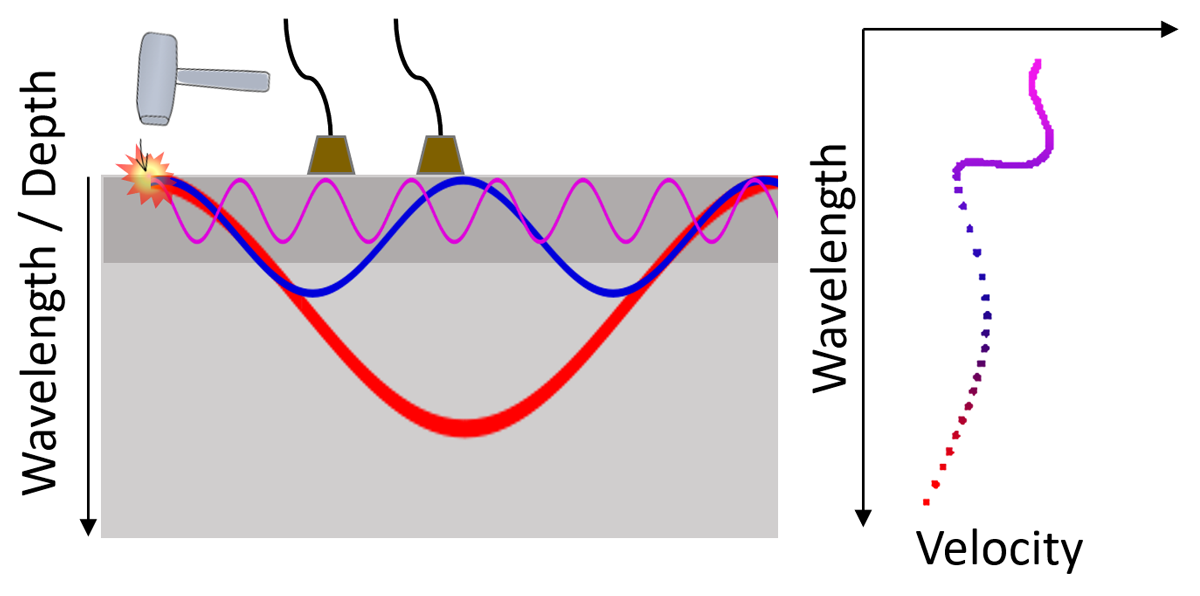
SASW testing is a technique used to evaluate concrete structures, pavement systems, roadbase and more. It is most commonly used to evaluate the depths and physical properties of layered systems, such as an asphalt roadsurface over concrete and subbase.
The illustration below shows three Rayleigh wavelengths, the energy measured in SASW, as coloured "waves" and one output of a test, a "Dispersion Curve" chart of Wavelength Vs Velocity.
It can be seen that the pink region is flat indicating a consistent velocity in the shallow material, then a disturbance in data between layers of material and a decrease in velocity in the wavelengths that encompass the second material, indicating the waves move more slowly through it.
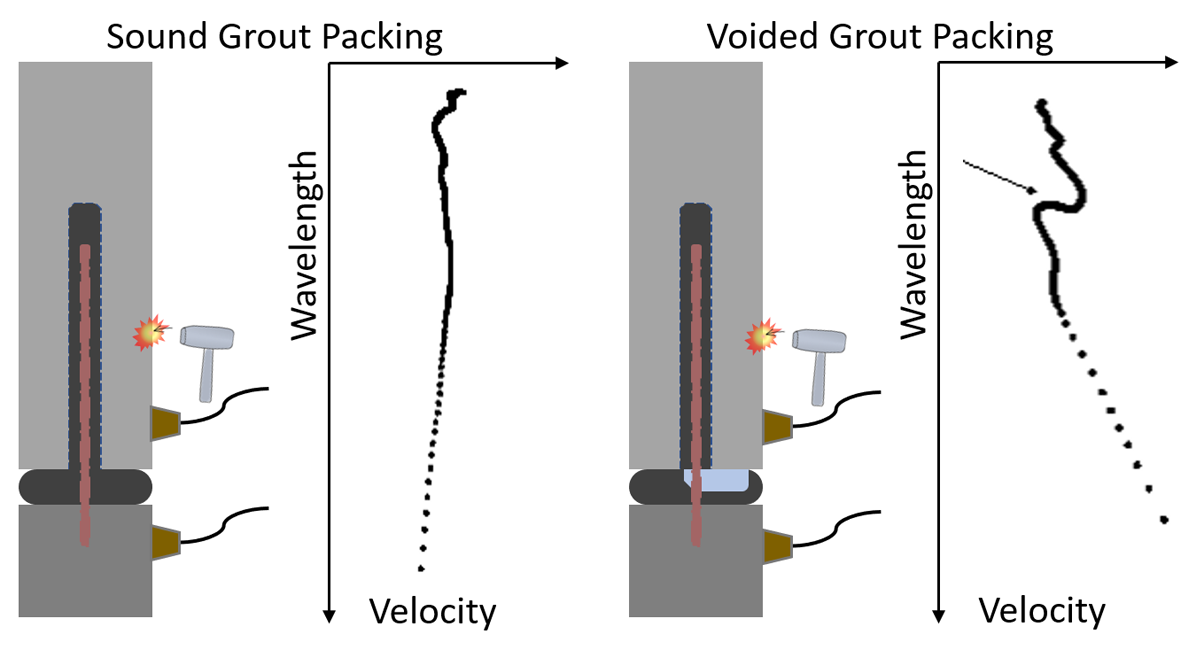
To test the base grouting on a precast structure it must be possible to place the SASW sensor on either side of the join to be tested, and to compare dispersion graphs between grouted and ungrouted regions. In the example below the dispersion curve of a grouted region is flat, indicating the velocity remains constant through the whole distance of the join.
In an ungrouted example the dispersion curve velocity is flat for wavelengths corresponding to the shallow ungrouted region before the arrow, if numbers were presented it would also be somewhat lower/slower than the grouted test.
There is disturbance in the dispersion curve in the region bordering the void [Arrow mark] and the velocity begins to increase with depth, a typical response of a faster region [Grouted area allowing faster wave transmission] beneath a slower region [The voided area].
Inspection of Rebar Pocket Grouting
Rebar pockets may be unlined or may have a metal or plastic conduit forming them. Ultrasonic Pulse Echo and Impact Echo tests may be completed from one side of the precast element to locate voids within the pocket.
Ultrasonic Pulse Echo
Ultrasonic Pulse Echo instruments send a shear wave pulse into an element, recording the arrival time of echoes from within the material at receiving sensors. Energy is best reflected by air such as voids, delaminations or the far side of concrete.
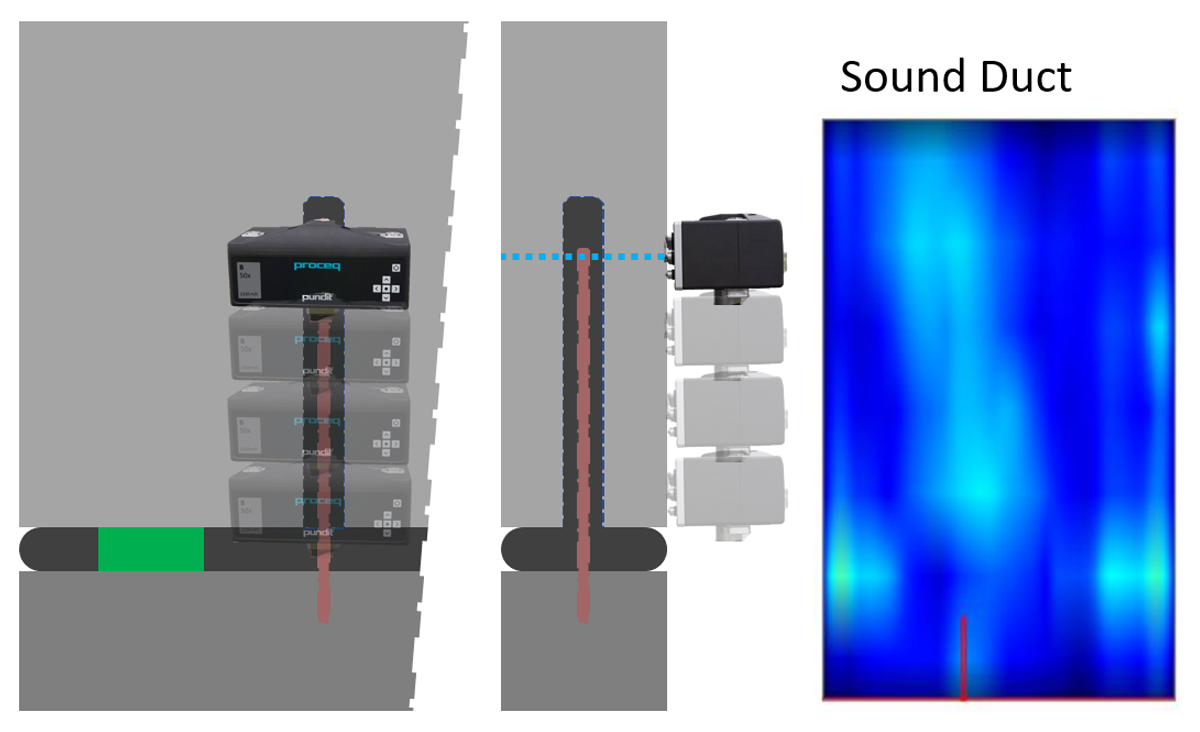
Practical scanners like the Pundit Live Array record many measurements using lots of sensor pressed to the concrete surface and produce an image that represents the internal structure of the concrete.
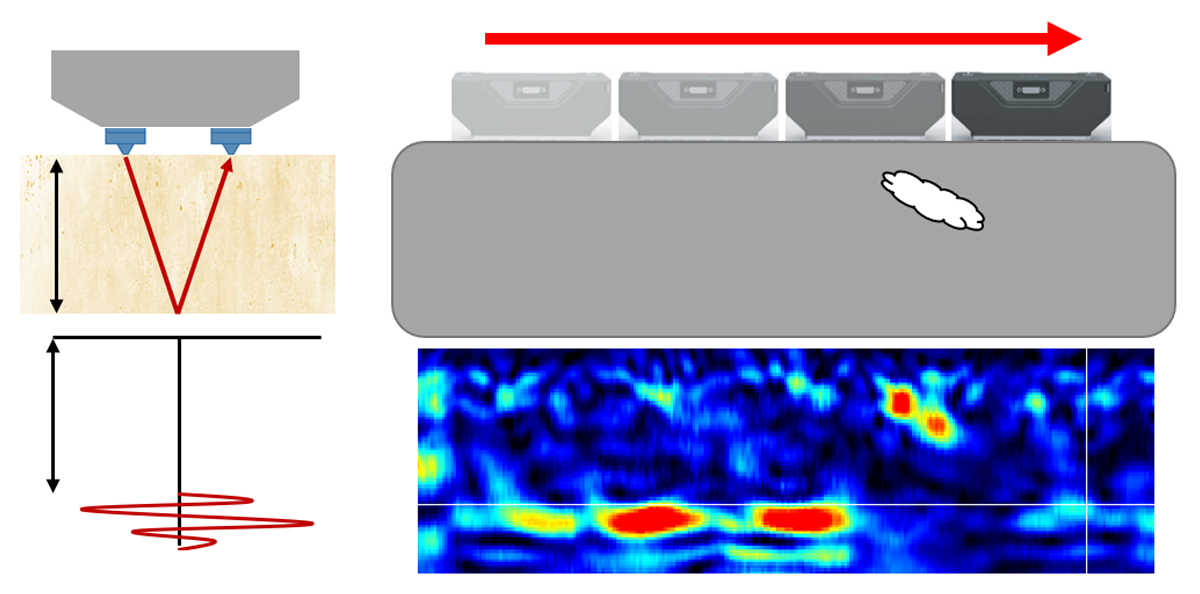
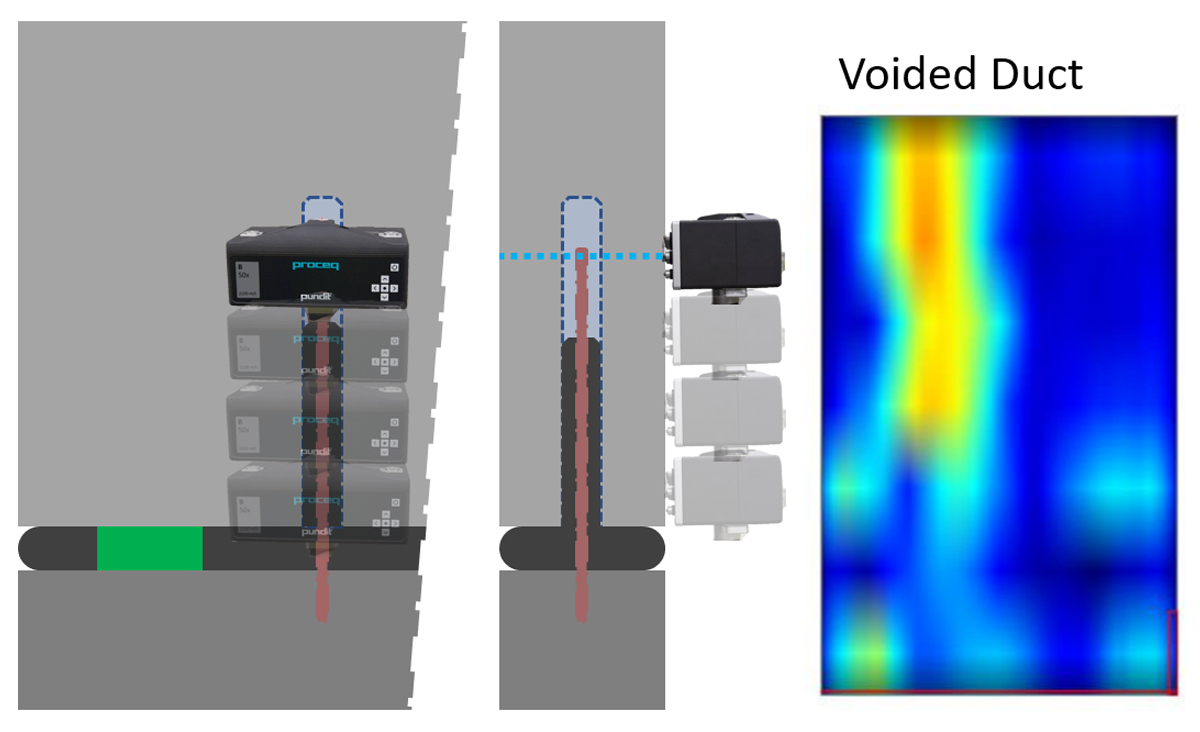
In the example below an unvoided pocket returns less energy [as represented by a less intense colour coding, blue vs red] and allows the shear wave energy to strike outside and inside the pocket.
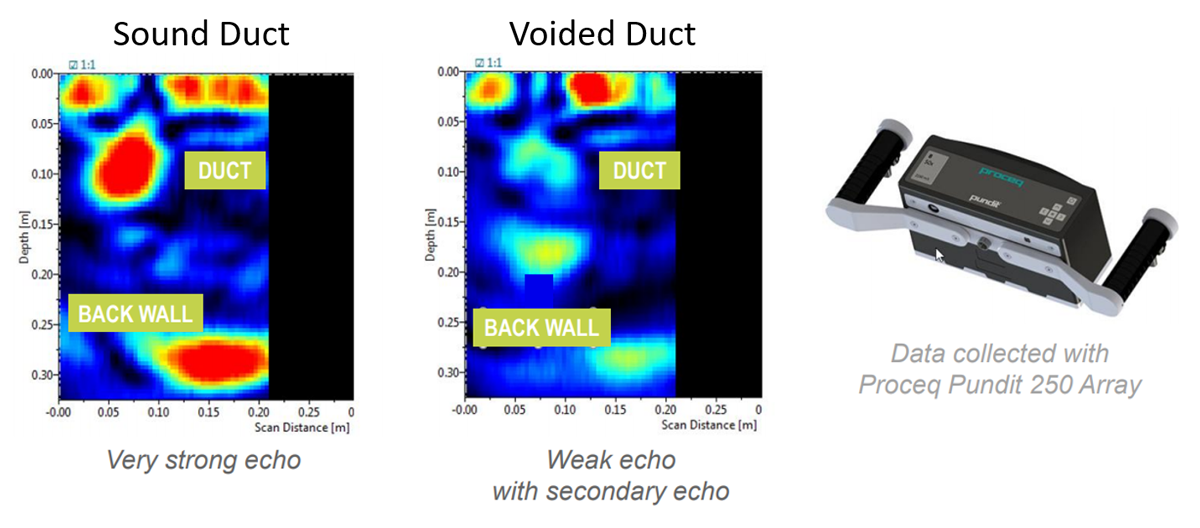
Ultrasonic Pulse Echo data is very flexible in presentation. C-Scan images present a slice at a specific depth of an element and may be used to show the length of a duct, and any suspect regions within. In the example the very strong echo from an empty duct is seen in the second C-Scan.
Impact Echo
Impact echo testing is a resonance test of concrete, it has geometric limitations that make it most effective in slabs, walls, and other flat elements.
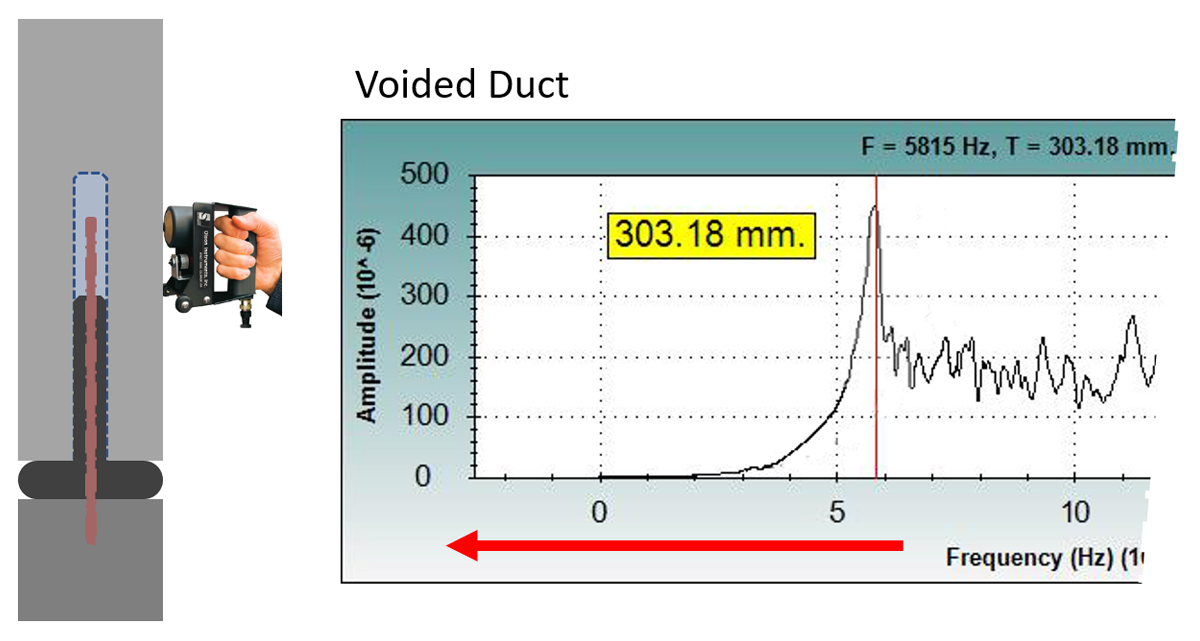
Impact Echo data is presented as a chart of the sound Frequency Spectrum from tapping the material, mapped to amplitude [Energy] the highest energy peak is the dominant frequency, which in a simple slab or wall is related to the thickness.
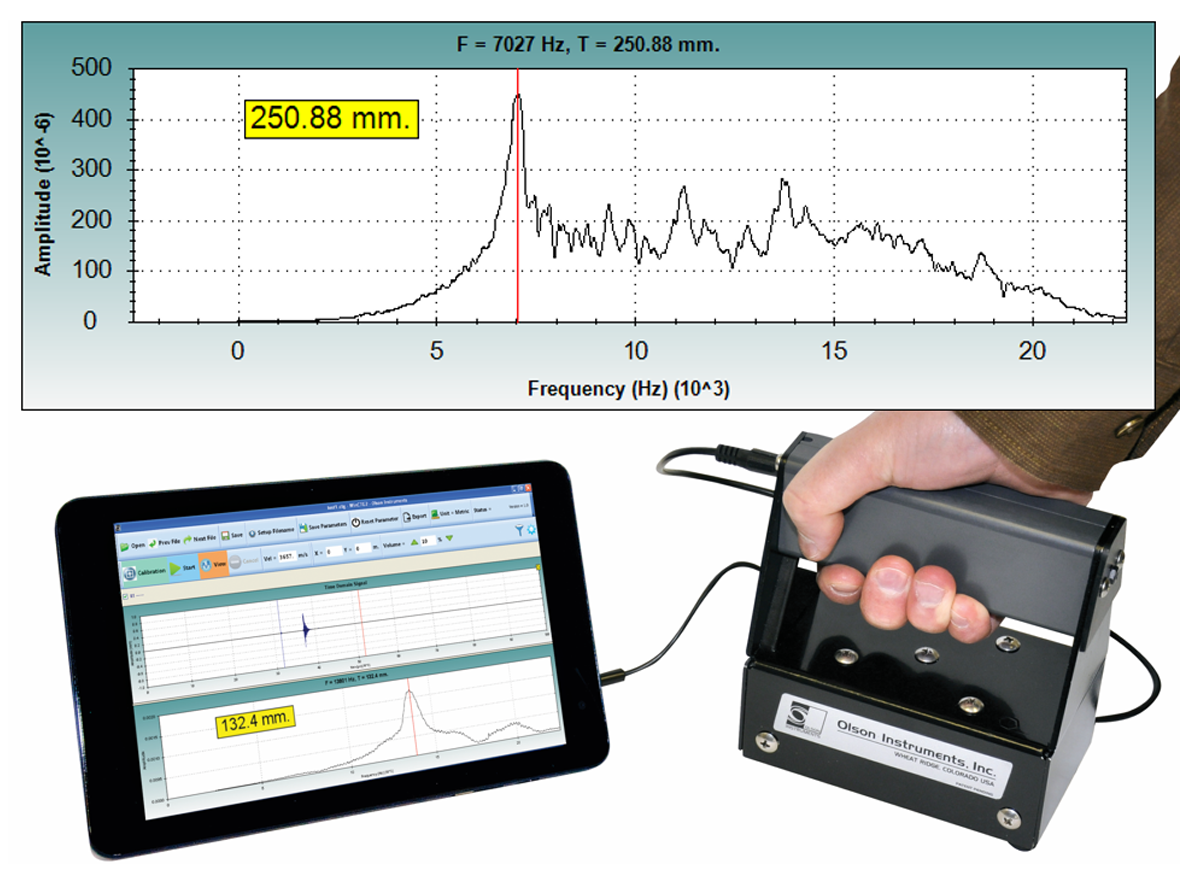
For the specific application of investigating grouted pockets in an element the test is taken directly on top of the pocket. The dominant frequency is now controlled by both thickness and the hollowness of the grouting pocket.
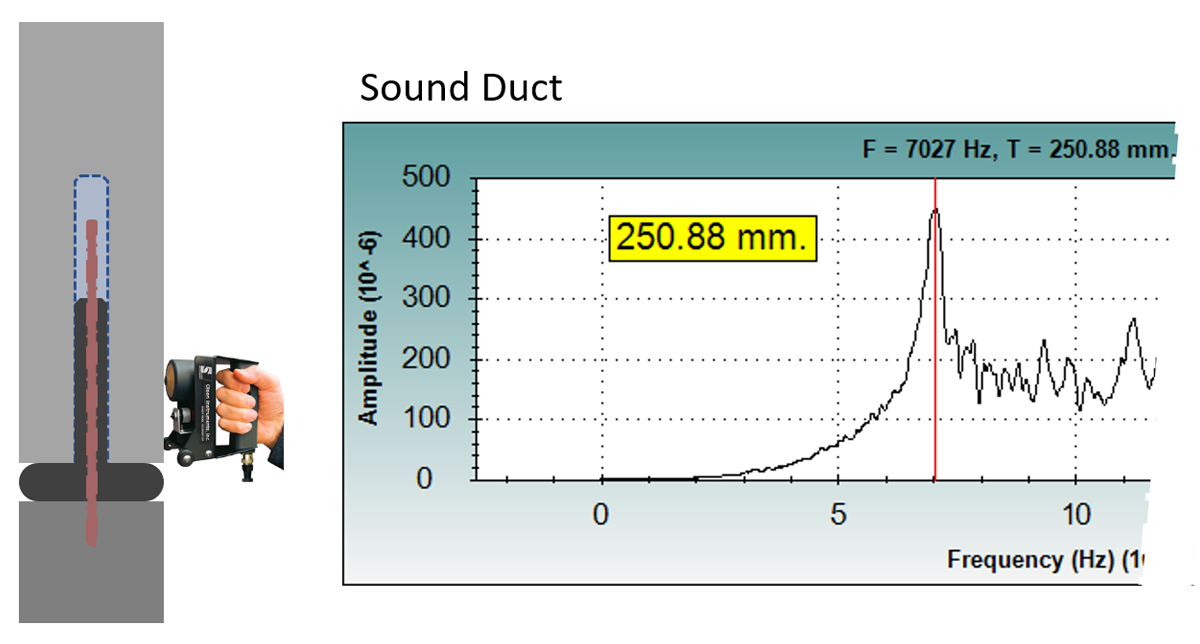
Practically an inspector can compare the average dominant frequency of tests on compliant pockets to a specific test, and if the frequency deviates from this average it indicates a lack of grouting. The most common effect of a void is a "Red Shift" a decrease in the dominant frequency, illustrated below.
Please note the examples above are indicative of expected or possible test results and are not a guide to interpretation, it is very important to trial any technique on a structure and to determine its suitability and sensitivity to defects in that structure. Contact your Local PCTE representative to set up a demonstration or trial.