%20vector%20logo.svg)

Phone: 02 9453 9999 or Email: sales-operations@pcte.com.au

Novascan is a full-featured portable ultrasound phased array inspection instrument that displays multiple ultrasonic cross-sectional images producing accurate measurements.
Overview | GX1 vs GX2 | SUE & Utilities | Structures & Pavements | Software & Outputs | Case Studies | Specifications | Support
Collect high-density, georeferenced GPR data across wide areas and view the subsurface in 3D as you scan. Choose the GX2 array for SUE and utility mapping, or the GX1 array for structural, bridge and pavement investigations.
Best suited to:
Best suited to:
Recommended array: GX2
Recommended array: GX1
Cover more ground
Collect multiple parallel profiles in one pass instead of uilding a grid line by line.
See results during acquisition
View georeferenced radargrams and time-slice information in the field rather than waiting until the data is returned to the office.
Produce repeatable mapped data
Combine wheel-positioned GPR data with GNSS, project coordinates and survey linework.
Use one platform for two very different applications
Exchange GX1 and GX2 arrays without purchasing two complete cart platforms.
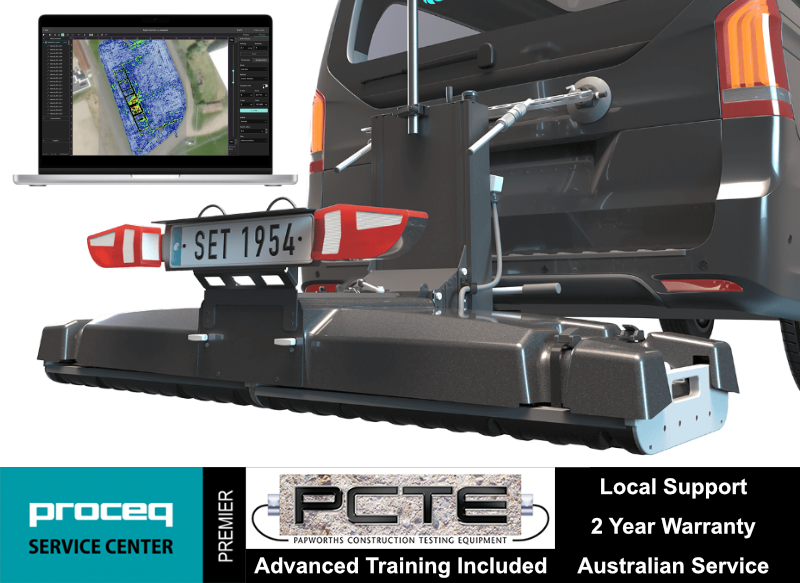
The GX2 transforms the GS9000 into a high-density subsurface utility mapping system. Its 11-channel, low-frequency GPR array captures an 83 cm-wide swath in each pass, helping operators detect and map buried pipes, ducts, cables, voids and other subsurface features. Live georeferenced data lets SUE teams review coverage on site and produce accurate CAD, GIS and project-coordinate deliverables.
1. Plan the survey
Load satellite imagery, CAD information, project coordinates or survey control.
2. Collect dense multichannel data
Survey an approximately 0.82 m-wide swath with 11 channels in each pass.
3. Review data live
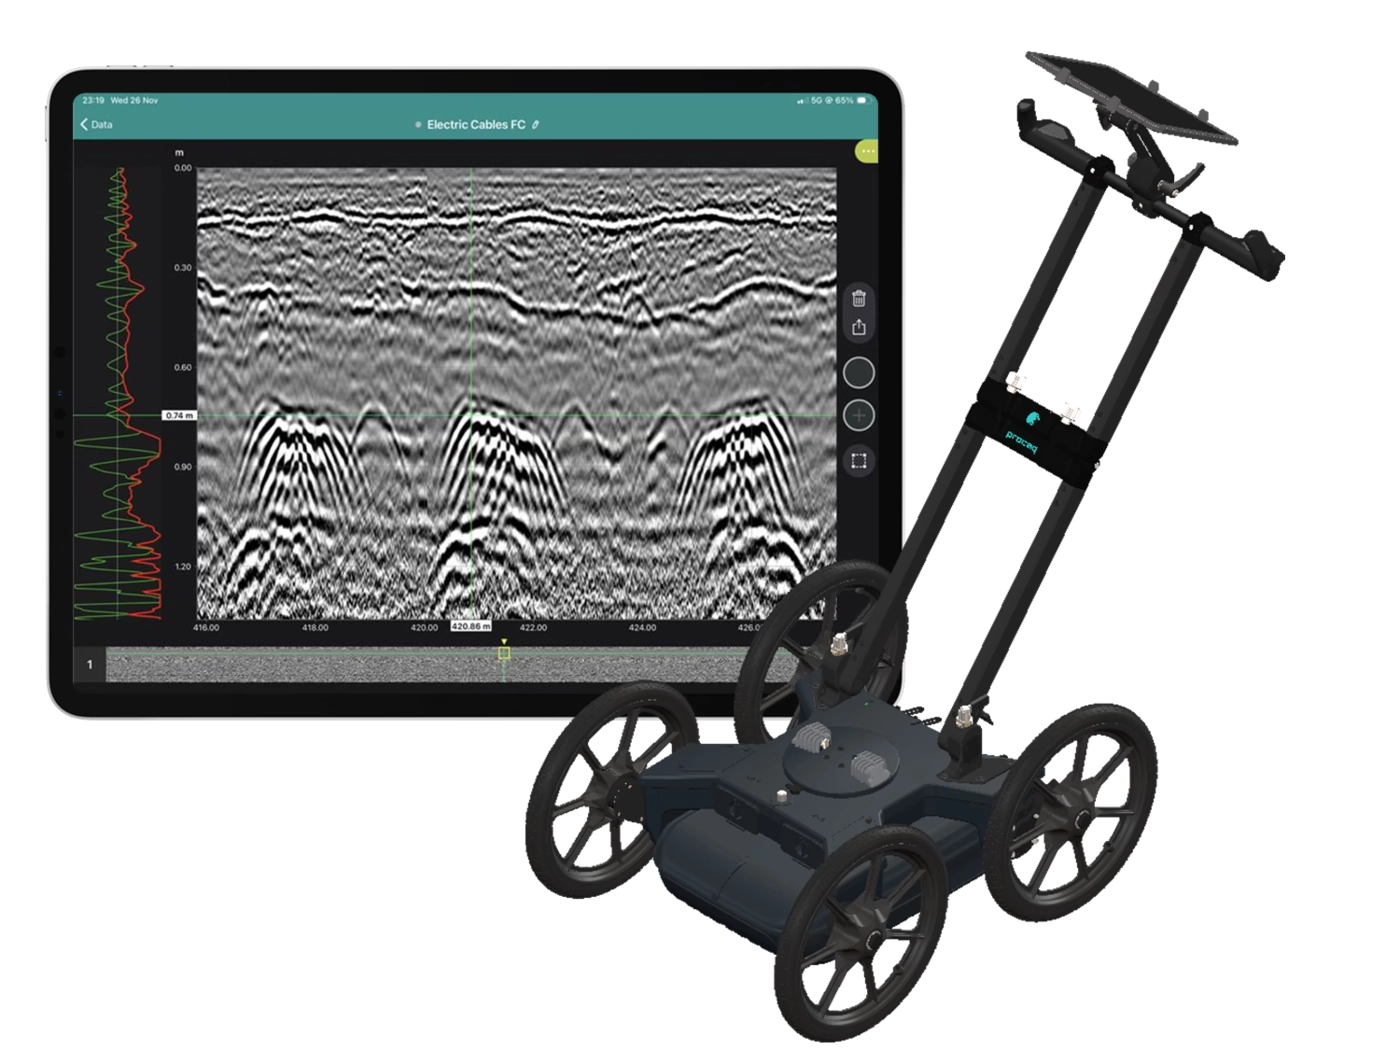
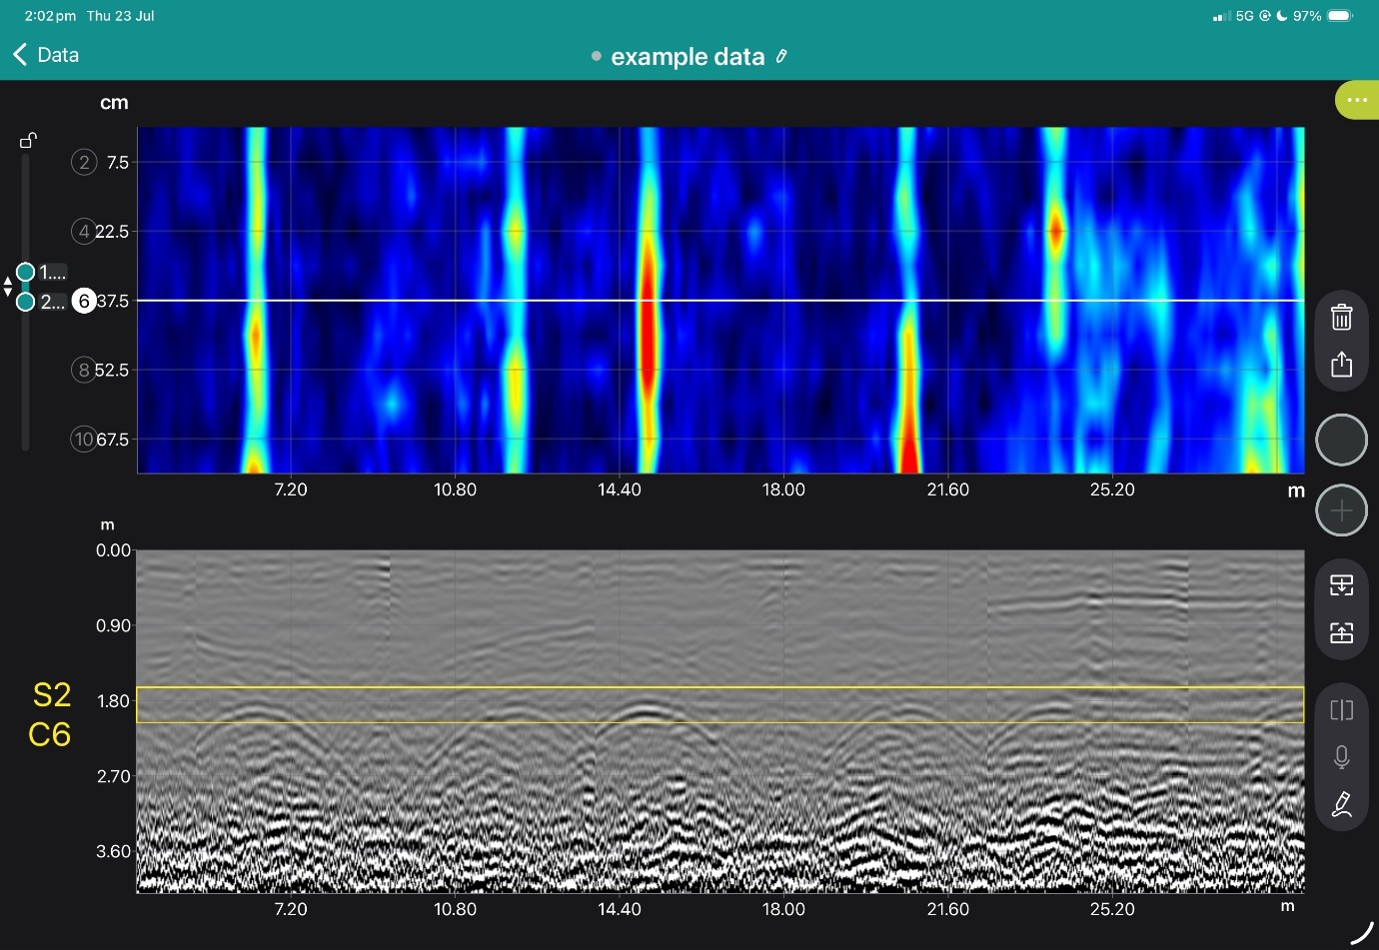
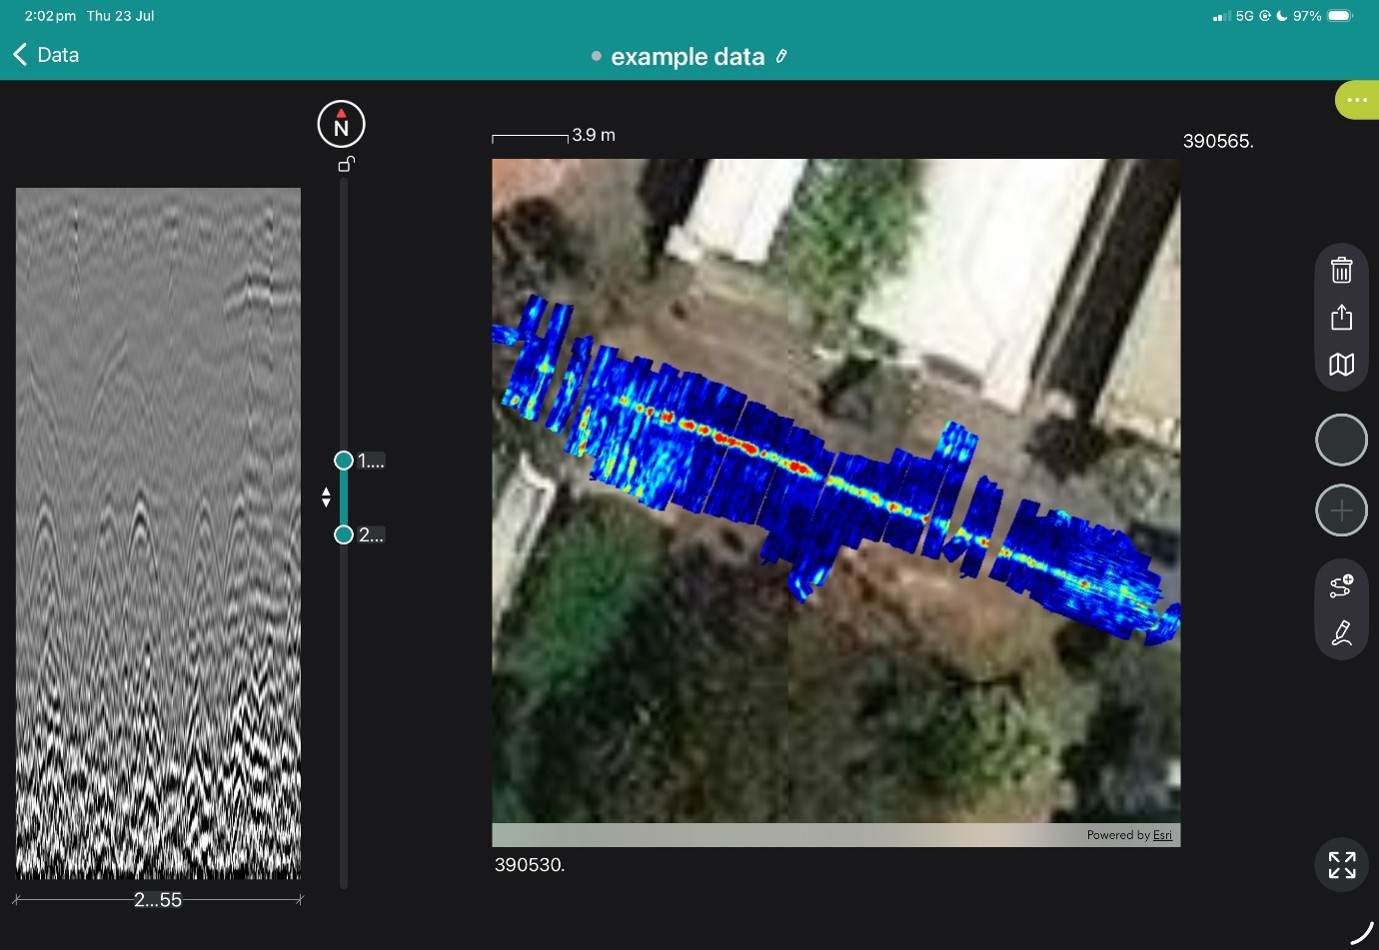
Examine radargrams, georeferenced time slices and marked features while still on site.
4. Interpret and digitise
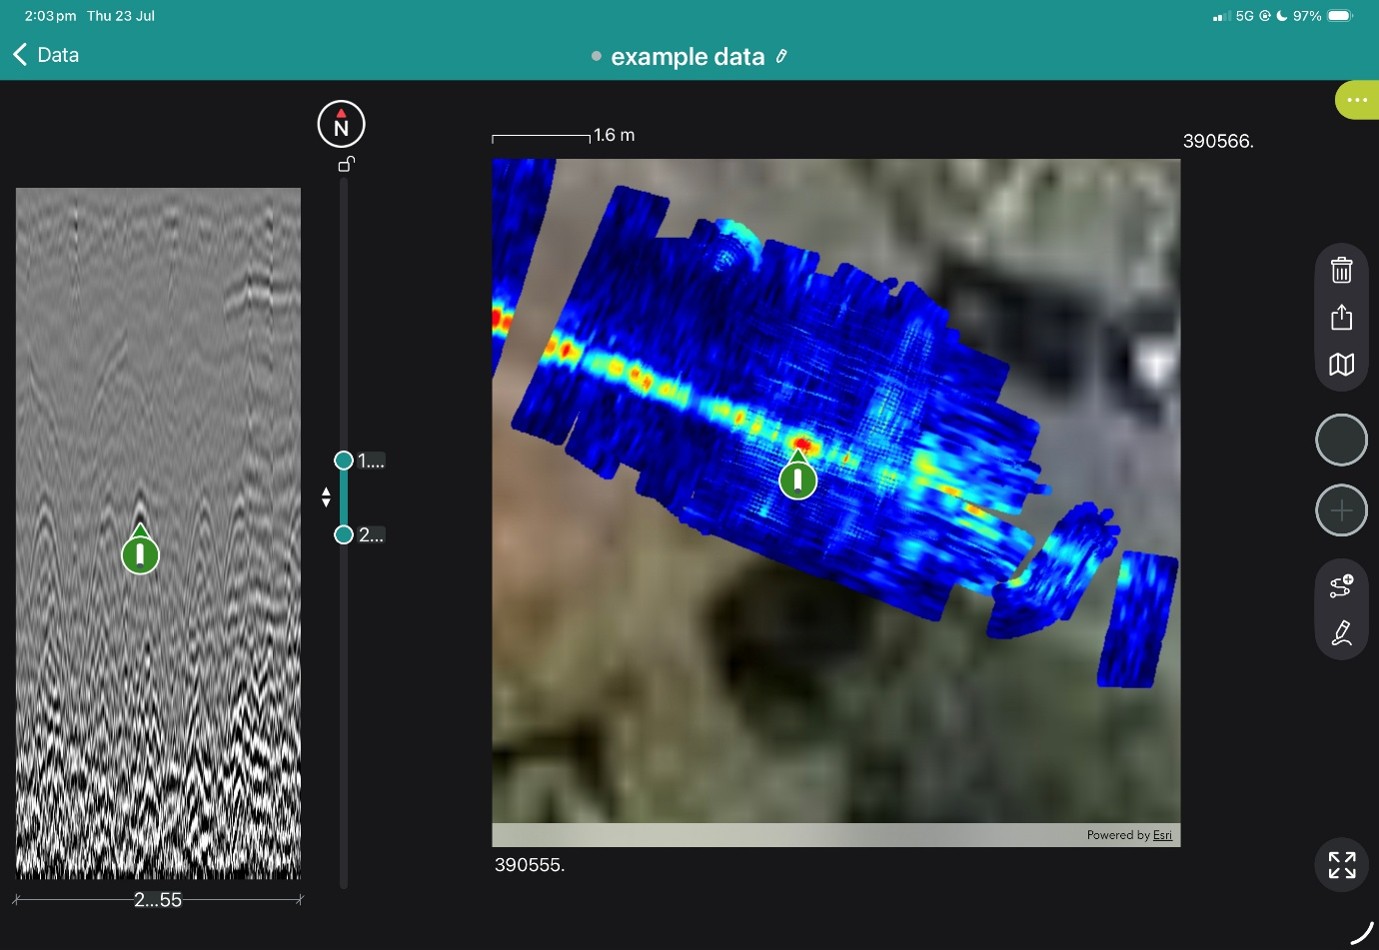
Add points, linework, tags, photographs and field observations.
5. Process and deliver
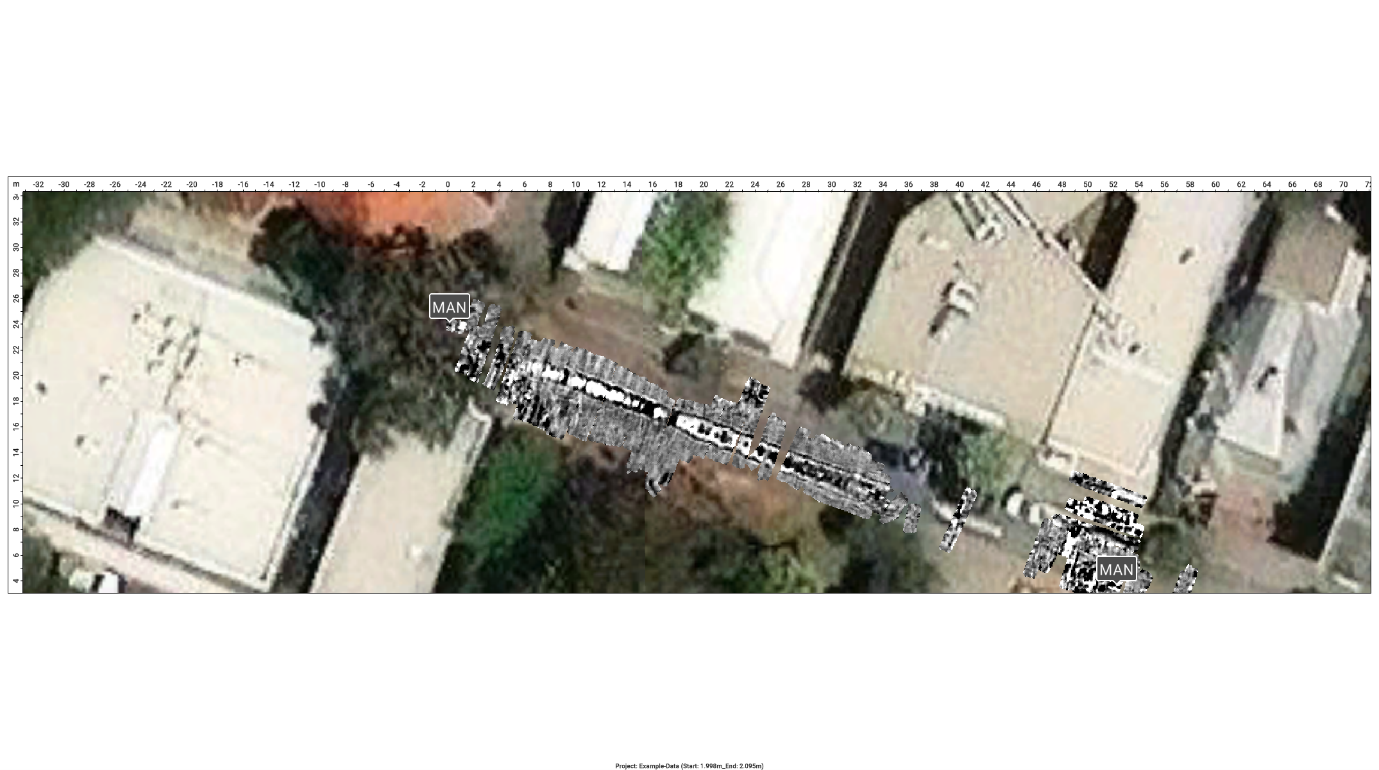
Merge survey areas, apply processing and export mapped information for the customer’s CAD, GIS or reporting workflow.
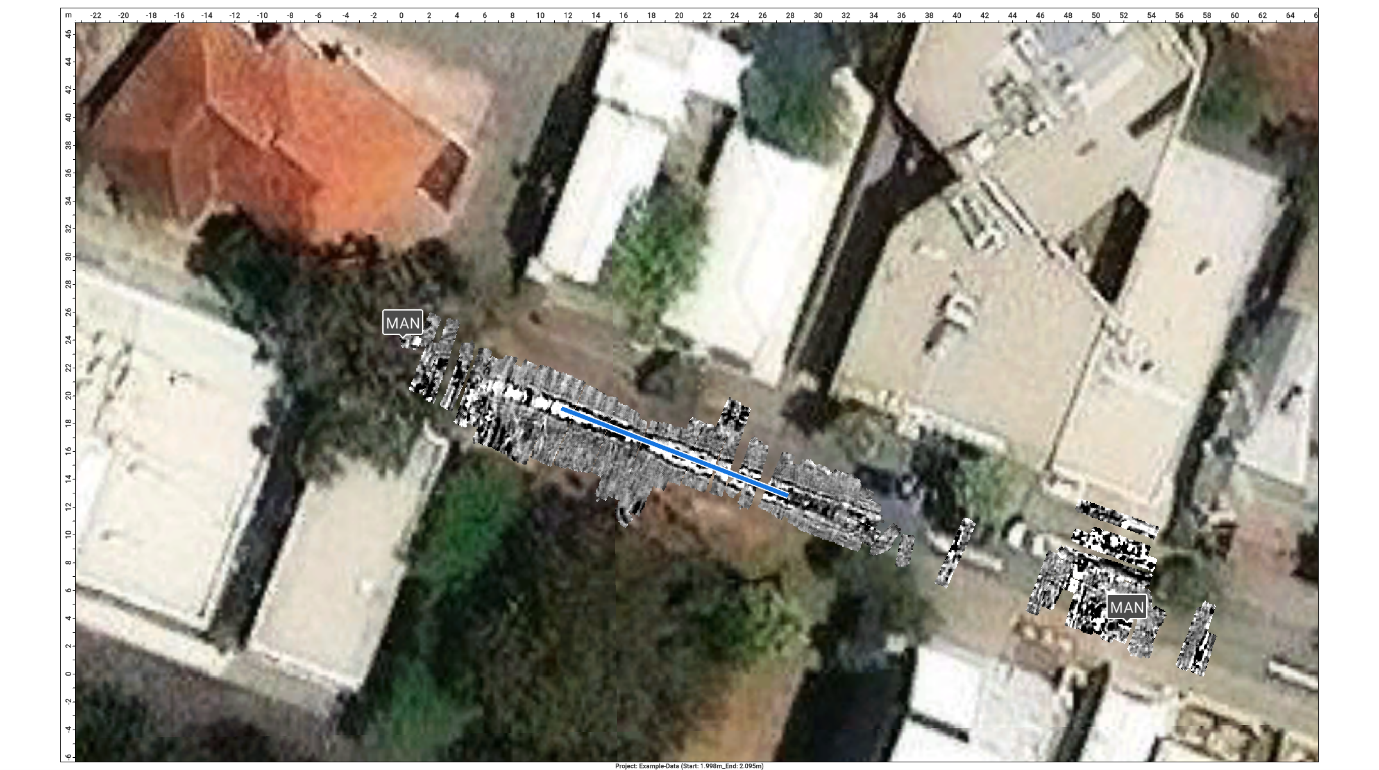
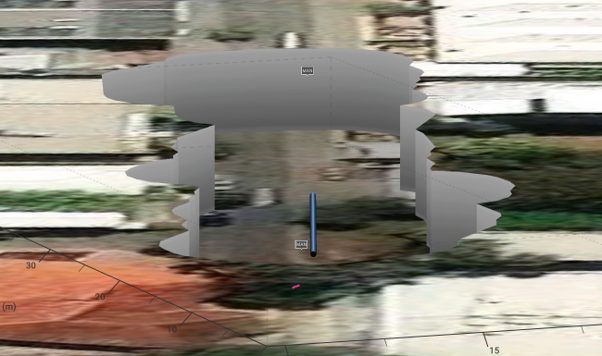
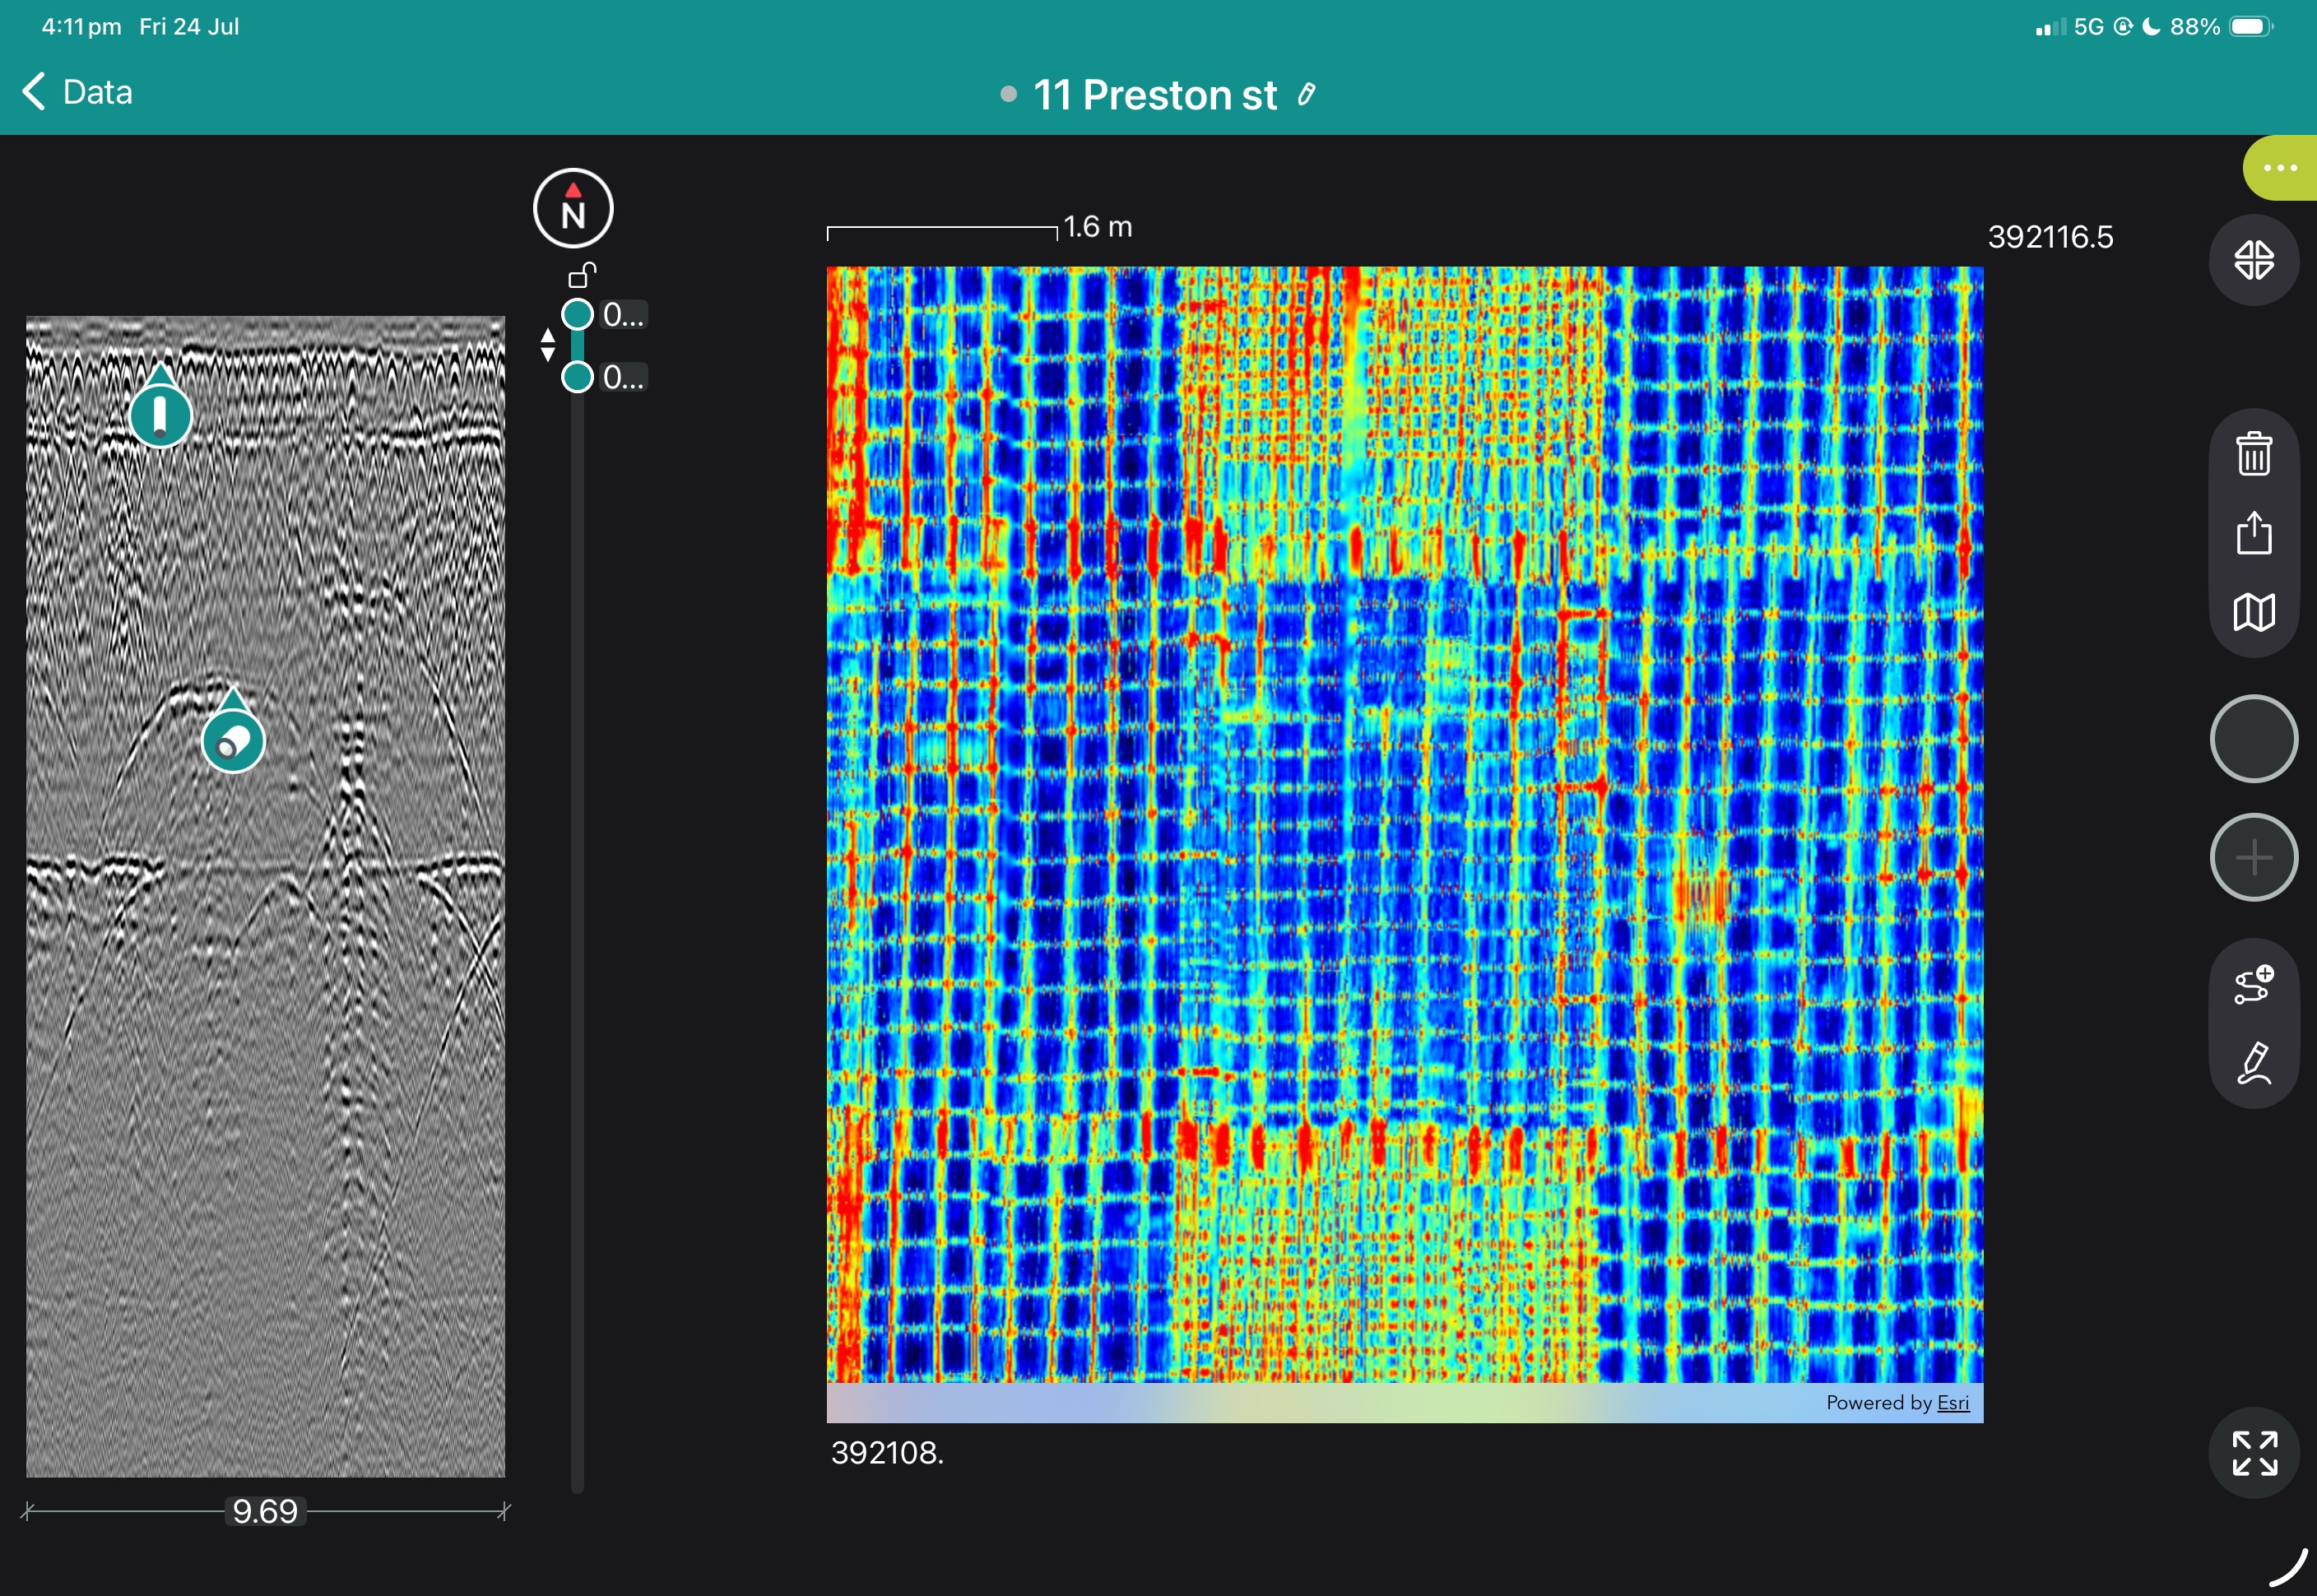
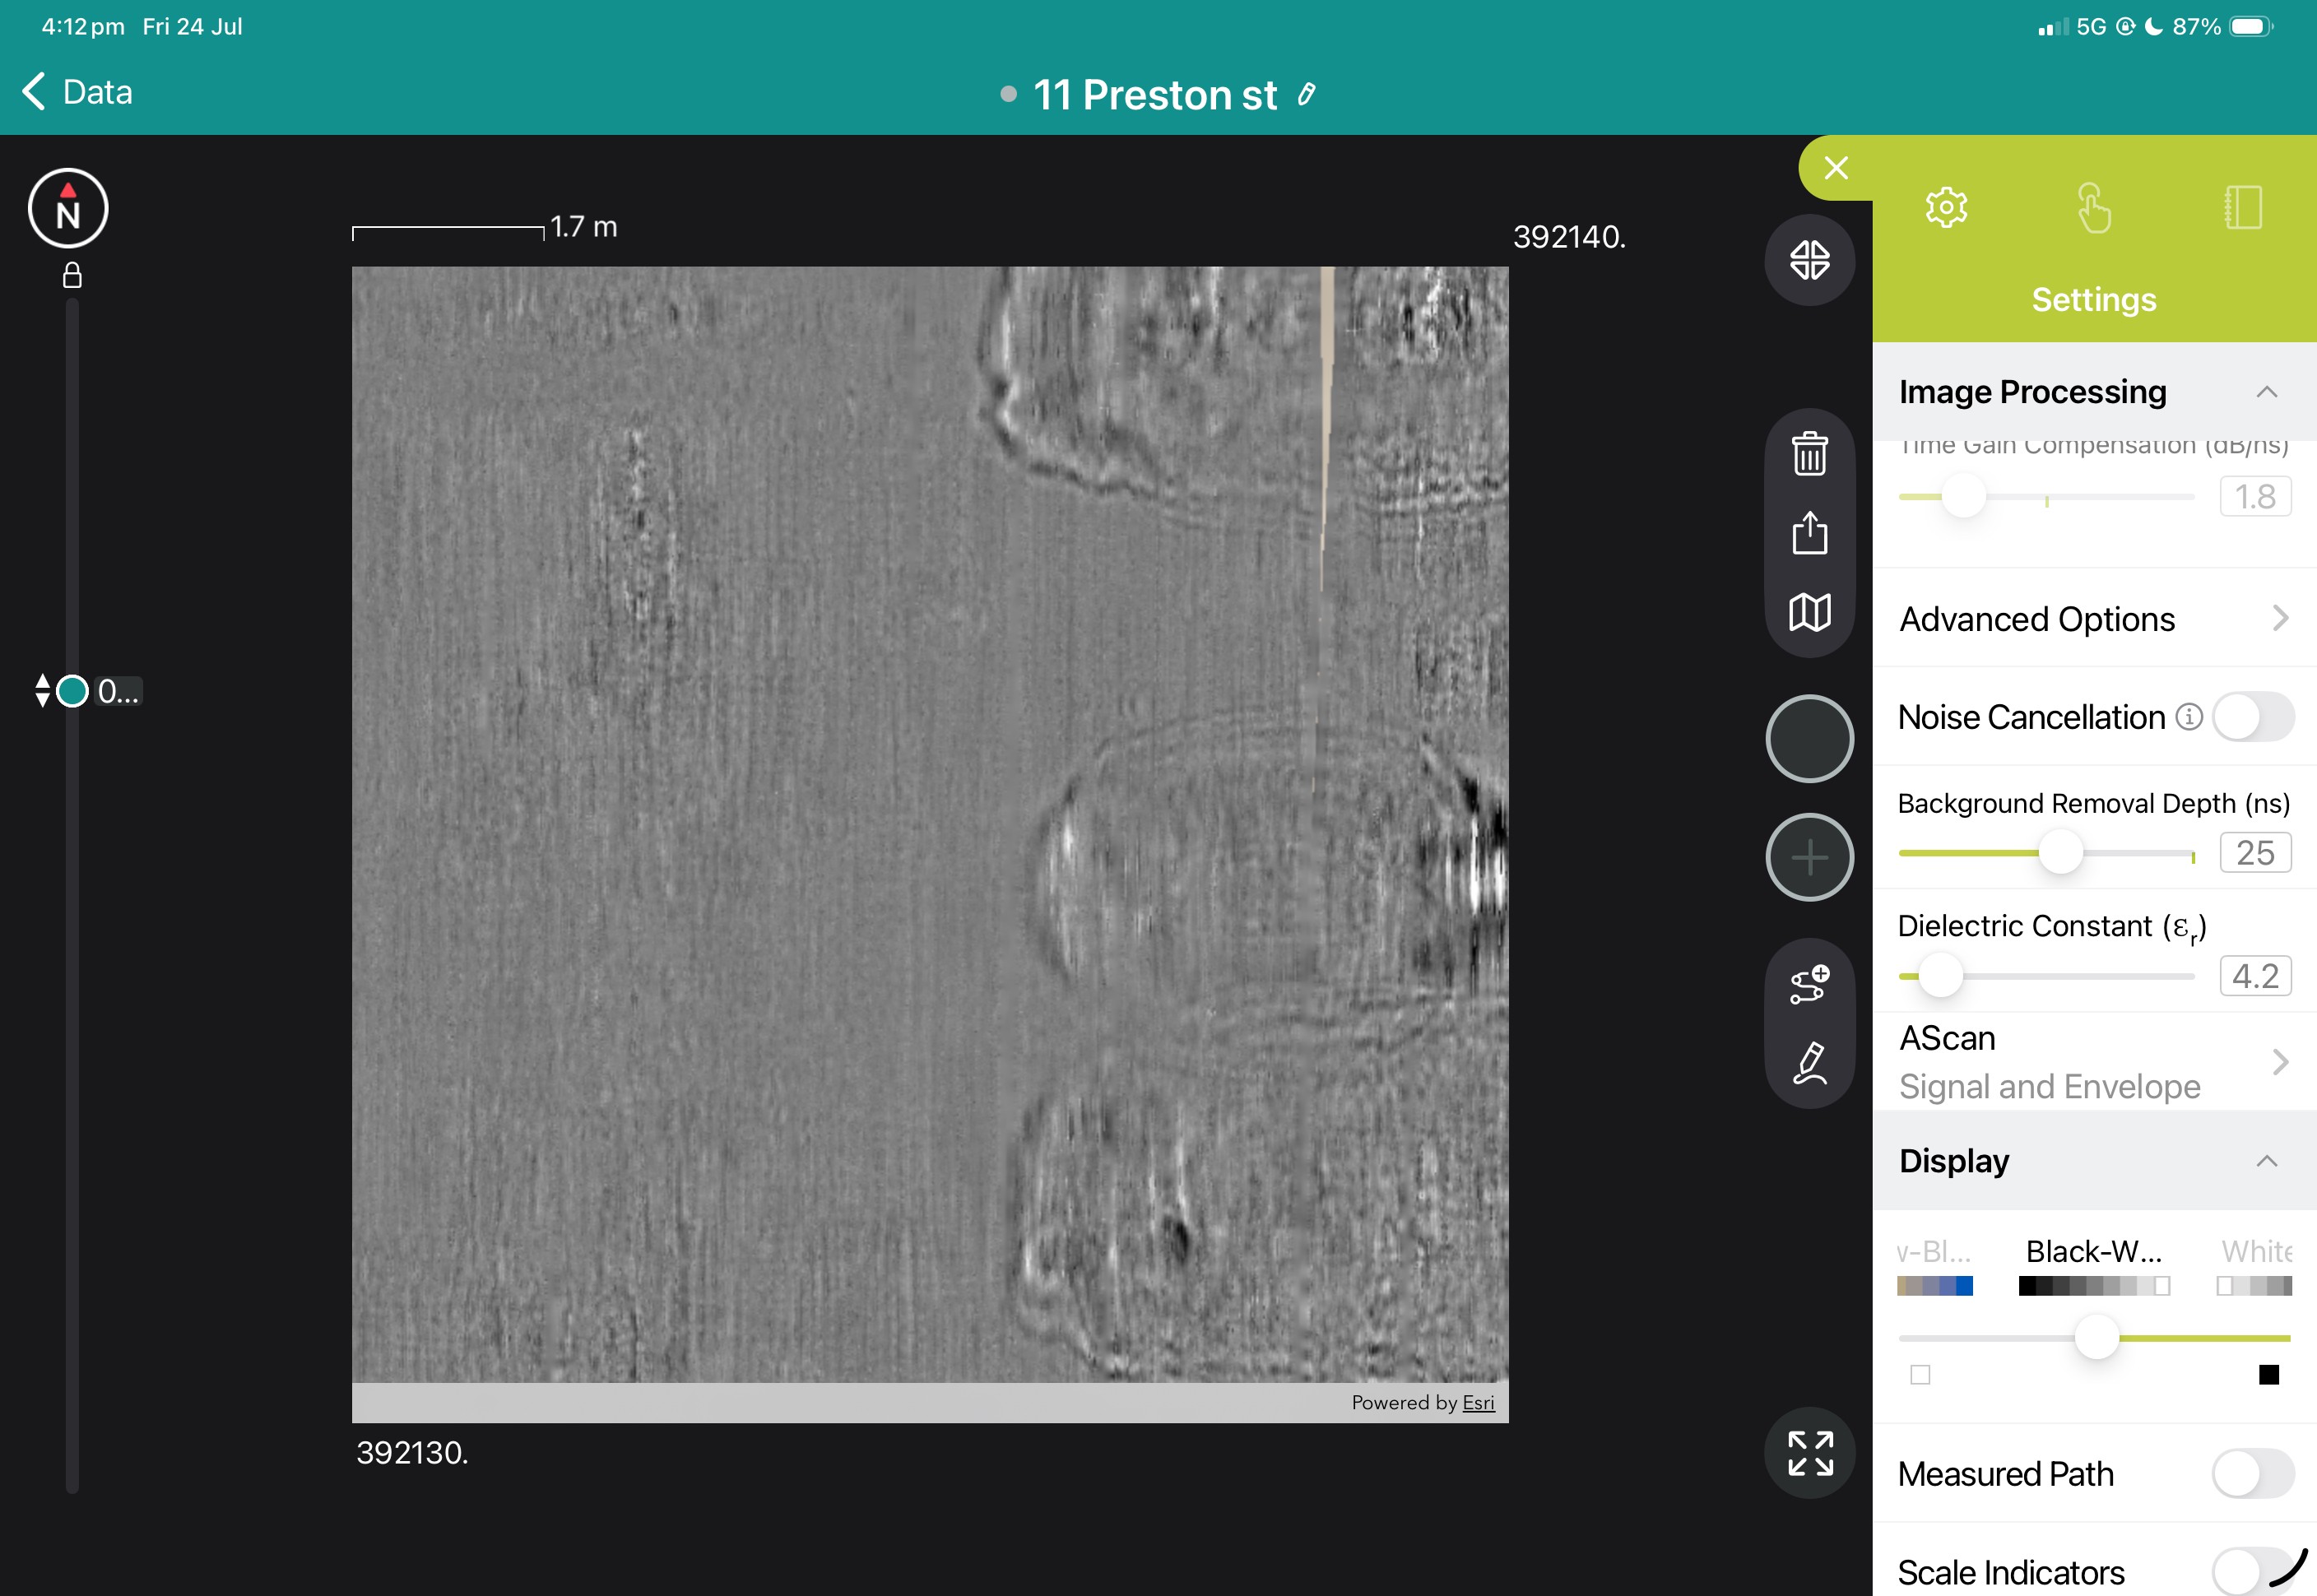
View the images below to see these in action.

Phased Array inspection incorporates multi element probes to scan components at greater speeds than conventional ultrasonics. In addition to the phased array function and two-channel TOFD probes, it also supports the latest inspection techniques being Total Focusing Method imaging (TFM) and Full Matrix Capture (FMC) data acquisition. The number of imaging points is 1024x1024, which greatly improves quality and gives greater probability of detection for smaller defects.
The Novascan has a Field Programmable Gate Array (FPGA) connection interface, which suits both field and laboratory applications. The fast signal processing is an advantage for on-site inspections saving time and generating efficiency. It also allows the instrument to transmit the underlying data to the user, making it easier for users (such as research institutes and universities) to conduct secondary development.
Equipped with a new scan planning process, Novascan can realize 3D focus law simulation, multiple groups of simultaneous simulation and greatly simplify the user setting interface. This allows a quicker and efficient process simulation and calibration in the shortest time.
The Novascan is equipped with a two-dimensional coded interface, which facilitates high-speed two-dimensional scanning and supports DLA and DMA probes. Both can be used for austenitic stainless steel inspections. With 32 groups for simultaneous detection and 8 groups displayed on the same screen, it is more than capable for complex analysis/detection applications.

The defects are displayed in real-time 3D. Meanwhile, the S-scan and A-scan can also be viewed, to help confirm signal interpretation. This allows for fast & intuitive defect detection. The 3D diagram can be rotated to allow full rotation to view the defect from any angle. To aid analysis of the defect, a data scanning line can be dragged onto the the 3D diagram which will show the S-scan and A-scan information.
For high-speed two dimensional scanning a Dual-axis encoder can be used . It is recommended to utilise the Doppler dual-axis scanning system as it is matched to the encoder with little set-up required. The length of X axis can be customized, and the step size of Y axis does not need to be set for Y axis. The system automatically recognizes the step size of Y axis, and displays the data after processing in a two-dimensional scanning map. The maximum size Scanning map is 30M x 10M (X x Y).

Novascan software supports multi-group focus simulations to demonstrate PA and TOFD ultrasonic beam coverage. By selecting the Parameter Settings button, the inspector can set or change the values to assist the interpretation or analysis data.
Multiple groups are scanned in parallel at the same time. Up to 32 groups can be set with the maximum focal laws for all groups not exceeding 512. Multi-group synchronization can adjust the individual parameters of any group. The individual parameters of all groups will be adjusted together. Scan axis synchronization, moving the position cursor of a group’s scan axis will drive the synchronous movement of the position cursors of all groups’ scan axes.
Test component types are optional: Plate, Round Tube, Square Tube or Socket. Set corresponding parameters to generate a 3D preview, to allow viewing from different angles, such as top view and front view. The simulation supports a display of 3D specimen welding, S scan of 2D specimen and cross-section simulation of weld being inspected.
TFM is a new inspection method using Full Matrix Capture (FMC), which has the advantages of higher accuracy, with improved resolution for smaller near-surface blind zones, creating a larger scan range than conventional phased array inspection methods. This then increases the probability of detecting High Temperature Hydrogen Attach (HTHA). With ongoing continuous development of the Novascan, the issue of dealing with large inspection data can be resolved.
Defect sizing is required for corrosion inspection, where a defect is selected and framed in C-scan and the area of frame selected is calculated automatically. To aid efficiency, the generated defect list is recorded in excel after the recording is merged and exported along with the report.
The Novascan supports several different gate modes including: straight gate, curved gate, rectangular gate and profiled gate. The user can select a nominated area to collect data according to the defect characteristics of the test component. Interference signals are removed to obtain a pure C-scan image. This greatly reduces the difficulty of defect evaluation and is particularly suitable for complex geometry components.
For PA linear scan inspection data (e.g. corrosion inspection data), click Measurement > Area Calculation to identify the corrosion defects in the C-scan and S-scan. The software automatically calculates the corrosion area and records it in the report.
The NOVASCAN can perform lateral wave synchronization and lateral wave removal. Defect length and depth can be determined easily.
The off-line software is the perfect PC-based software complements the Novascan instruments, and seamlessly imports files for advanced processing and analysis. A total of 18 display modes are available, supporting simultaneous display of 4 sets of data. Facilitating image enlargement, it can quickly locate and quantitatively measure defects. Supports a variety of standards, allows the assessment of the defect grade discrimination. A variety of weld illustrations and CAD files can be imported to assist in defect identification.
Book a SUE Workflow Demonstration
The GX1 transforms the GS9000 into a high-resolution structural assessment system for concrete slabs, bridge decks and pavements. Its dense, dual-polarisation array captures detailed 3D data across wide areas, supporting reinforcement and cover mapping, moisture and deterioration assessment, and analysis of asphalt and pavement layers. Live visualisation helps confirm survey coverage on site, while post-processing tools produce clear, report-ready condition maps.
1. Define the inspection area
Import the structure, bridge, pavement or survey background.
2. Collect closely spaced profiles
Capture 35 longitudinal and 15 cross-polarised channels with dense spacing.
3. Review coverage in the field
Use live radargrams and time slices to confirm that the required area has been captured.
4. Process the dataset
Apply velocity, gain, background removal, migration, filtering and topographic correction as appropriate.
5. Generate diagnostic maps
Create depth slices, reinforcement maps, layer information or application-specific condition maps.
6. Integrate with the engineering assessment
Export figures, mapped anomalies and raw data for inclusion in the engineer’s final interpretation and report.
Field information
Processed Diagnostic Information
Engineering deliverables
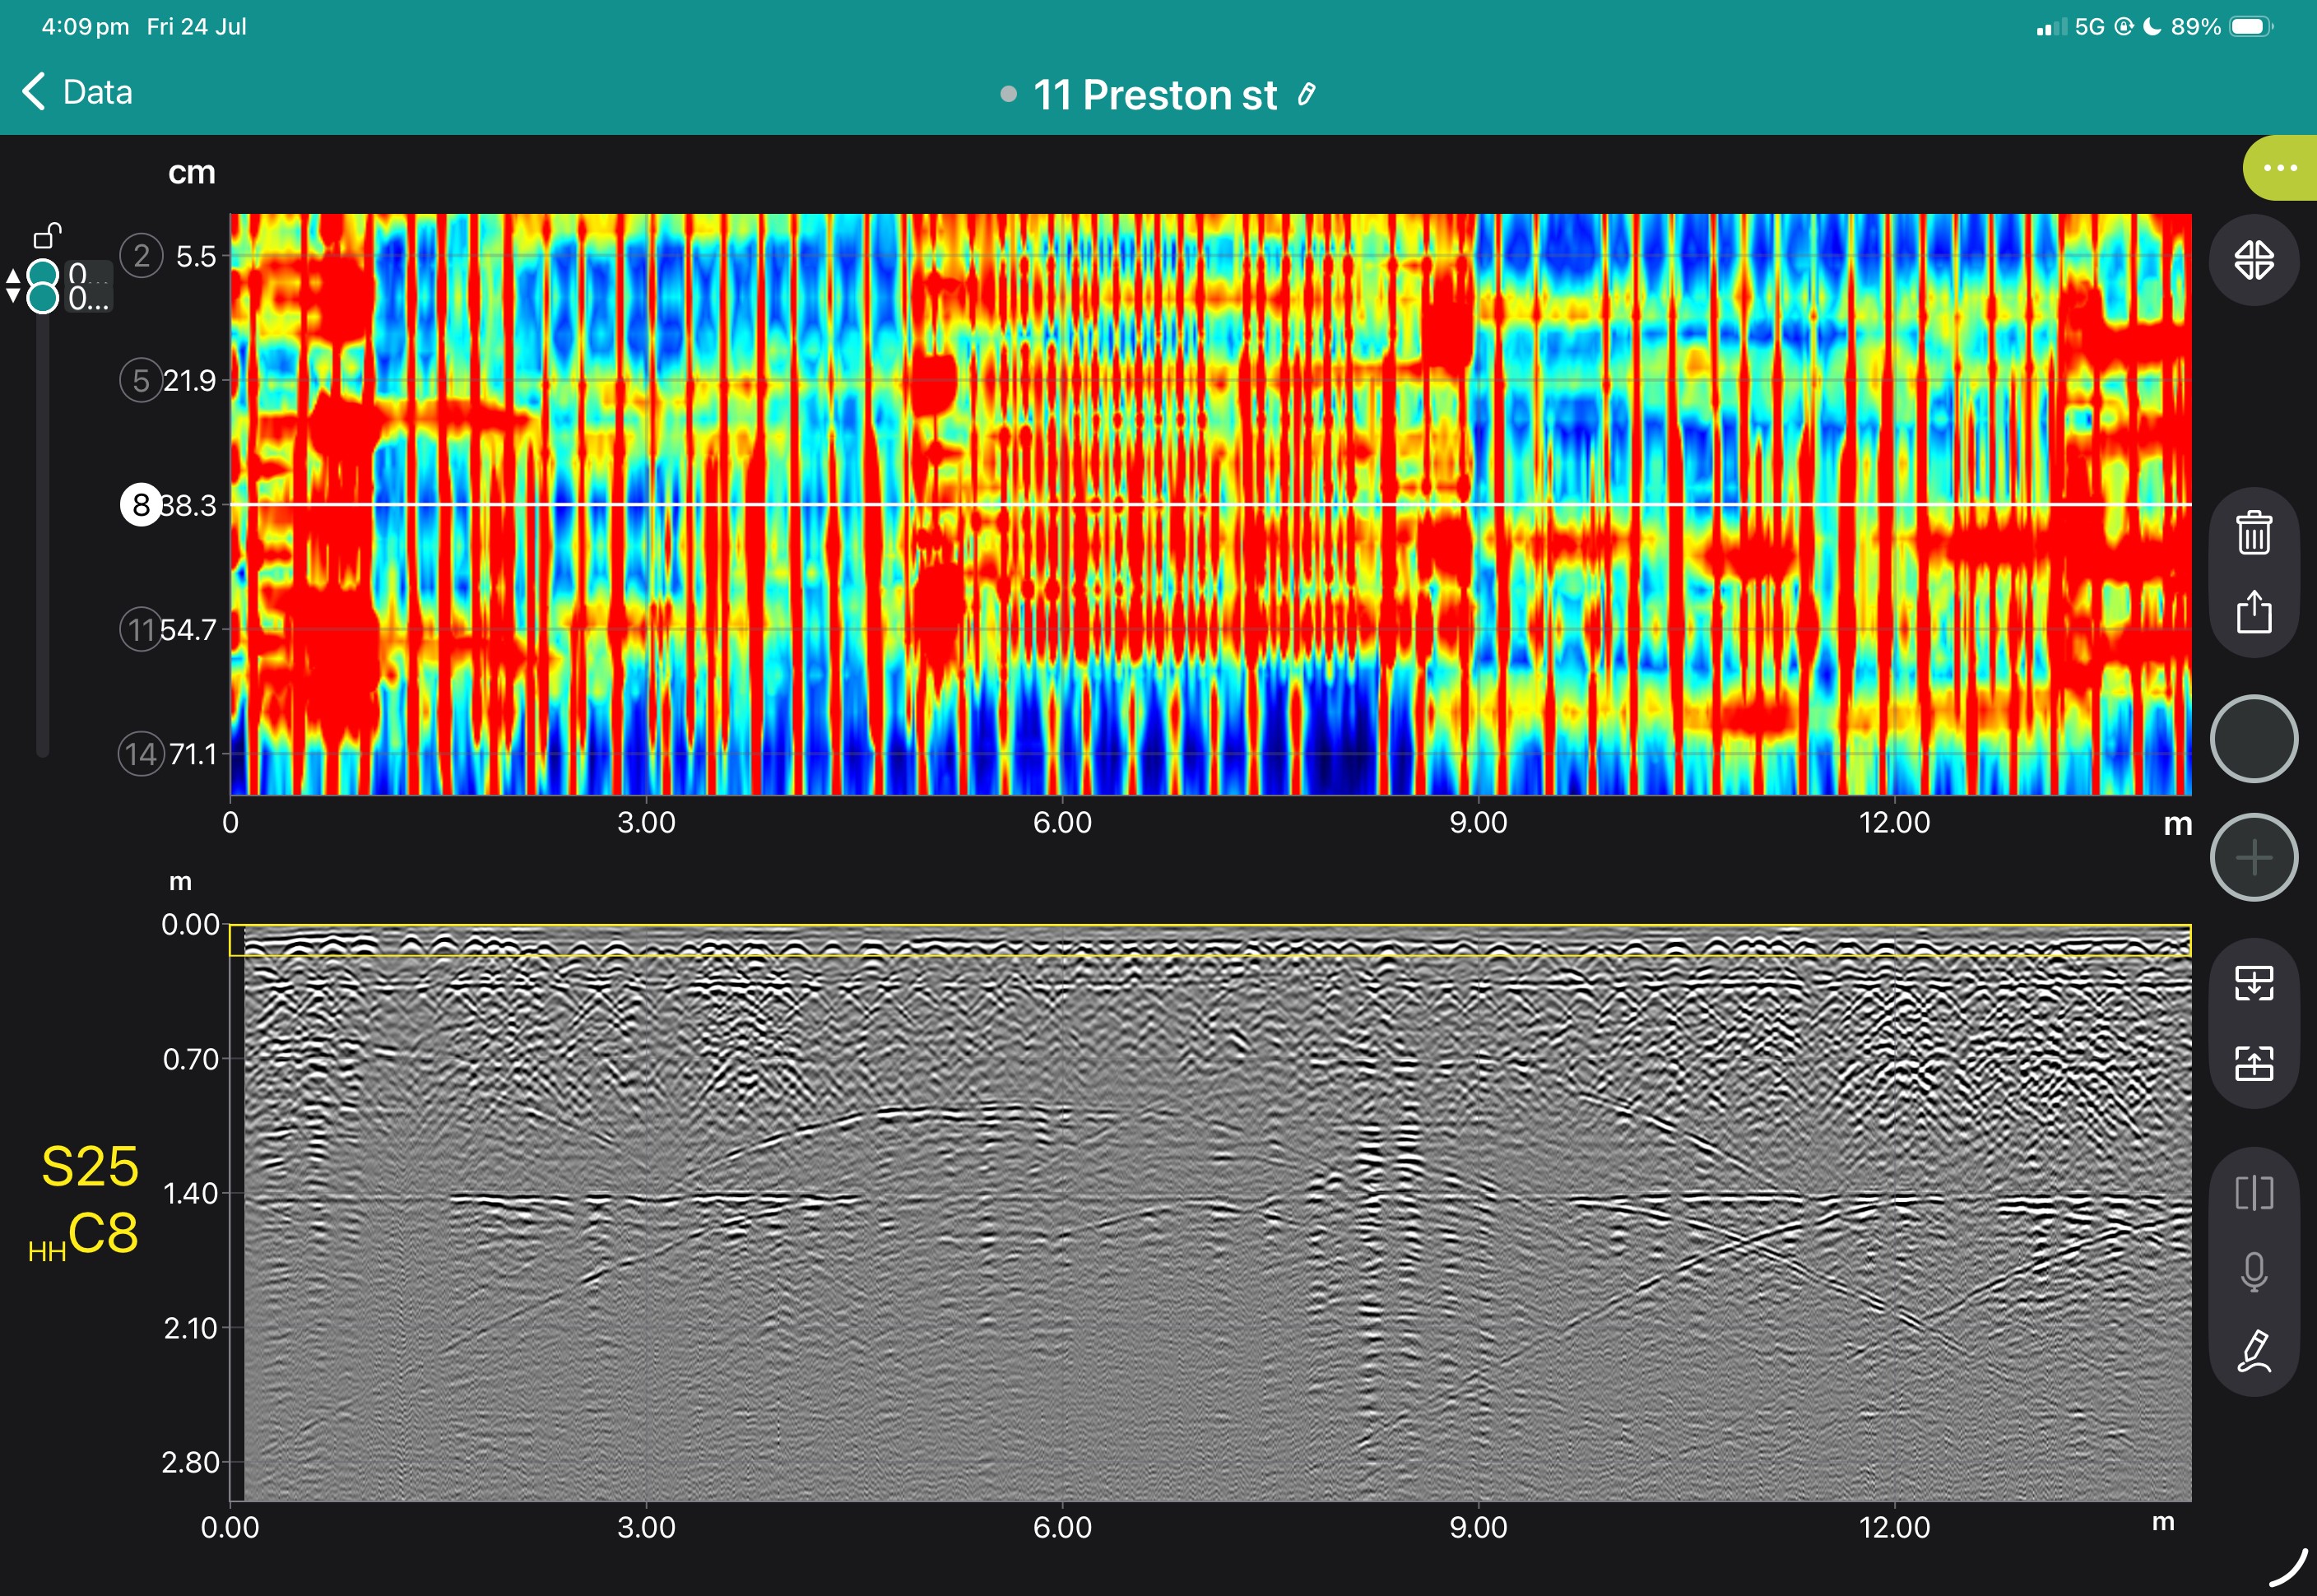
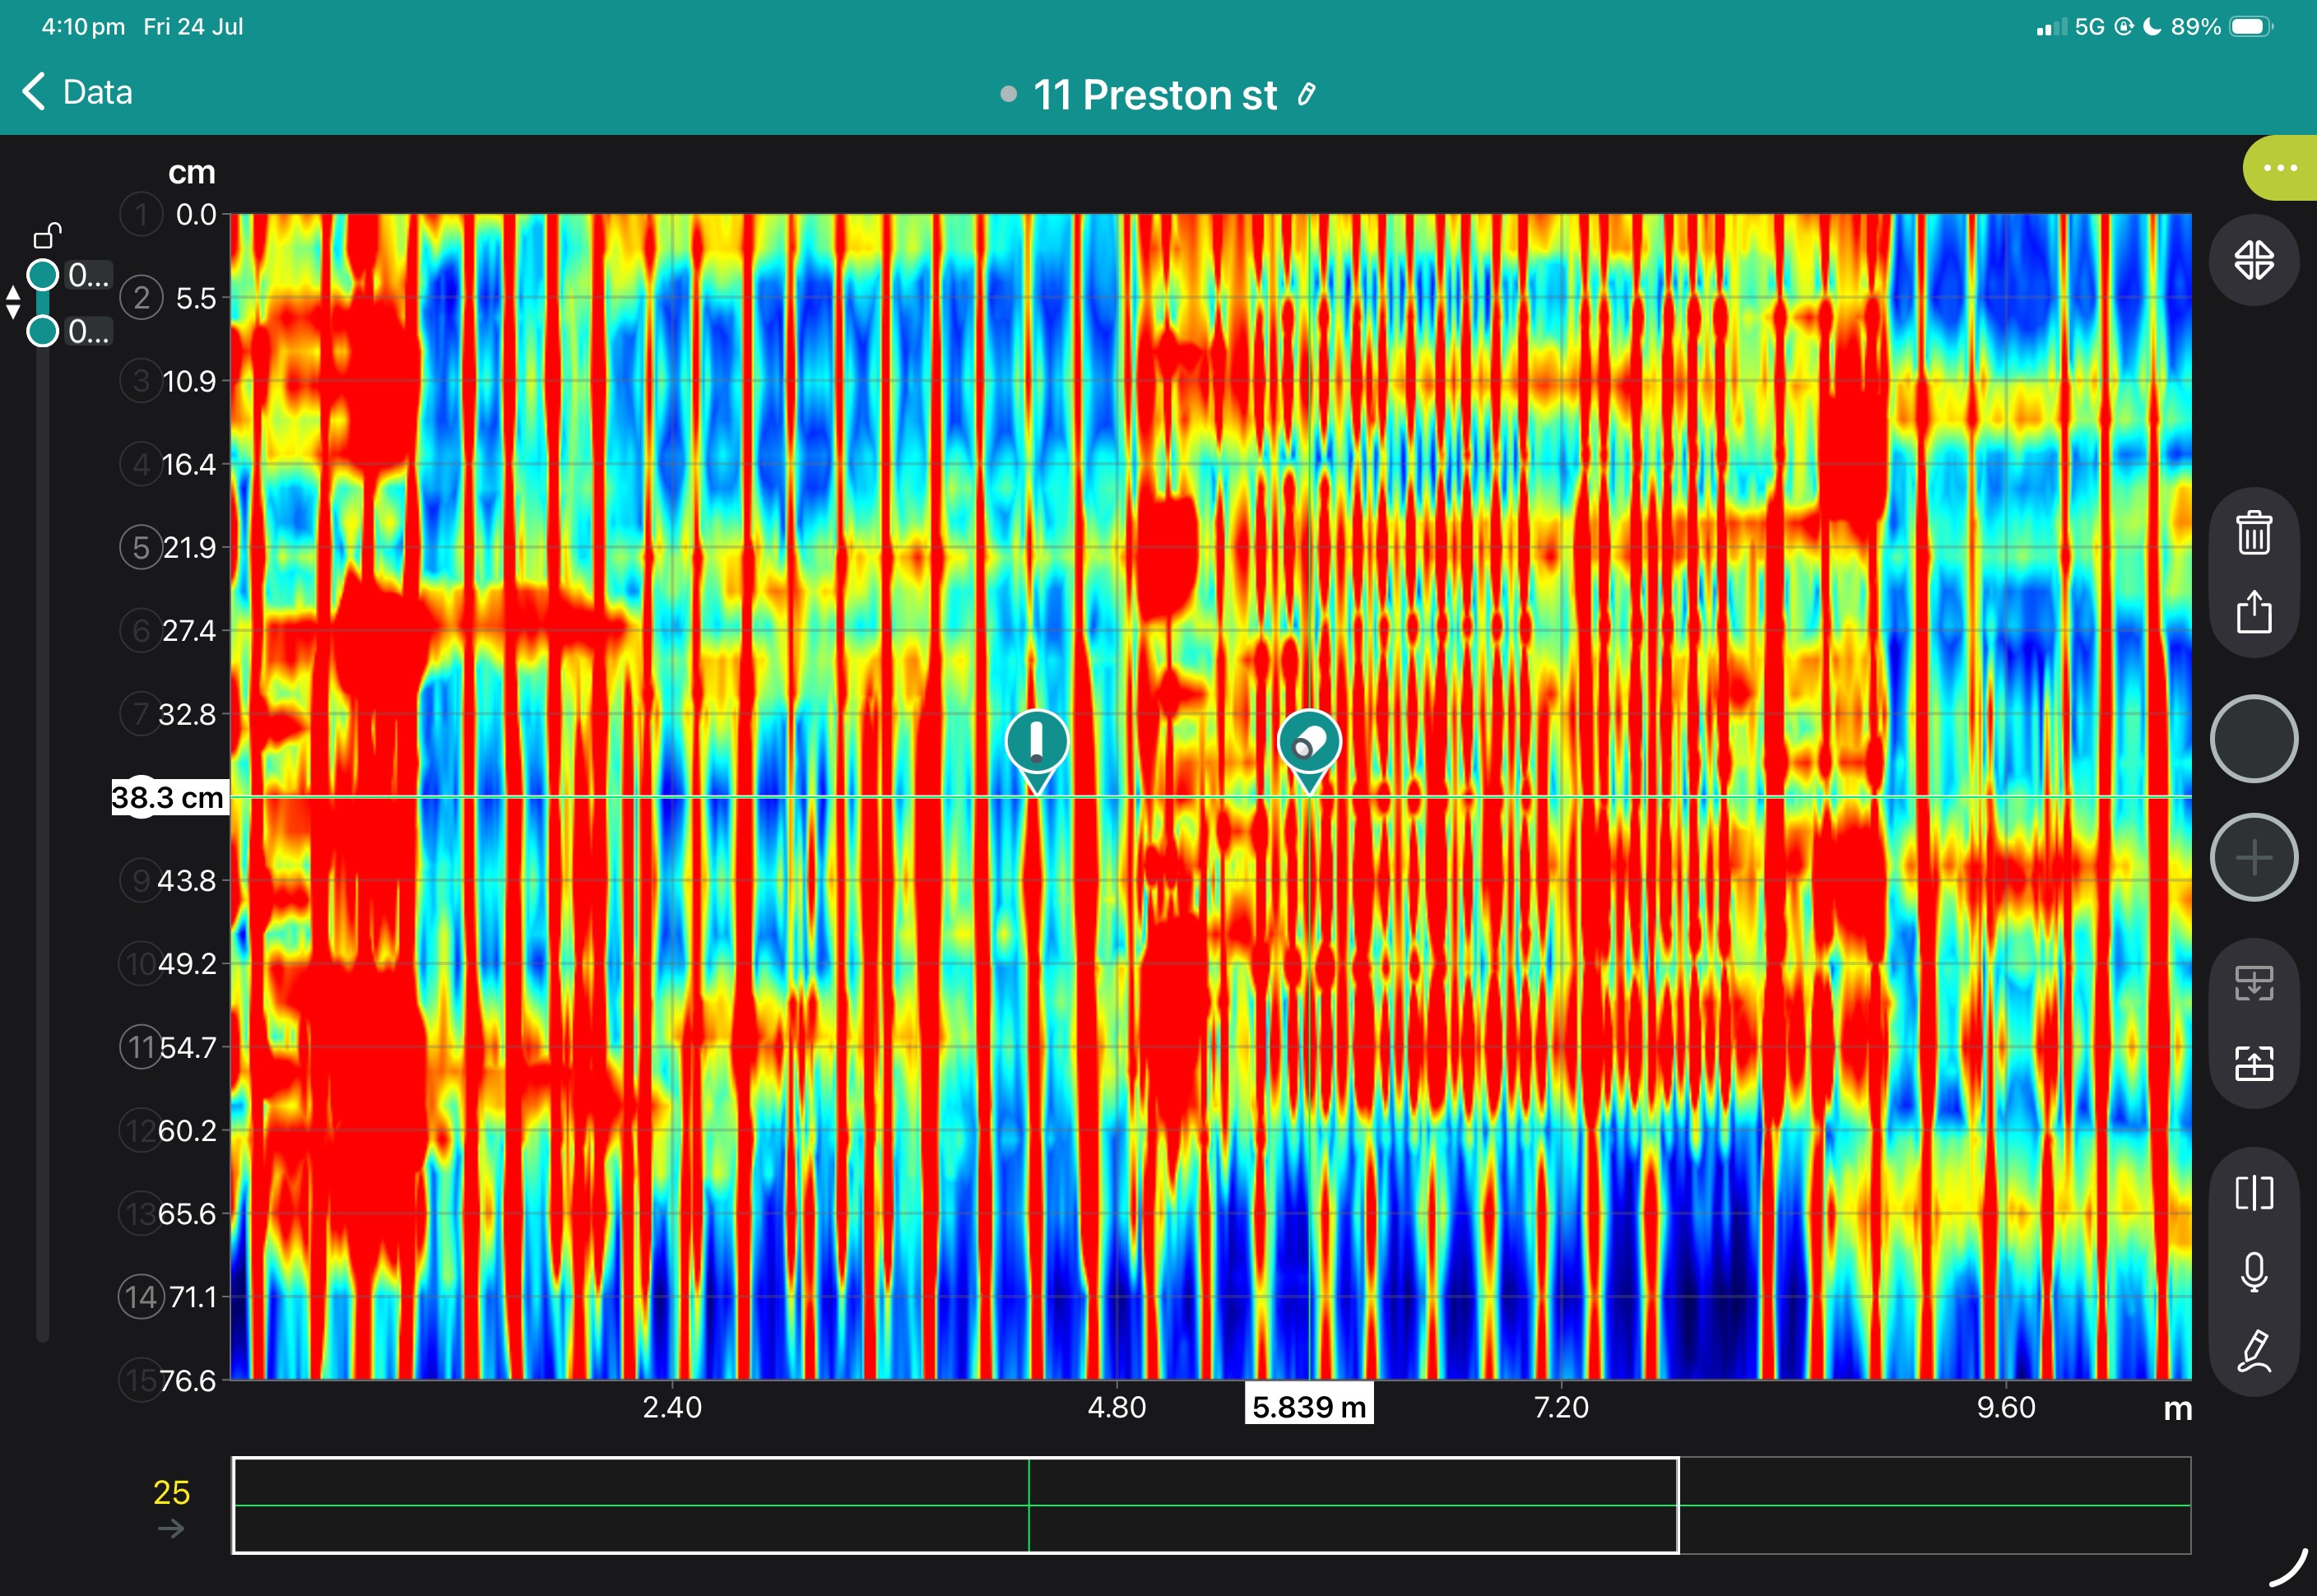
View some of these features at work below, and our case study if you'd like to see more of what the GS9000 can do.




Book a Structural Assessment Demonstration
GS9000 cart with: