%20vector%20logo.svg)

Phone: 02 9453 9999 or Email: sales-operations@pcte.com.au

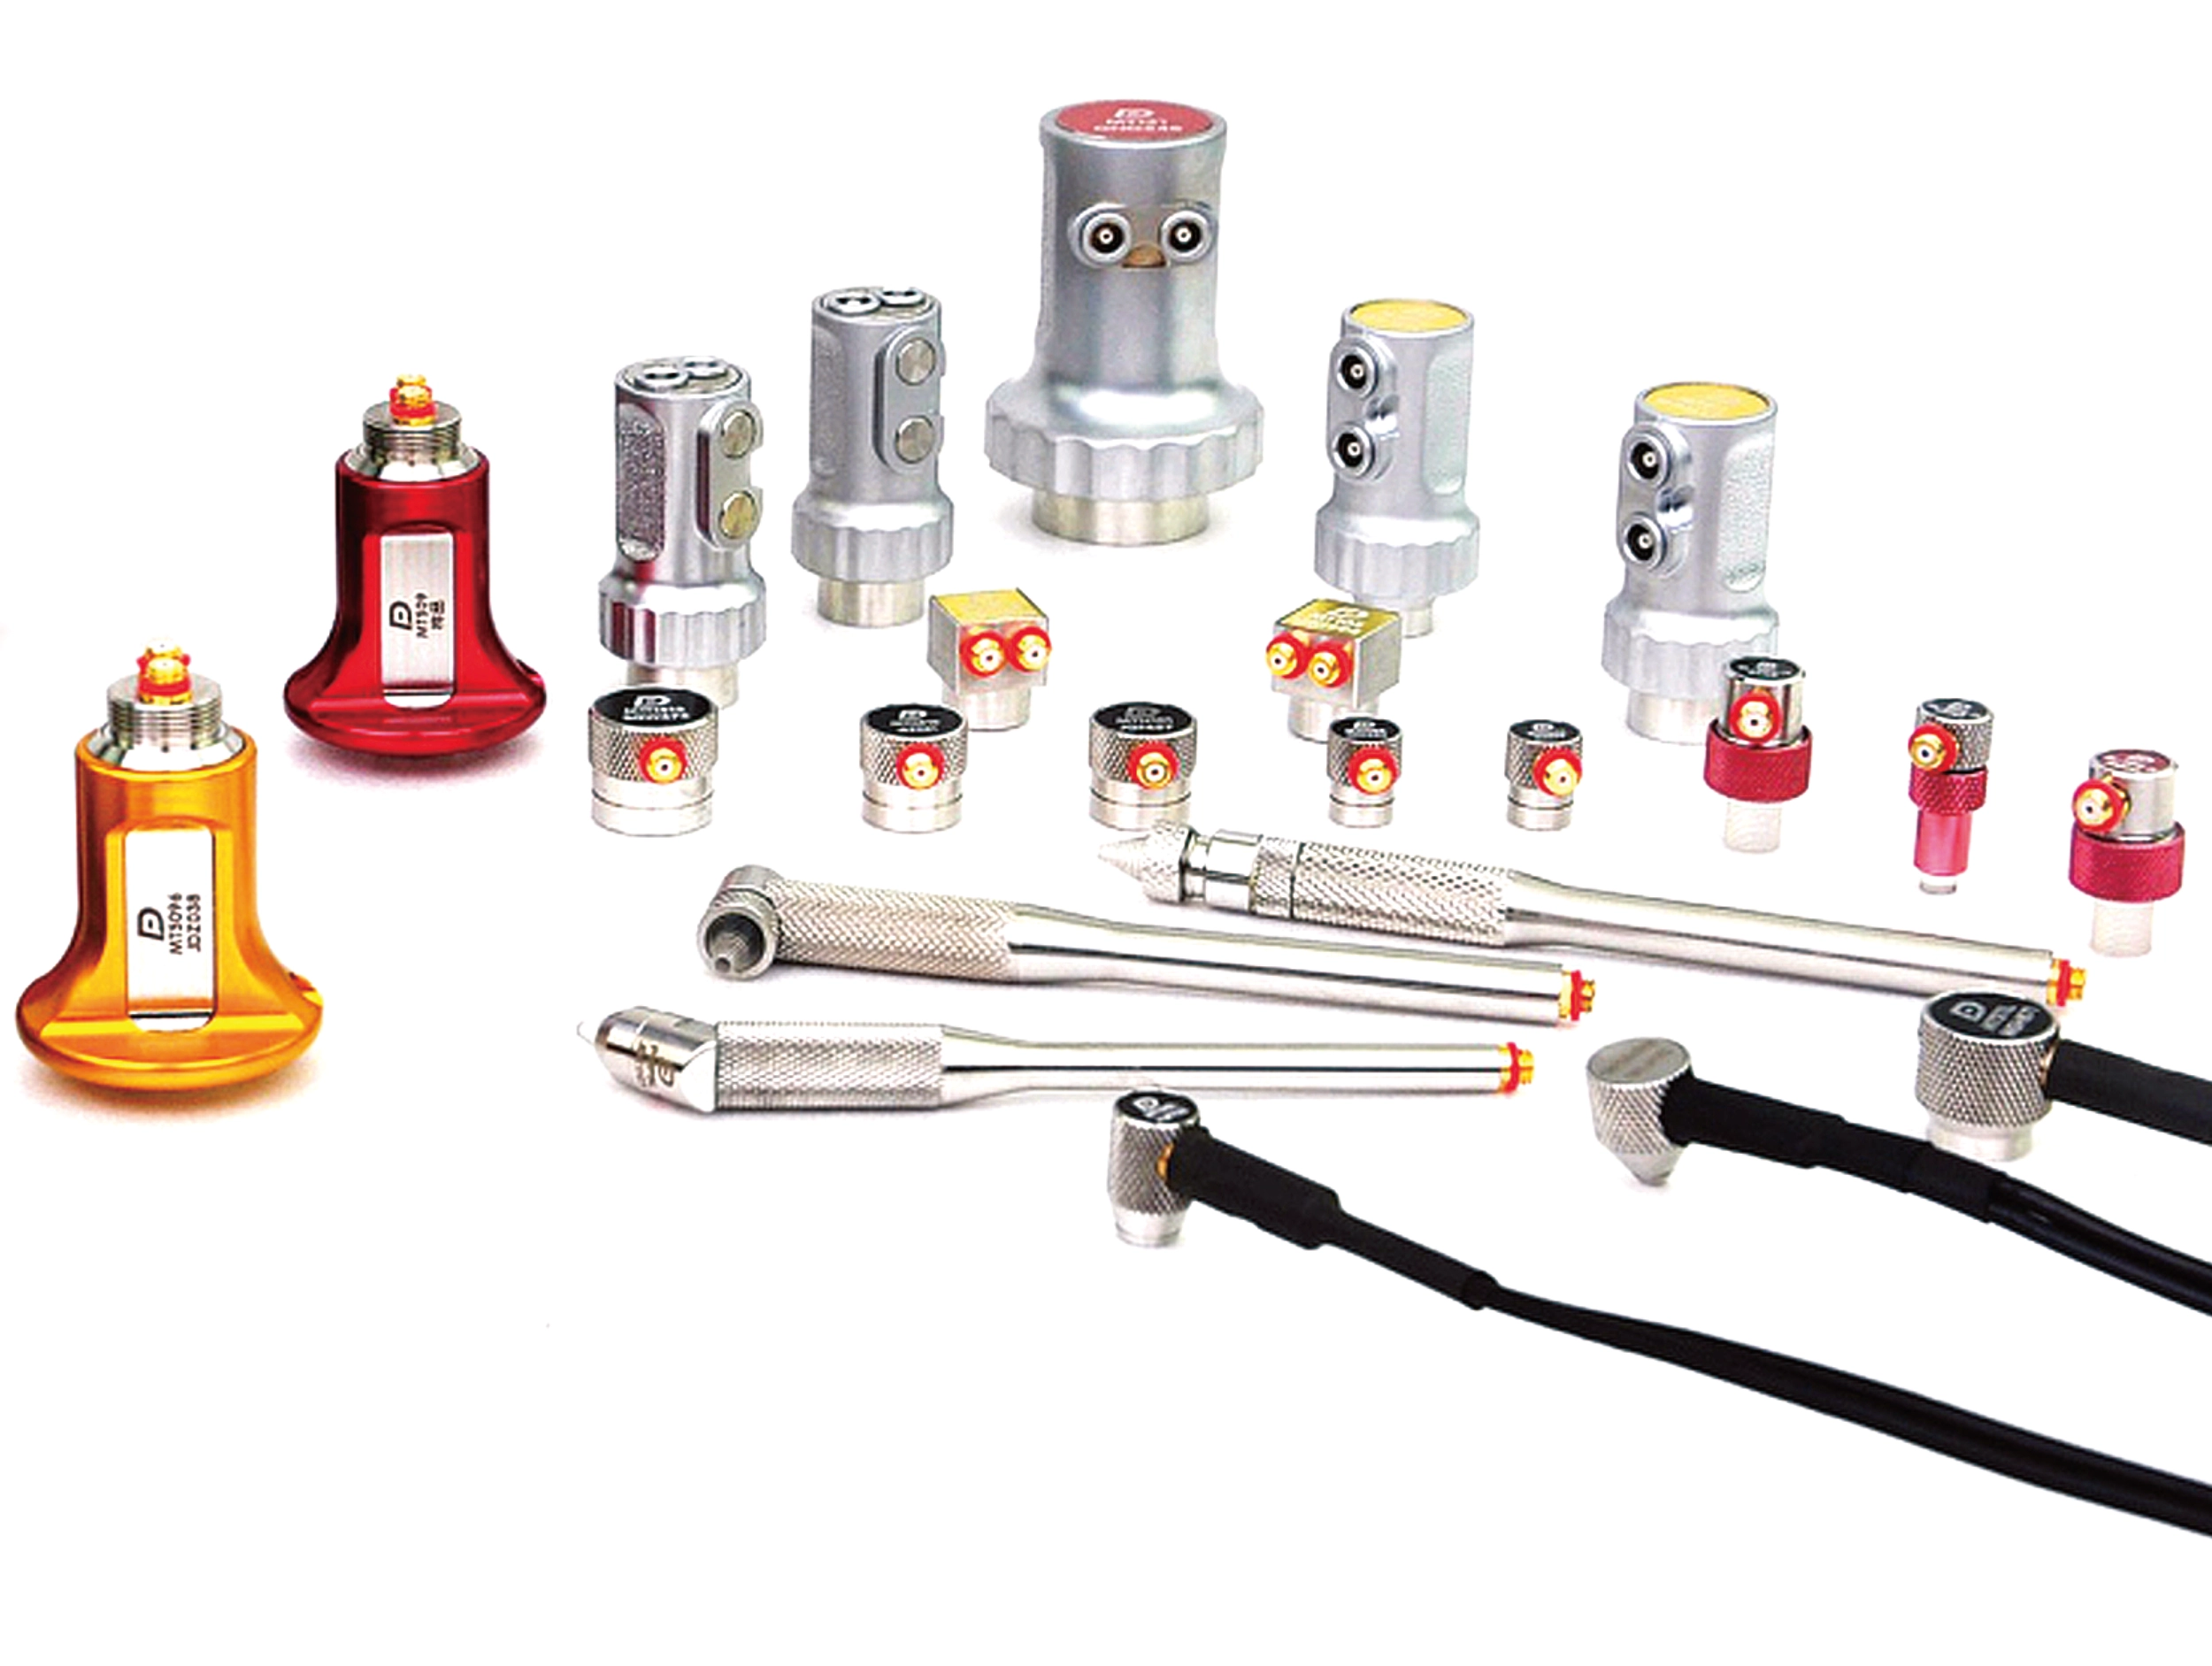
Proceq's UT8000 is a new generation of Ultrasonic Flaw Detector. It places a pulser-receiver module in a portable, lightweight control box, compatible with all standard UT probes.
Overview | GX1 vs GX2 | SUE & Utilities | Structures & Pavements | Software & Outputs | Case Studies | Specifications | Support
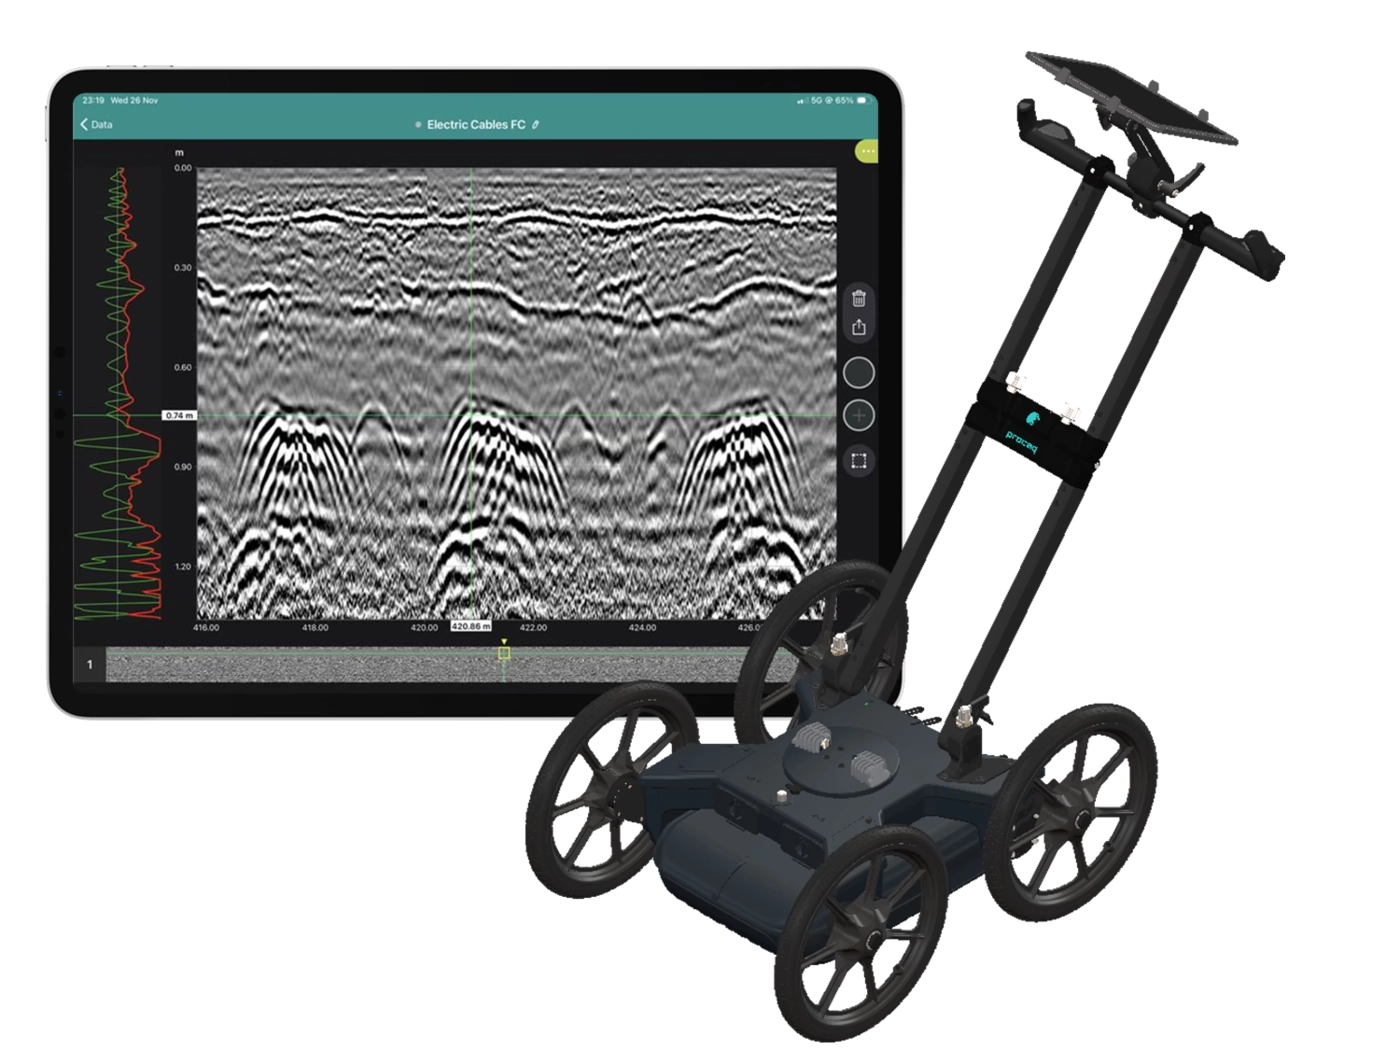
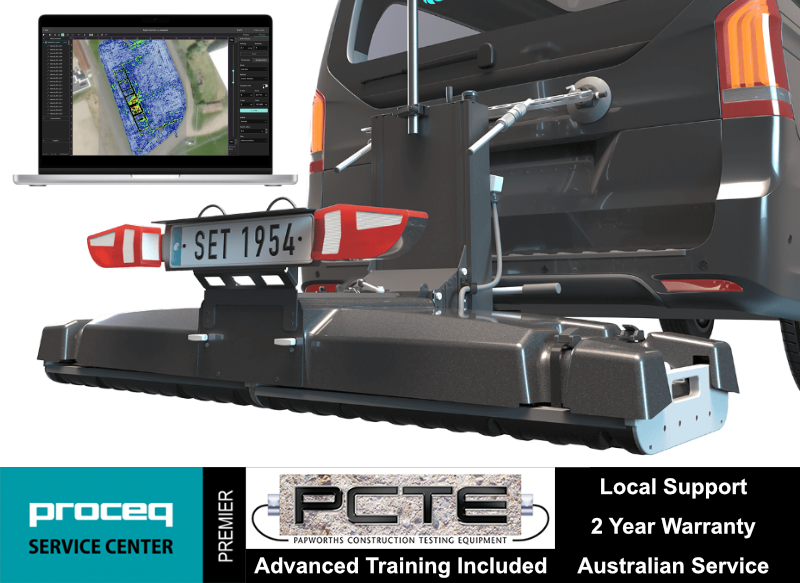
Collect high-density, georeferenced GPR data across wide areas and view the subsurface in 3D as you scan. Choose the GX2 array for SUE and utility mapping, or the GX1 array for structural, bridge and pavement investigations.
Best suited to:
Best suited to:
Recommended array: GX2
Recommended array: GX1
Cover more ground
Collect multiple parallel profiles in one pass instead of uilding a grid line by line.
See results during acquisition
View georeferenced radargrams and time-slice information in the field rather than waiting until the data is returned to the office.
Produce repeatable mapped data
Combine wheel-positioned GPR data with GNSS, project coordinates and survey linework.
Use one platform for two very different applications
Exchange GX1 and GX2 arrays without purchasing two complete cart platforms.
The GX2 transforms the GS9000 into a high-density subsurface utility mapping system. Its 11-channel, low-frequency GPR array captures an 83 cm-wide swath in each pass, helping operators detect and map buried pipes, ducts, cables, voids and other subsurface features. Live georeferenced data lets SUE teams review coverage on site and produce accurate CAD, GIS and project-coordinate deliverables.
1. Plan the survey
Load satellite imagery, CAD information, project coordinates or survey control.
2. Collect dense multichannel data
Survey an approximately 0.82 m-wide swath with 11 channels in each pass.
3. Review data live
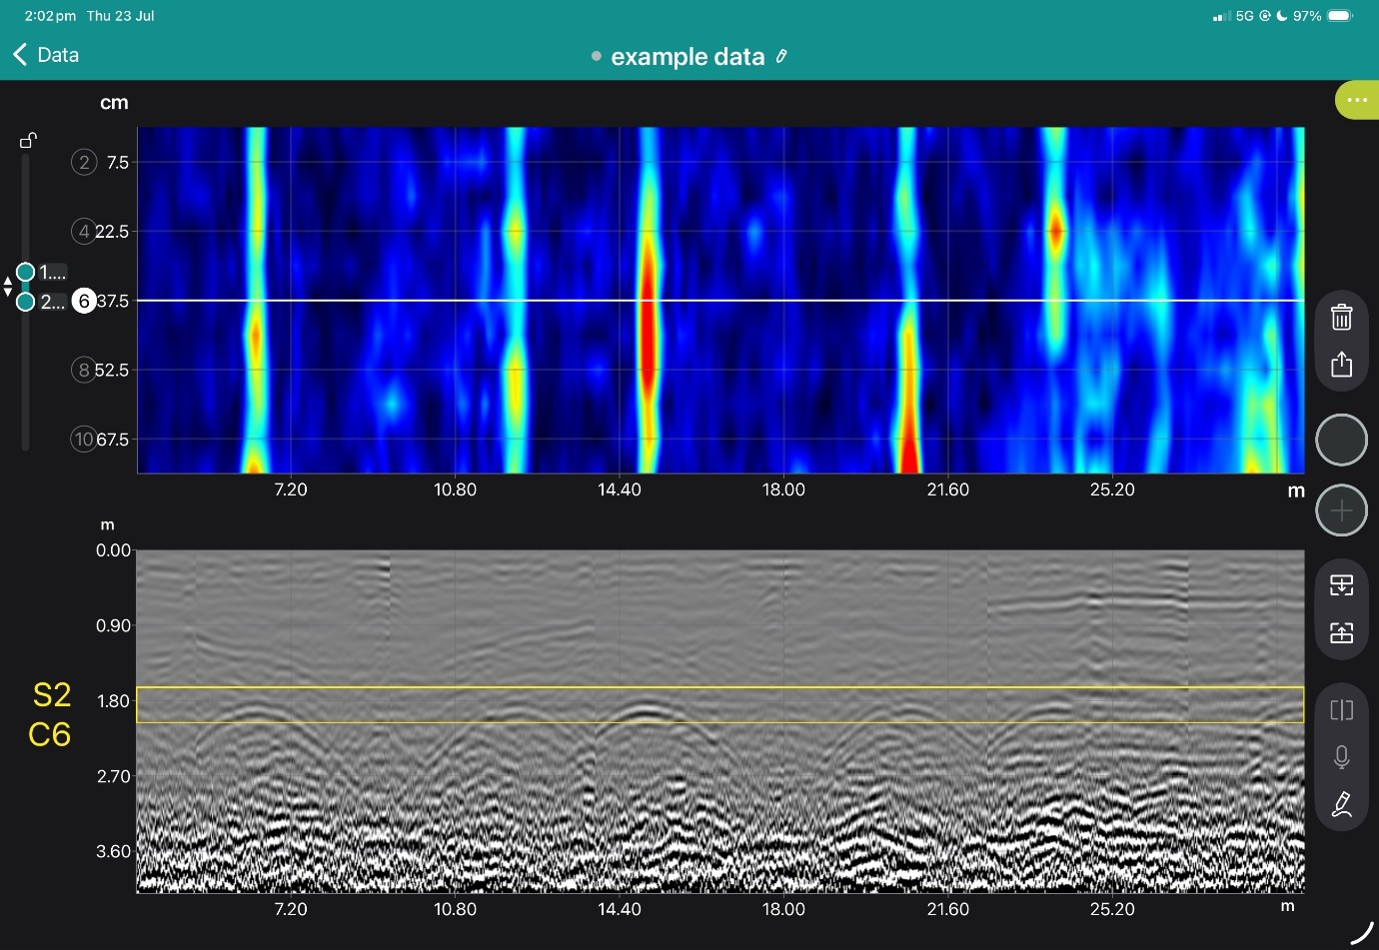
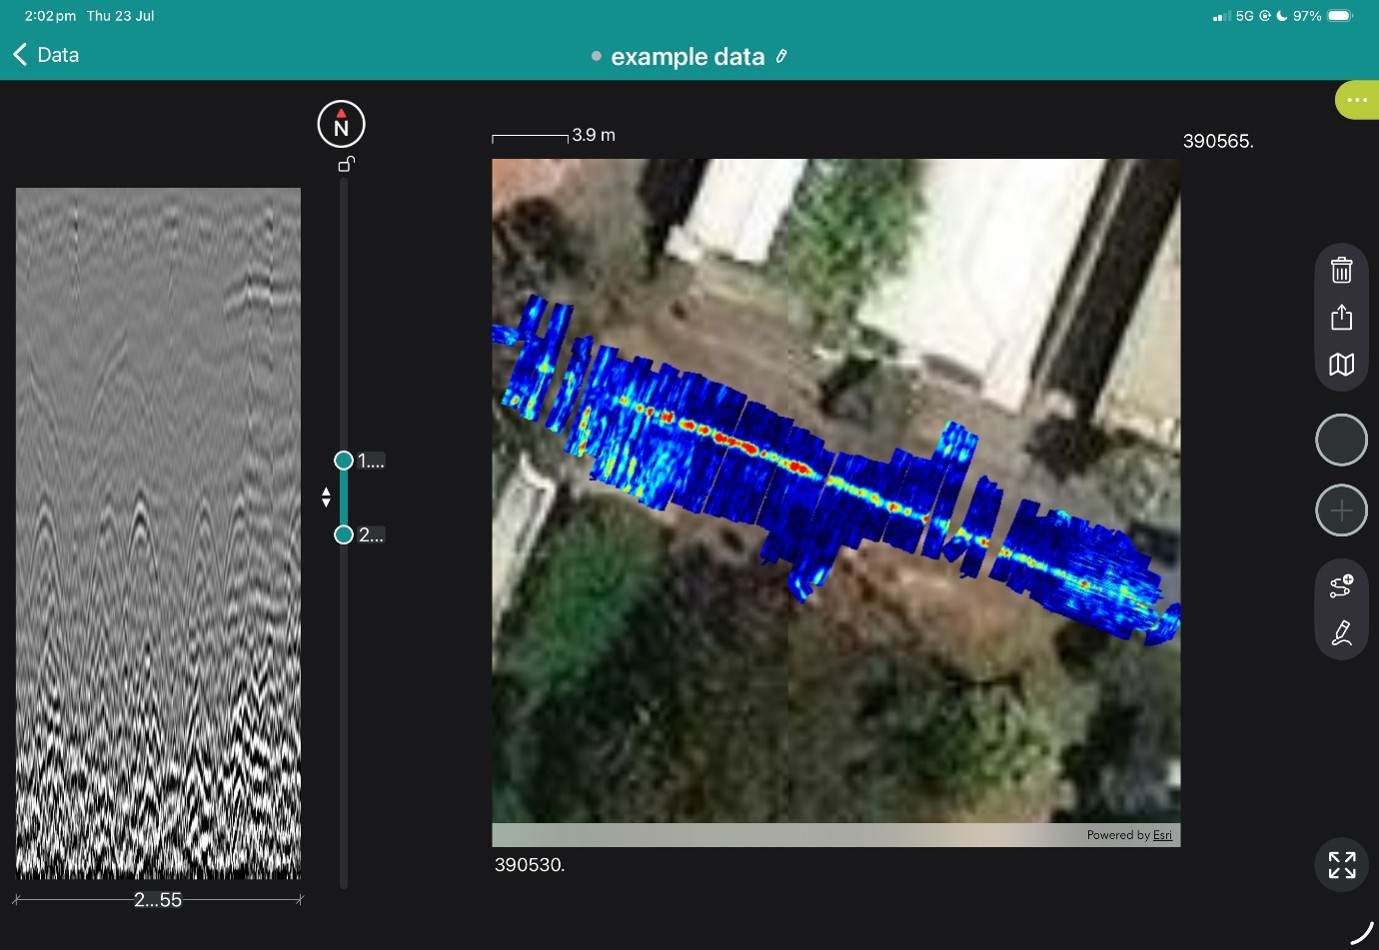
Examine radargrams, georeferenced time slices and marked features while still on site.
4. Interpret and digitise
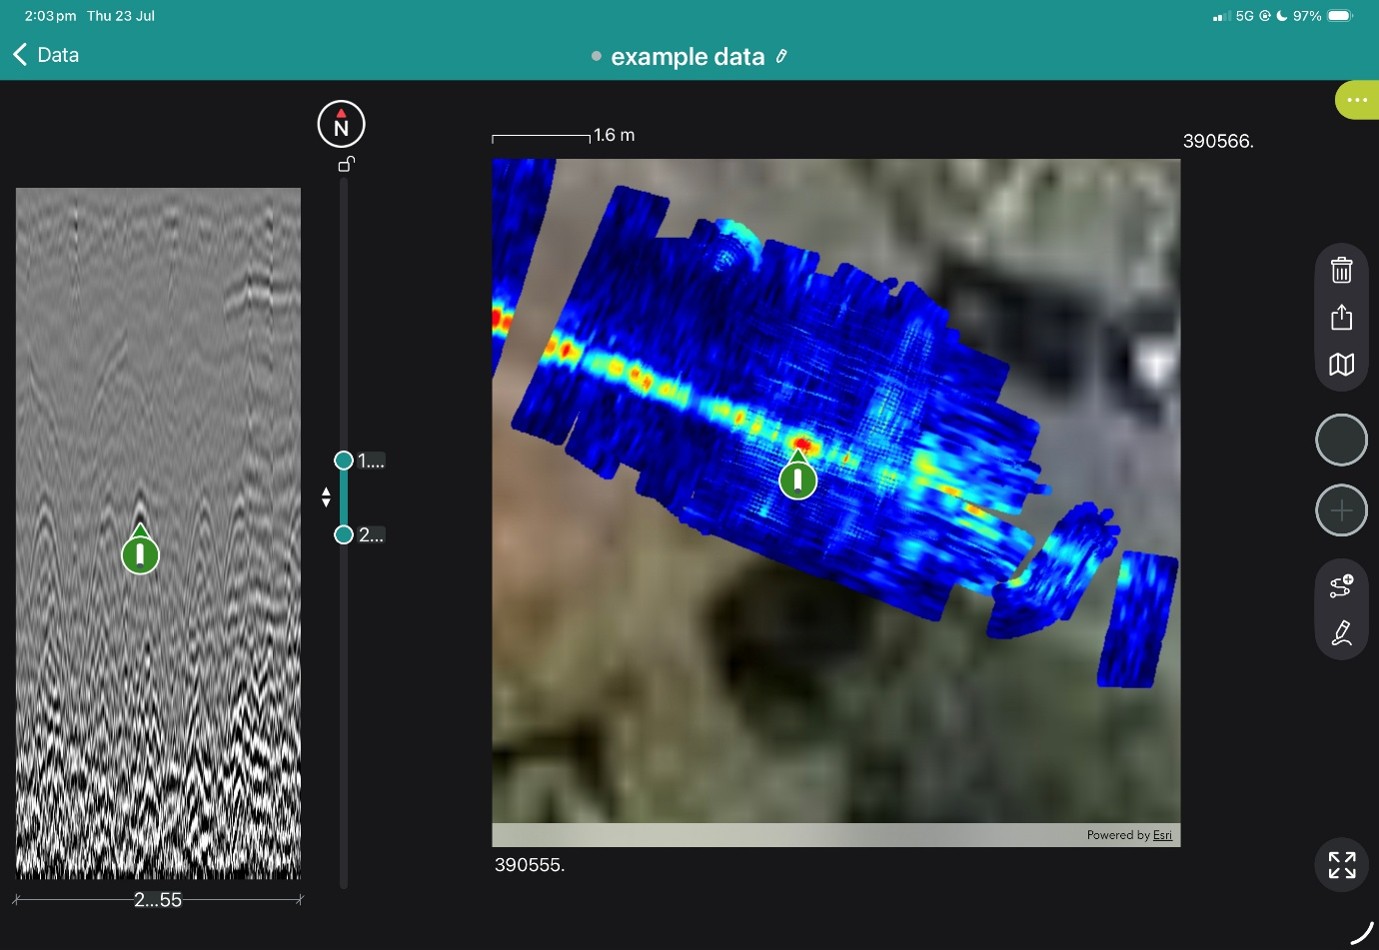
Add points, linework, tags, photographs and field observations.
5. Process and deliver
Merge survey areas, apply processing and export mapped information for the customer’s CAD, GIS or reporting workflow.
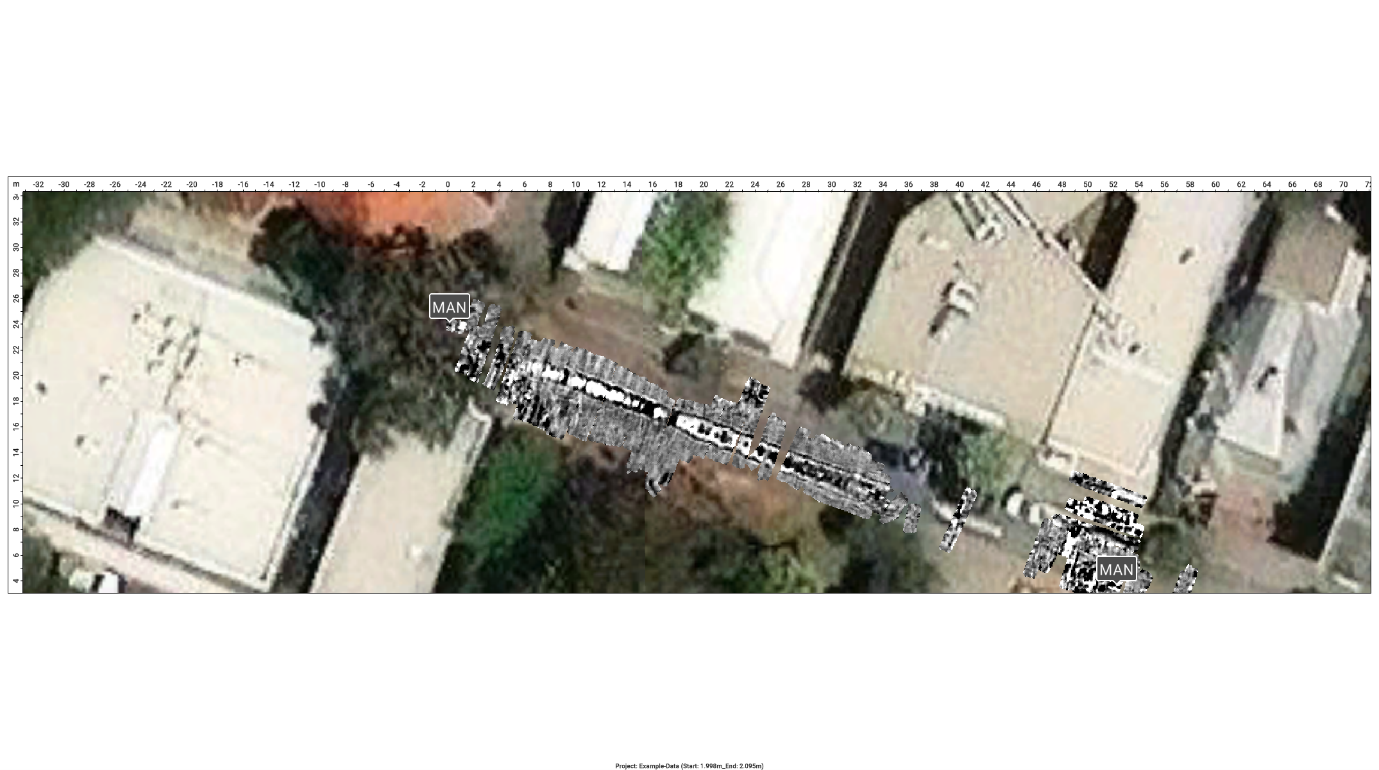
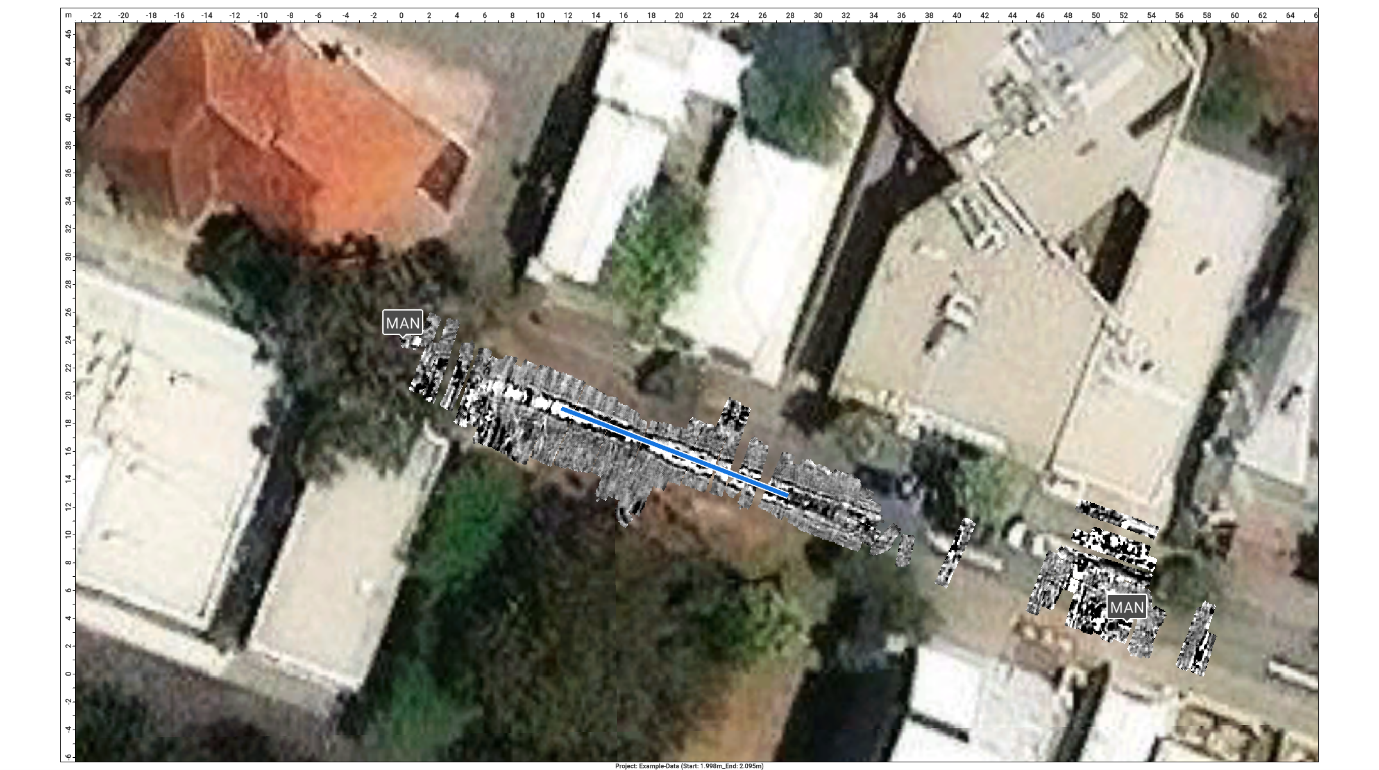
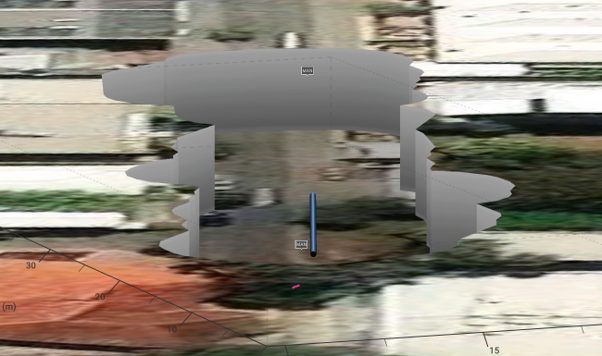
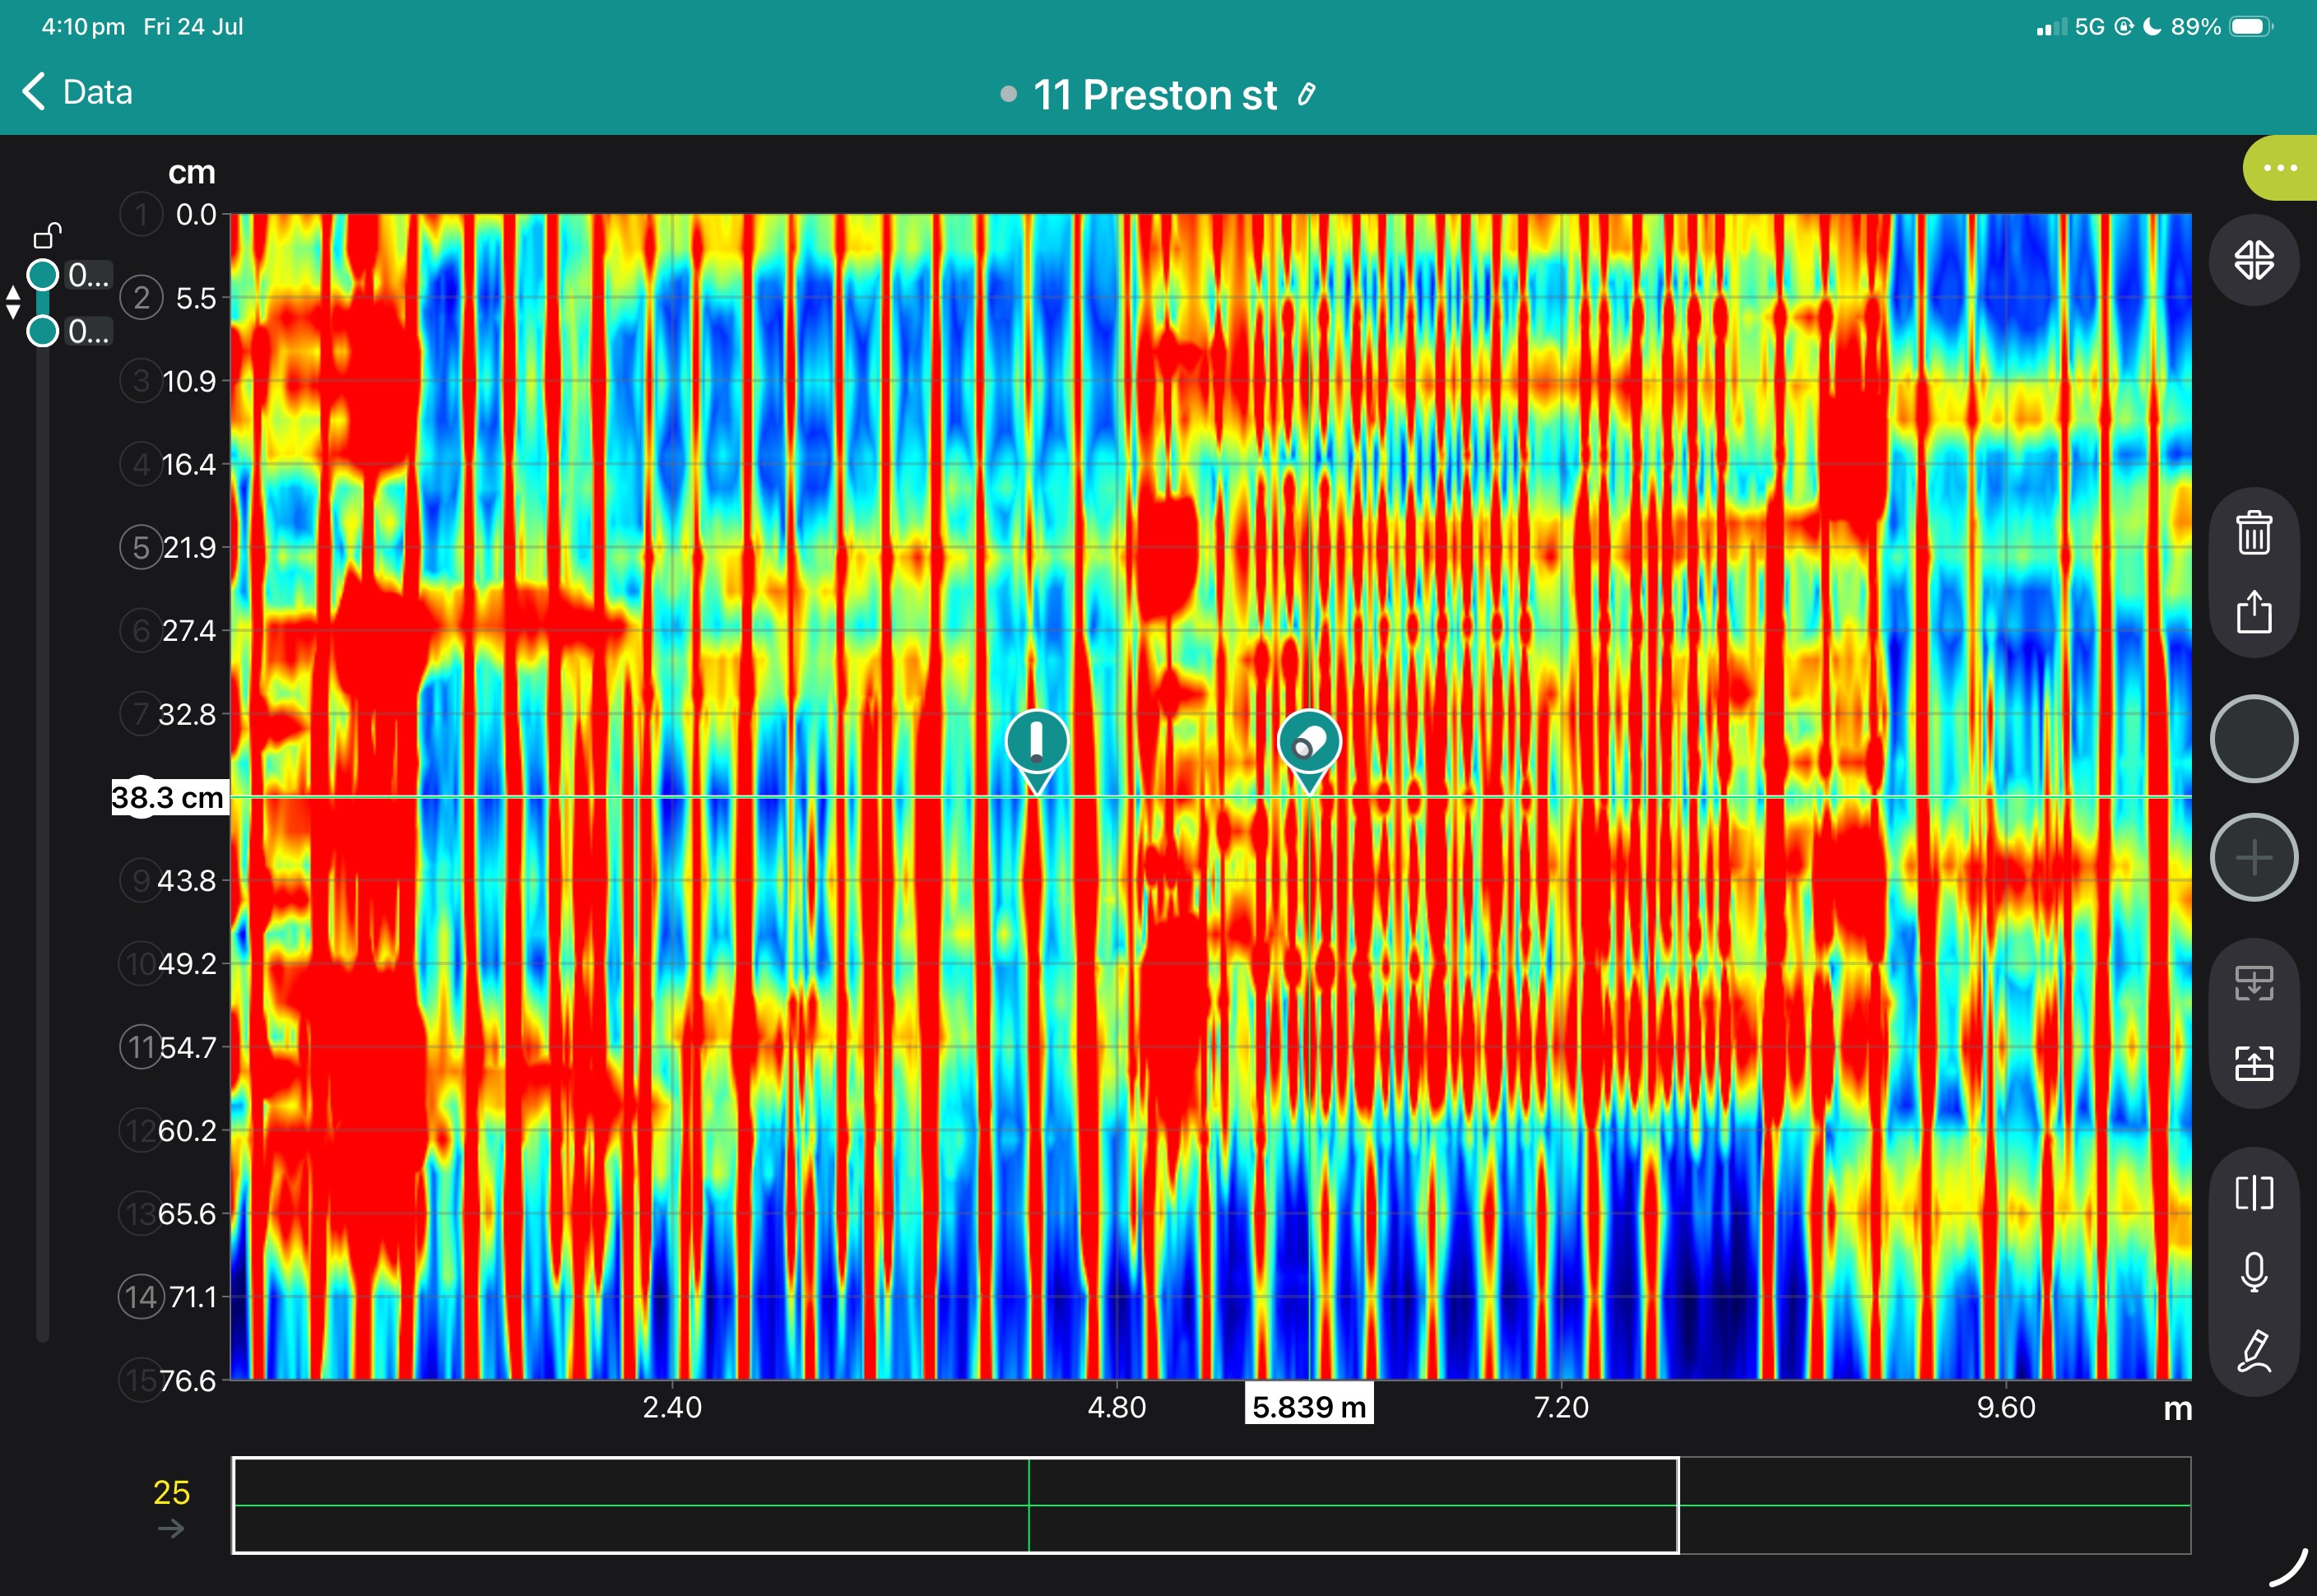
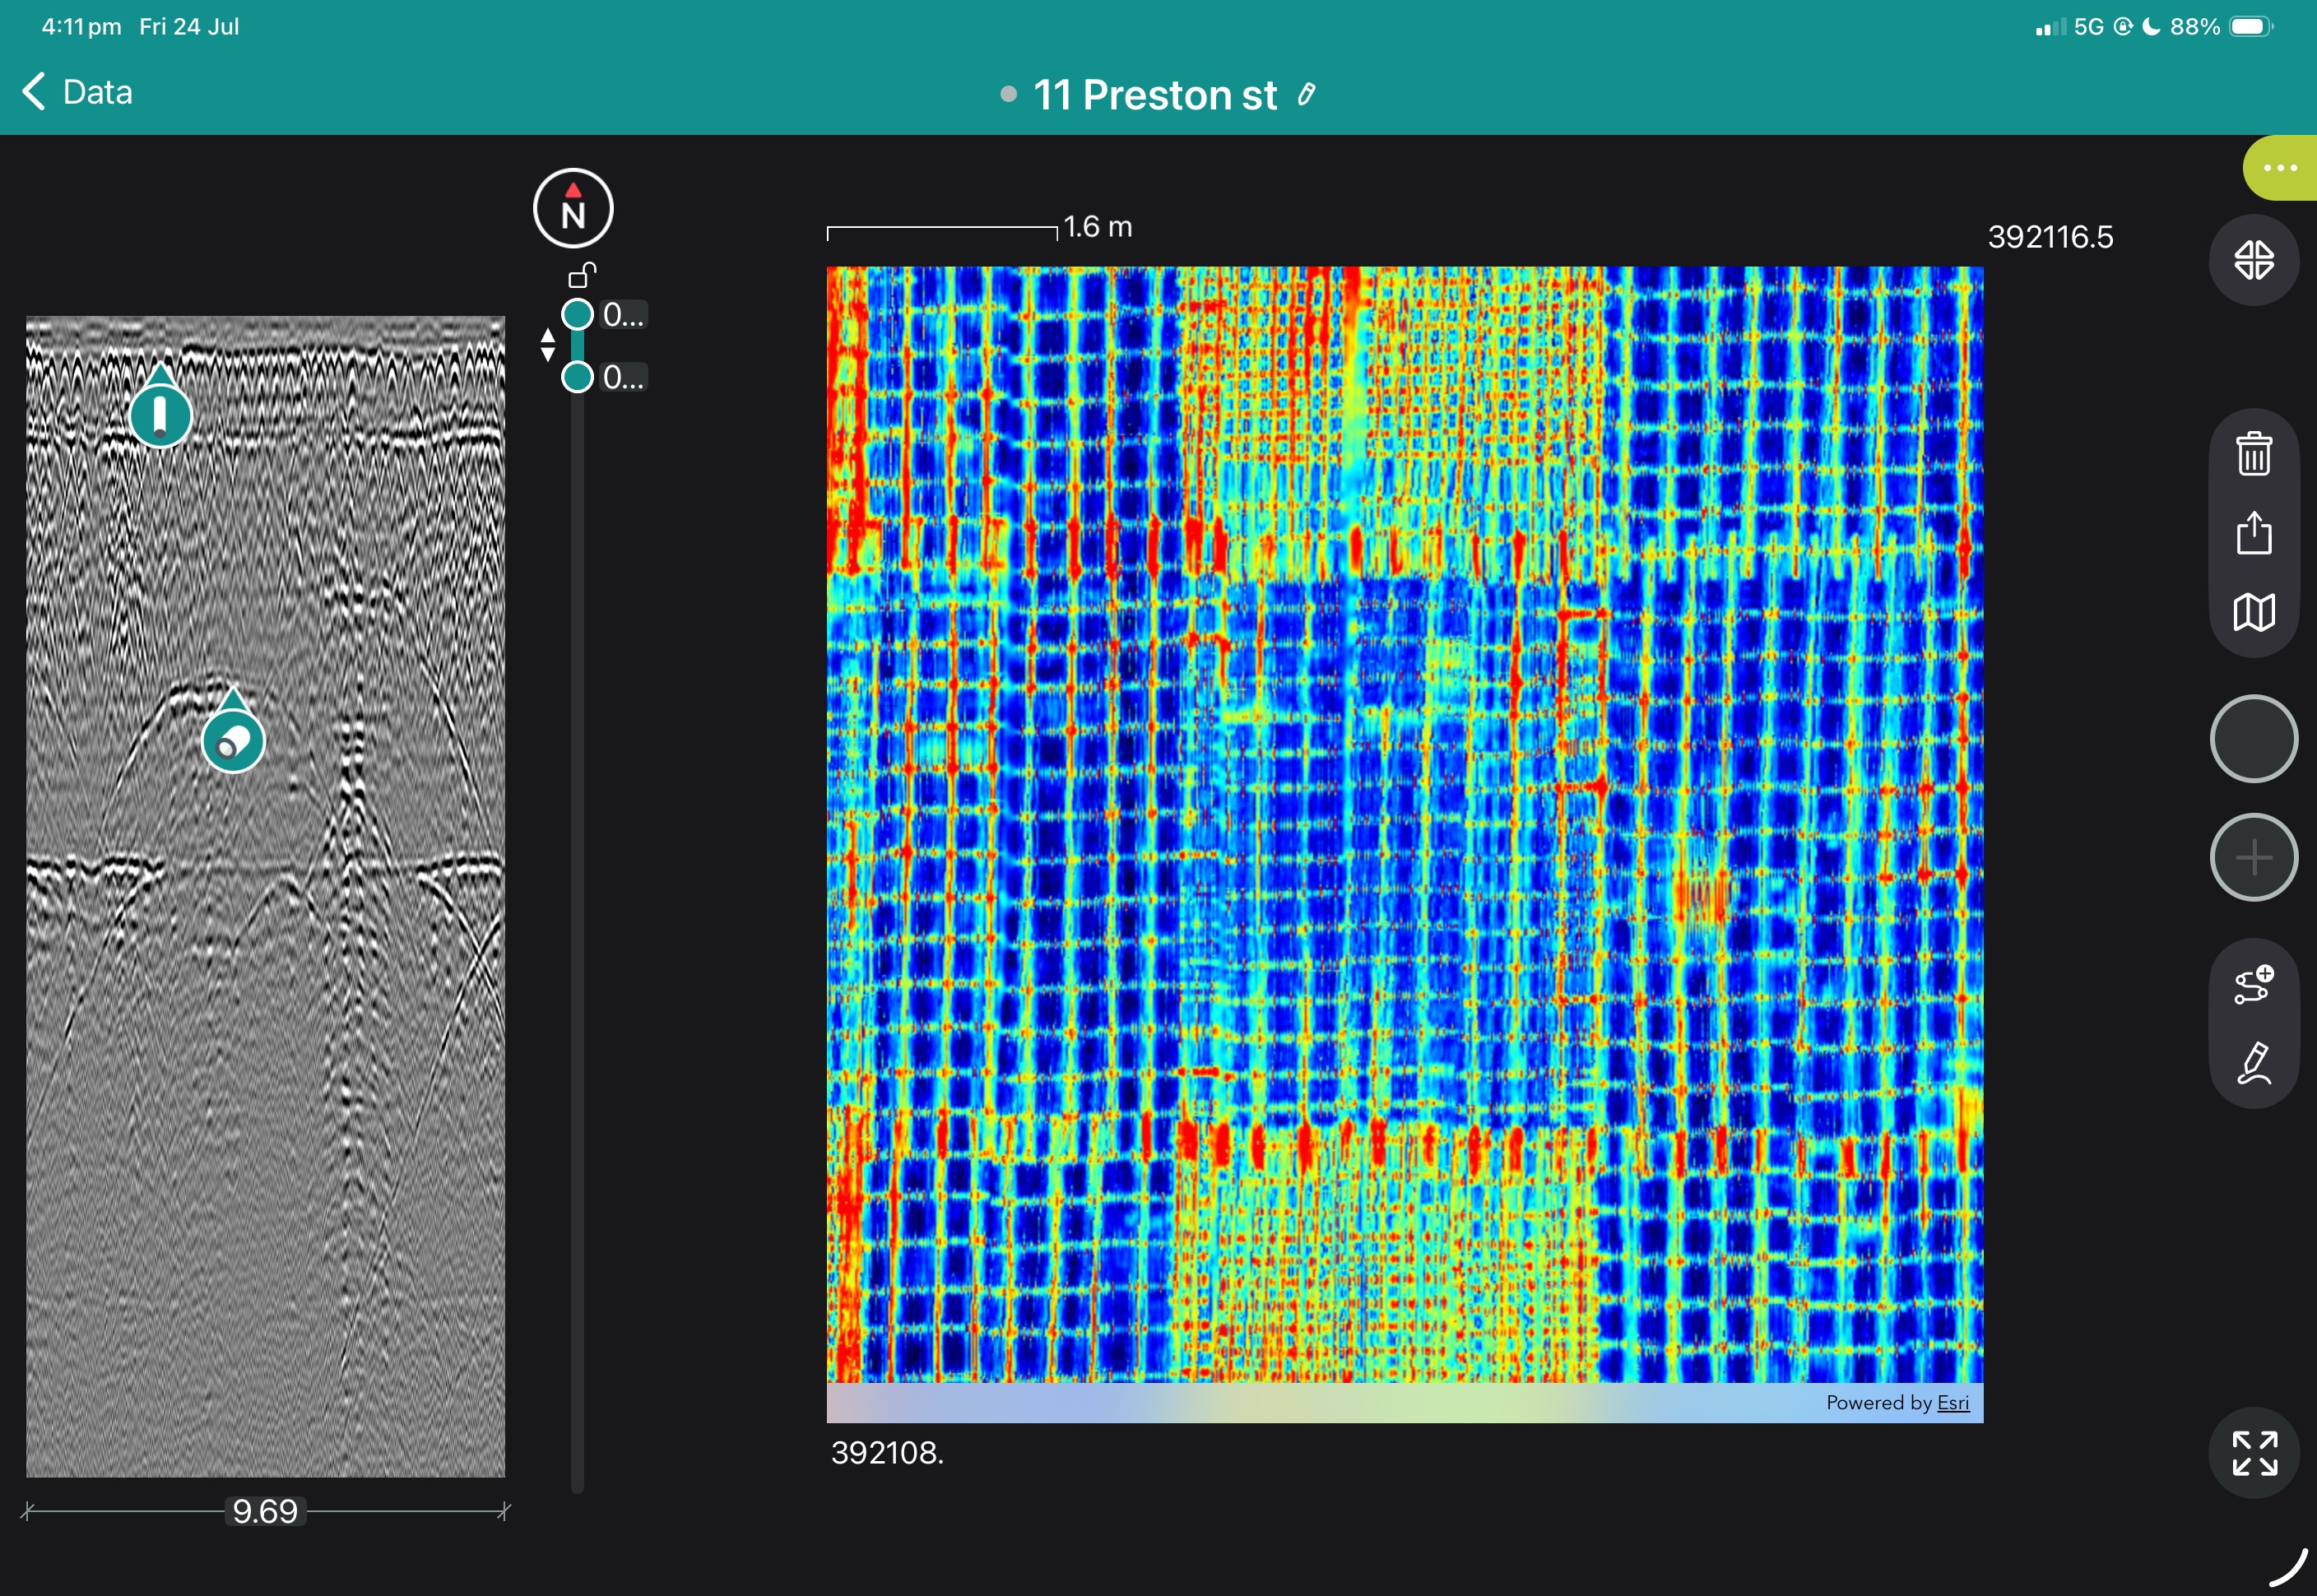
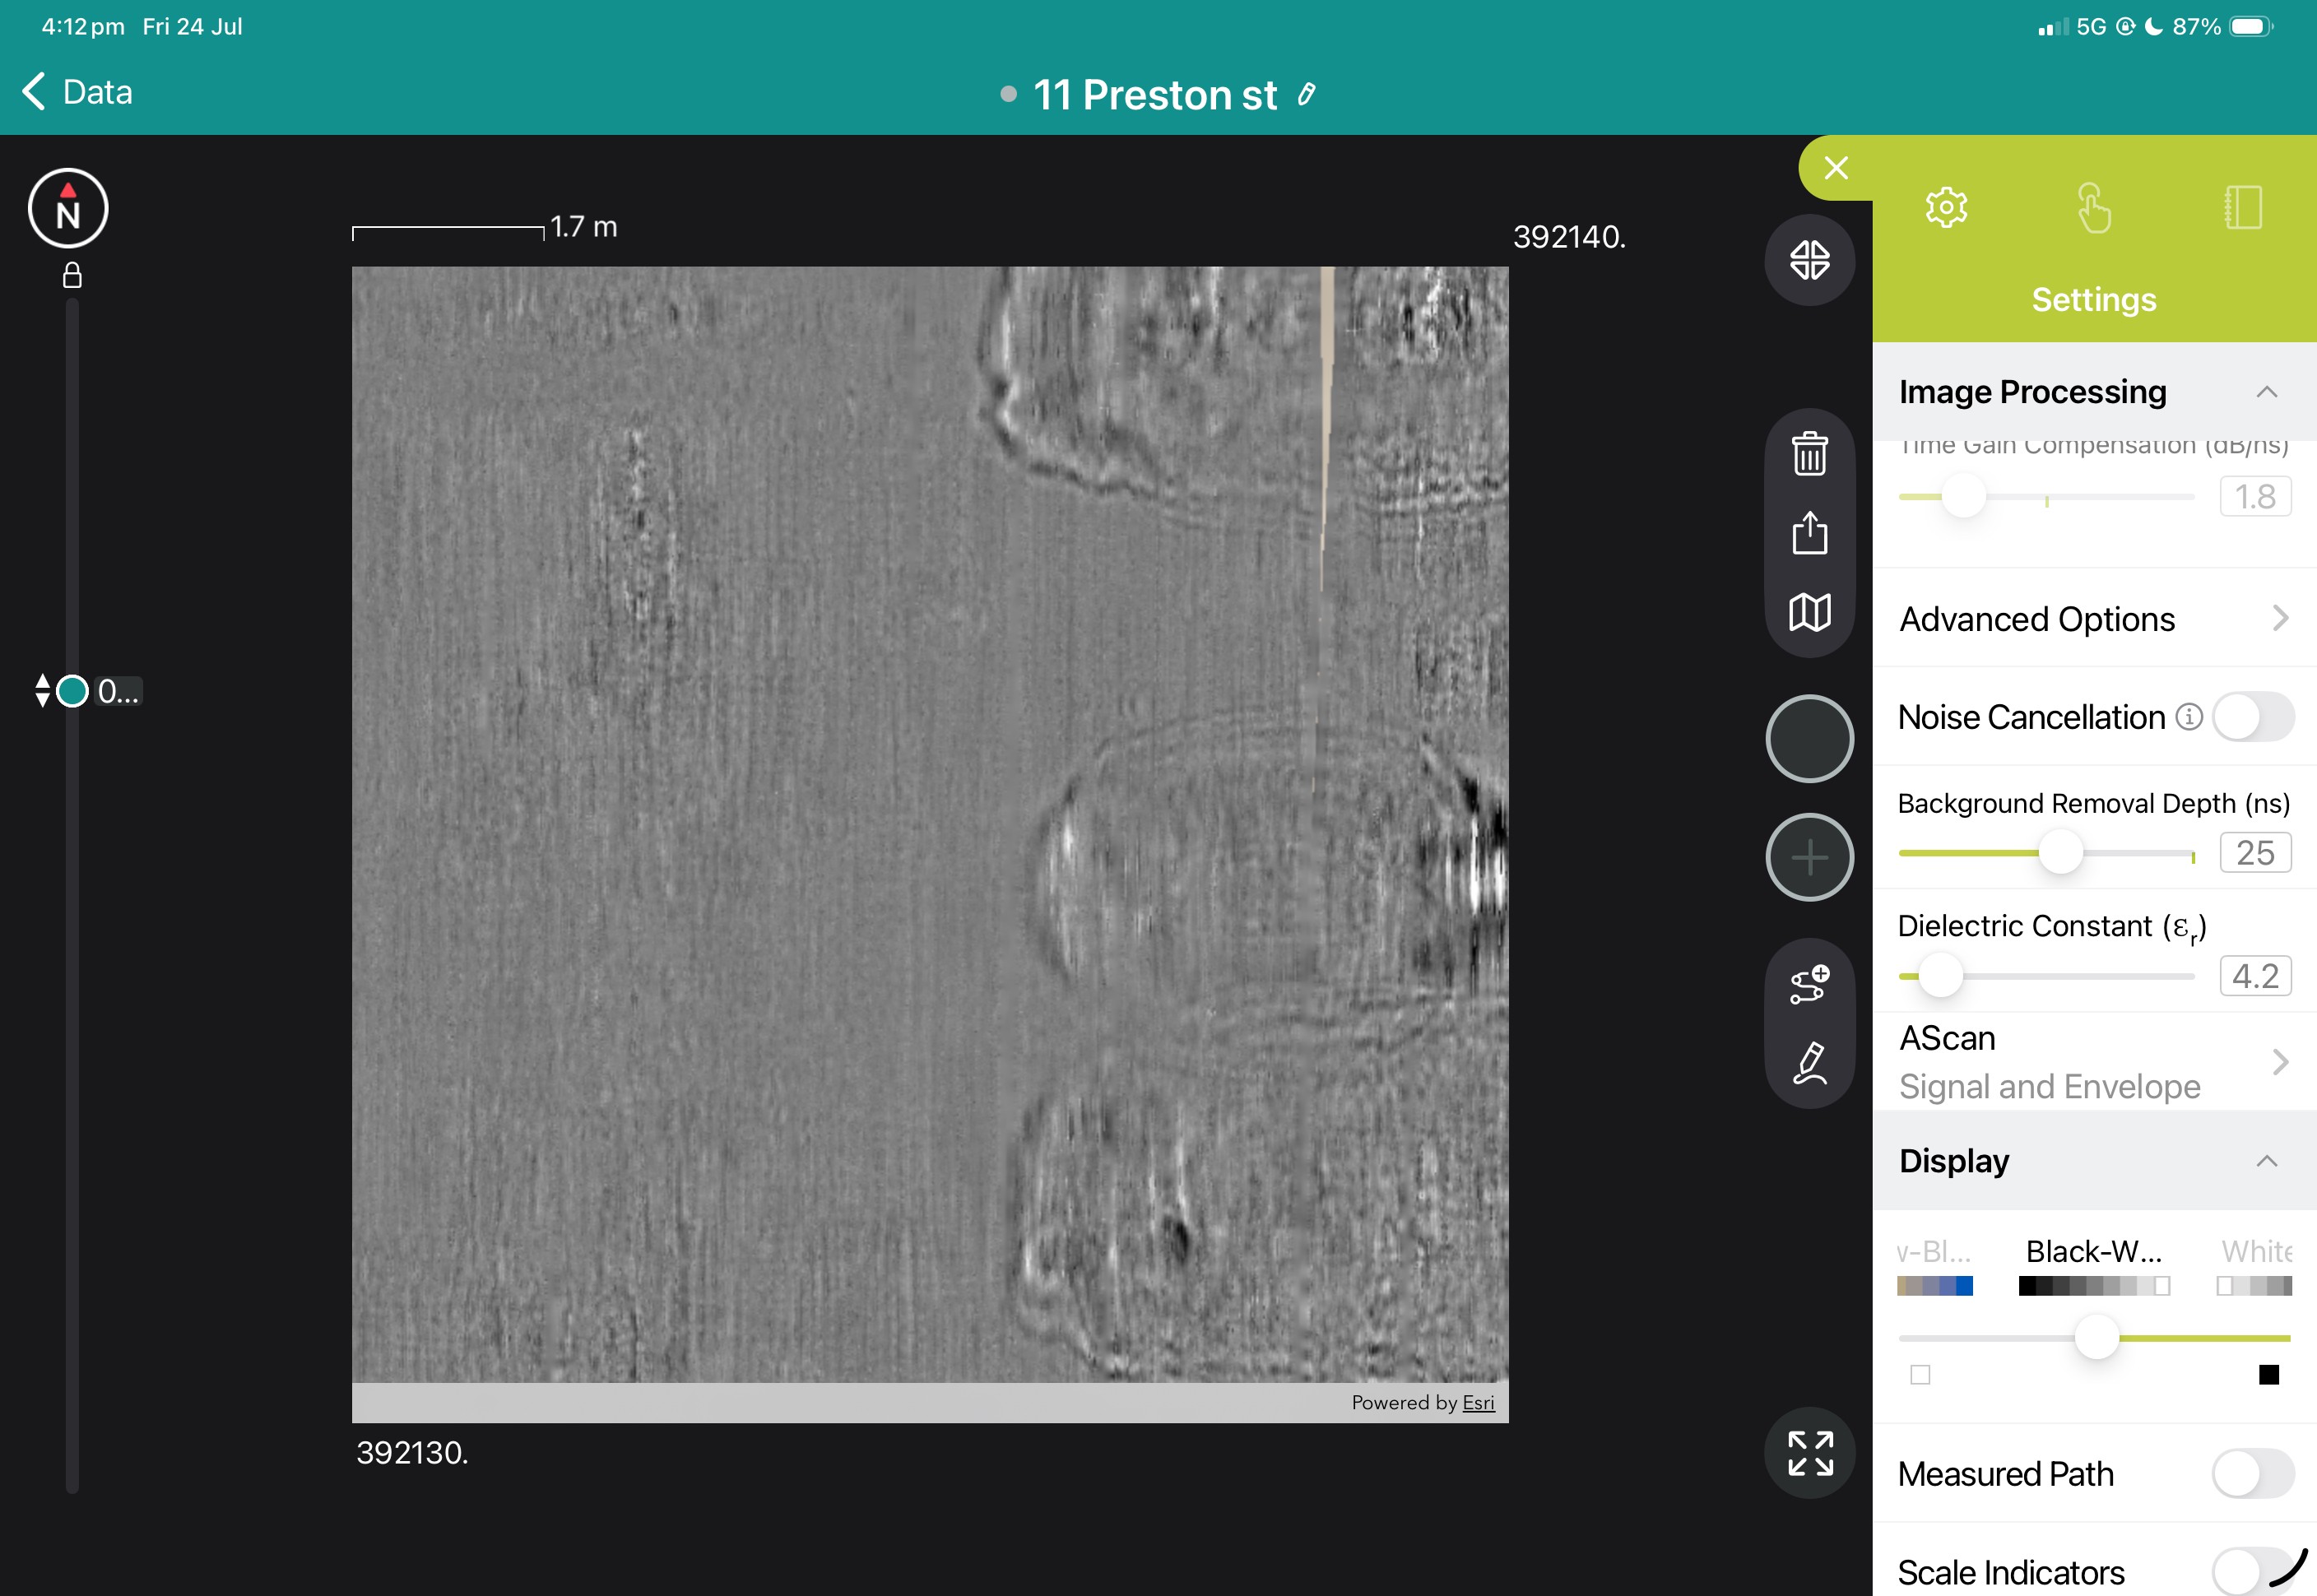
View the images below to see these in action.

The pulser-receiver unit has two distinct pieces, the battery pack and the pulser-receiver. Without the battery pack the pulser-receiver is light enough to mount on most standard drones. The unit is IP67 rated and Mil-STD drop tested.
Comes with a quick switch bayonet style removable battery pack of 6x rechargeable AA batteries.
Users can choose from the full range of Apple iPad devices. With Apple’s high quality screen technology users have the best screen available on any UT set:
With the right combination of apps the technician will be able to issue reports directly from the iPad. Not only is the UT8000 compact, but the iPad can eliminate the need to carry laptops, paper standards, a camera and paper notepads. The UT8000 and and iPad can easily be carry on luggage, eliminating any stress from equipment transport while still allowing the technician to have everything they need with them.
Like other equipment in Proceq’s Live Range the UT8000 can be connected via WiFi. UT8000 can also be connected via cable for scanning with undetectable latency if required.
Being part of Proceq’s live family the UT8000 can be connected to the cloud, allowing easy sharing of report information inside or outside a company and even the possibility of another technician dialing into the iPad and assisting with interpretation remotely.
Commonly used functions are tied to gestures. Some examples are:
The user interface is one of the main selling points. New technicians and old will find the learning curve very simple and operation intuitive.
The User Interface makes set-up for flaw detection straightforward, Proceq has added tools to assist with reporting and recording.
A flaw table is used to record information regarding the reportable flaws detected. This integrates with the logbook functionality and includes the time rewind information. When the technician exports the logbook not only does it include the metadata like serial numbers, settings, location etc, it also includes all information input into the flaw table. Including the time rewind.

Time rewind is a very useful tool. The way a flaw behaves on screen when scanning in a certain direction (transverse, raster, lateral & orbital) is a large part of the classification of the flaw. This behaviour is what referred to as the echo dynamics and a single photo rarely captures this. With the rewind function the technician has the ability to press record and the set will recall a few seconds prior and up to the time the technician stops. This means that the technician can capture the full echo dynamics and include that as justification for their interpretation. This item is unique to the UT8000.
The UT8000 has a flexible grid function. This is very important for closed or open grid corrosion surveys. Before the UT8000 sequential data logging required technicians to plan out the grid and work along step by step. Now the user can define a grid size, its resolution and take a survey as they see fit. If there is a part of the grid they want to correct, they just tap and re-take the reading.
The UT8000 has huge potential for streamlining the UT workflow and making everything more traceable. One of the biggest weaknesses of standard UT work is its traceability and the UT8000 addresses that. The logbook records metadata, notes and photographs of test positions and all changes made during the inspection. When the Technician exports this logbook, its is a full snapshot of the inspection, from start to finish. There can be as little or as much detail in this as a company’s internal procedures call for.
With the right workflow, a company can capture every single piece of information that they require to issue a report.
UT technicians can set up their own accounts, keeping backed up record of their unique settings and inspection logs. Another technician can use the same iPad and log in with their account and switch to their settings.
When it comes to the increasing difficulty of record keeping with certification, The UT8000 accounts records serve as a log for the time a technician has spent doing UT.
A spare battery pack with 6 rechargeable batteries.
Book a SUE Workflow Demonstration
The GX1 transforms the GS9000 into a high-resolution structural assessment system for concrete slabs, bridge decks and pavements. Its dense, dual-polarisation array captures detailed 3D data across wide areas, supporting reinforcement and cover mapping, moisture and deterioration assessment, and analysis of asphalt and pavement layers. Live visualisation helps confirm survey coverage on site, while post-processing tools produce clear, report-ready condition maps.
1. Define the inspection area
Import the structure, bridge, pavement or survey background.
2. Collect closely spaced profiles
Capture 35 longitudinal and 15 cross-polarised channels with dense spacing.
3. Review coverage in the field
Use live radargrams and time slices to confirm that the required area has been captured.
4. Process the dataset
Apply velocity, gain, background removal, migration, filtering and topographic correction as appropriate.
5. Generate diagnostic maps
Create depth slices, reinforcement maps, layer information or application-specific condition maps.
6. Integrate with the engineering assessment
Export figures, mapped anomalies and raw data for inclusion in the engineer’s final interpretation and report.
Field information
Processed Diagnostic Information
Engineering deliverables
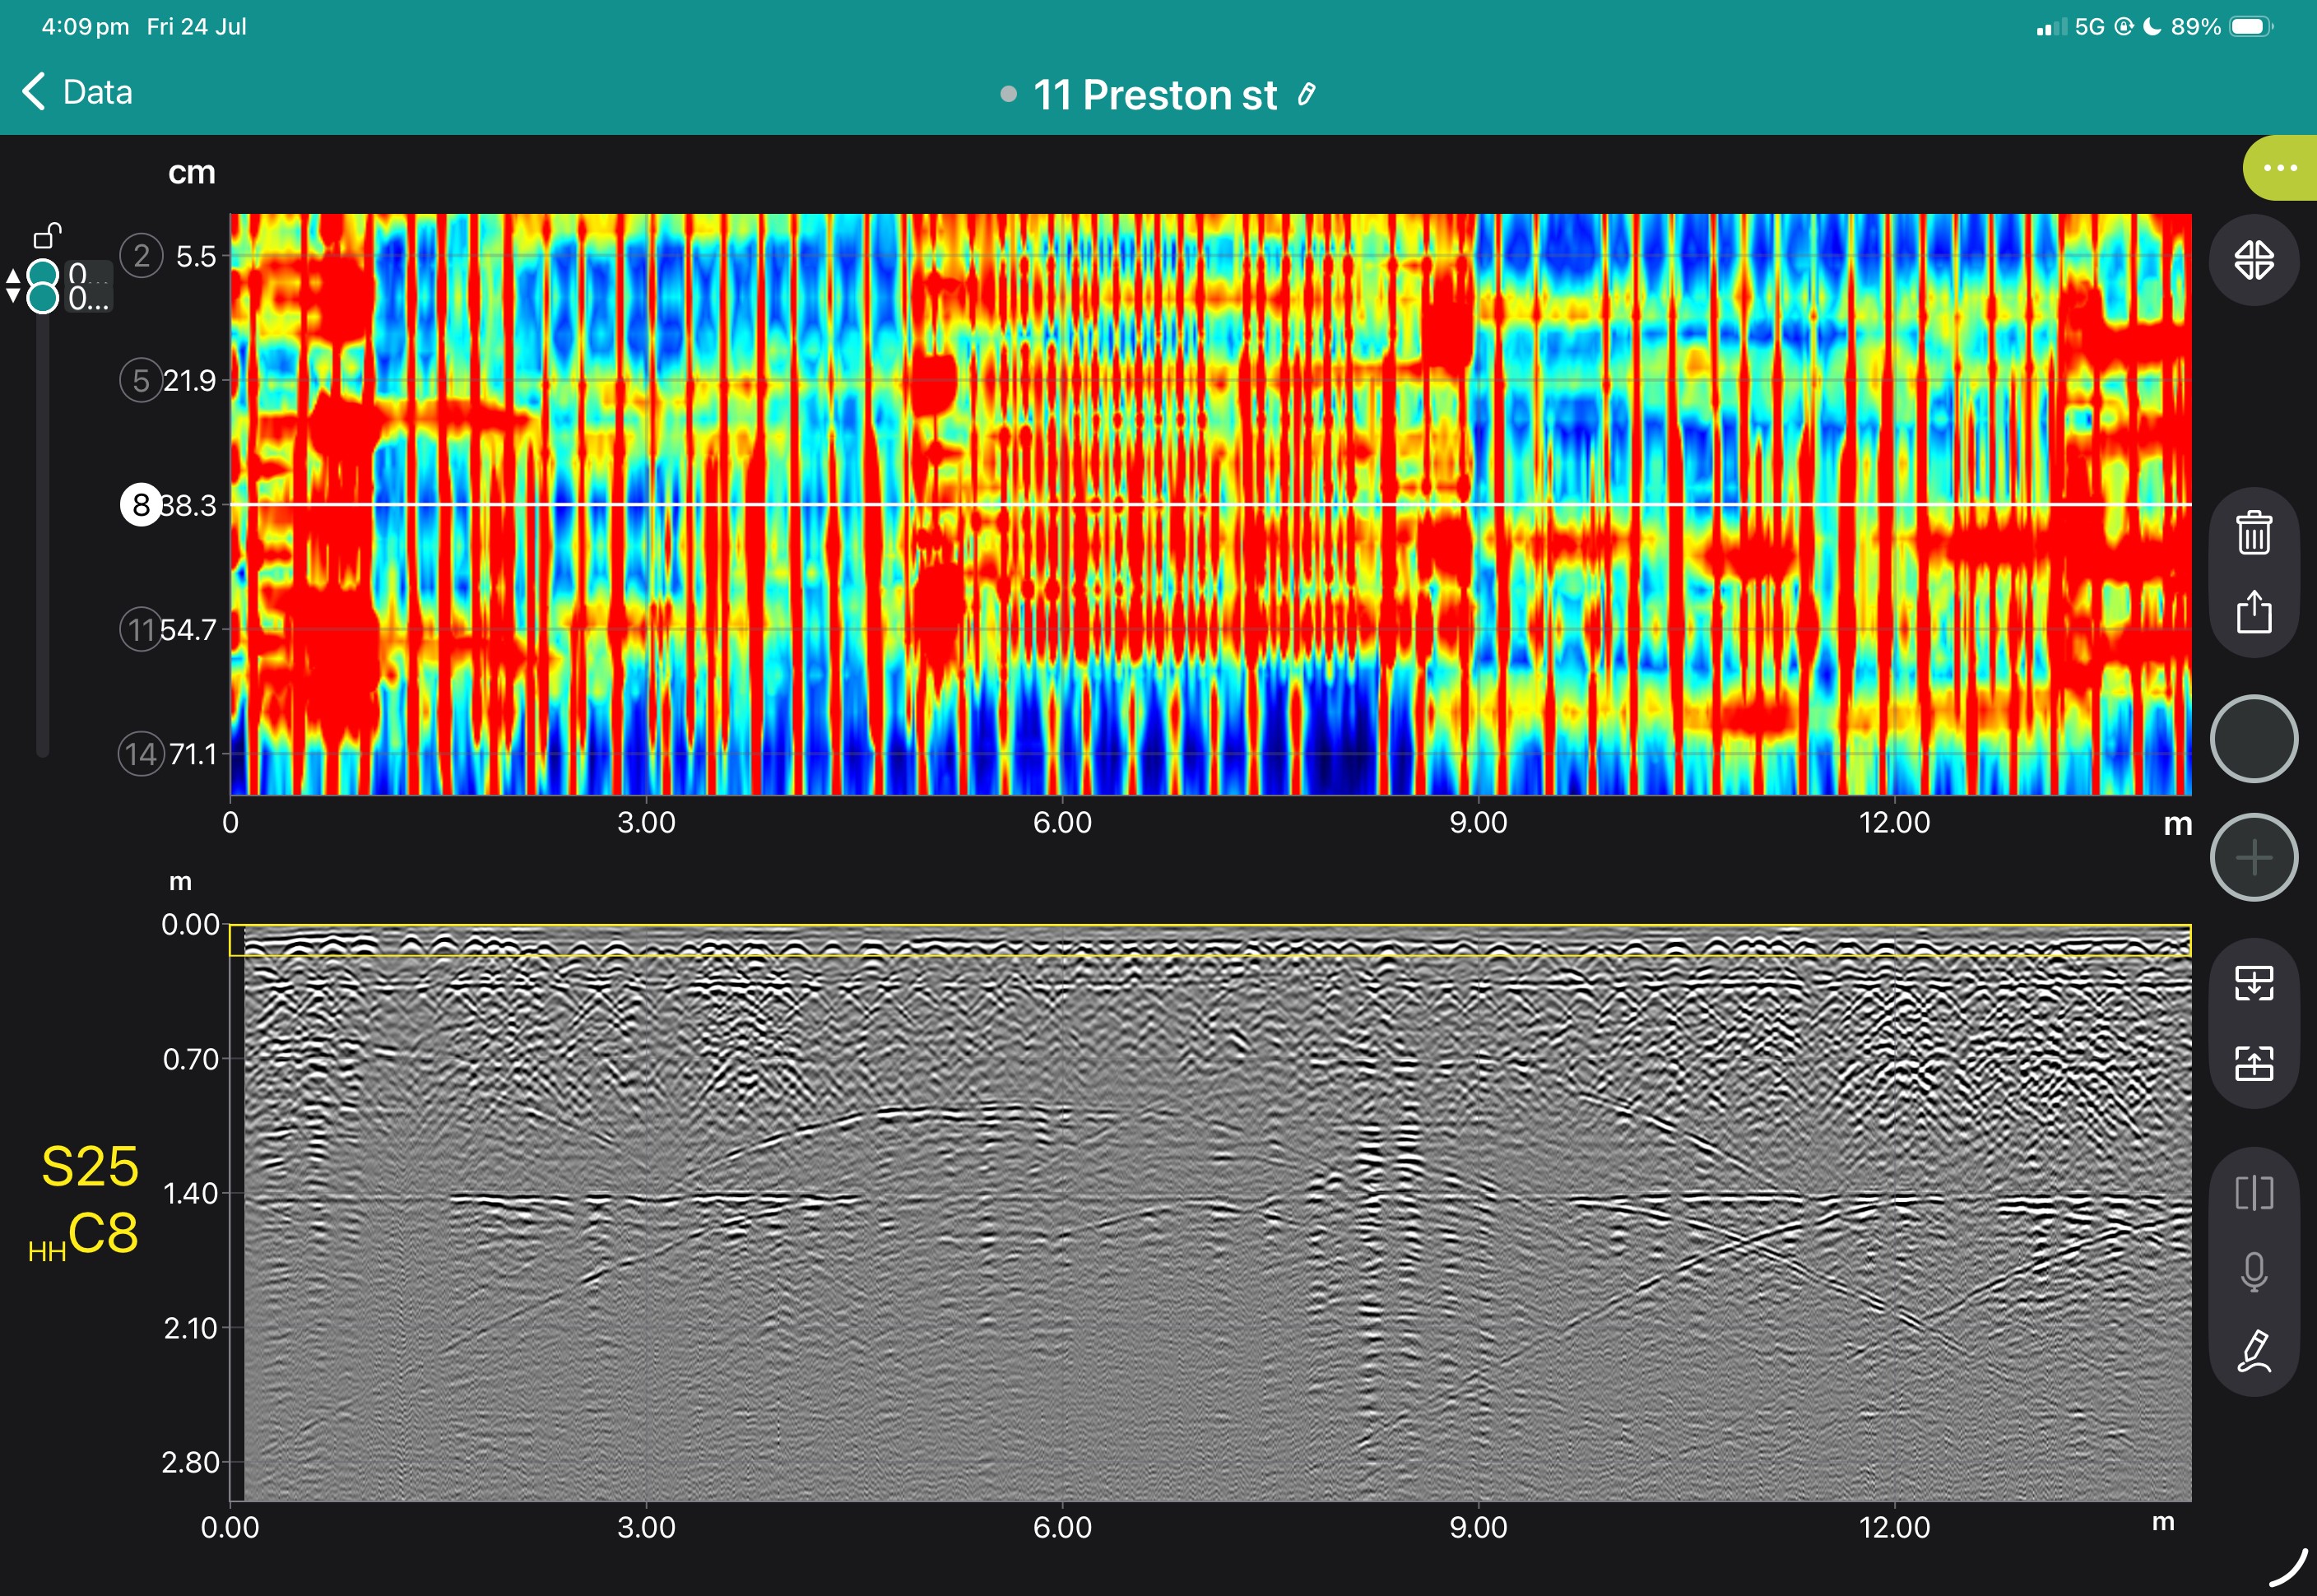
View some of these features at work below, and our case study if you'd like to see more of what the GS9000 can do.




Book a Structural Assessment Demonstration
GS9000 cart with: