%20vector%20logo.svg)

Phone: 02 9453 9999 or Email: sales-operations@pcte.com.au

The Zehntner ZG8000 Gloss Meter by Proceq enables coating suppliers, product manufacturers and quality inspectors to do exactly that— inspect the quality of a surface finish or applied coating.
Overview | GX1 vs GX2 | SUE & Utilities | Structures & Pavements | Software & Outputs | Case Studies | Specifications | Support
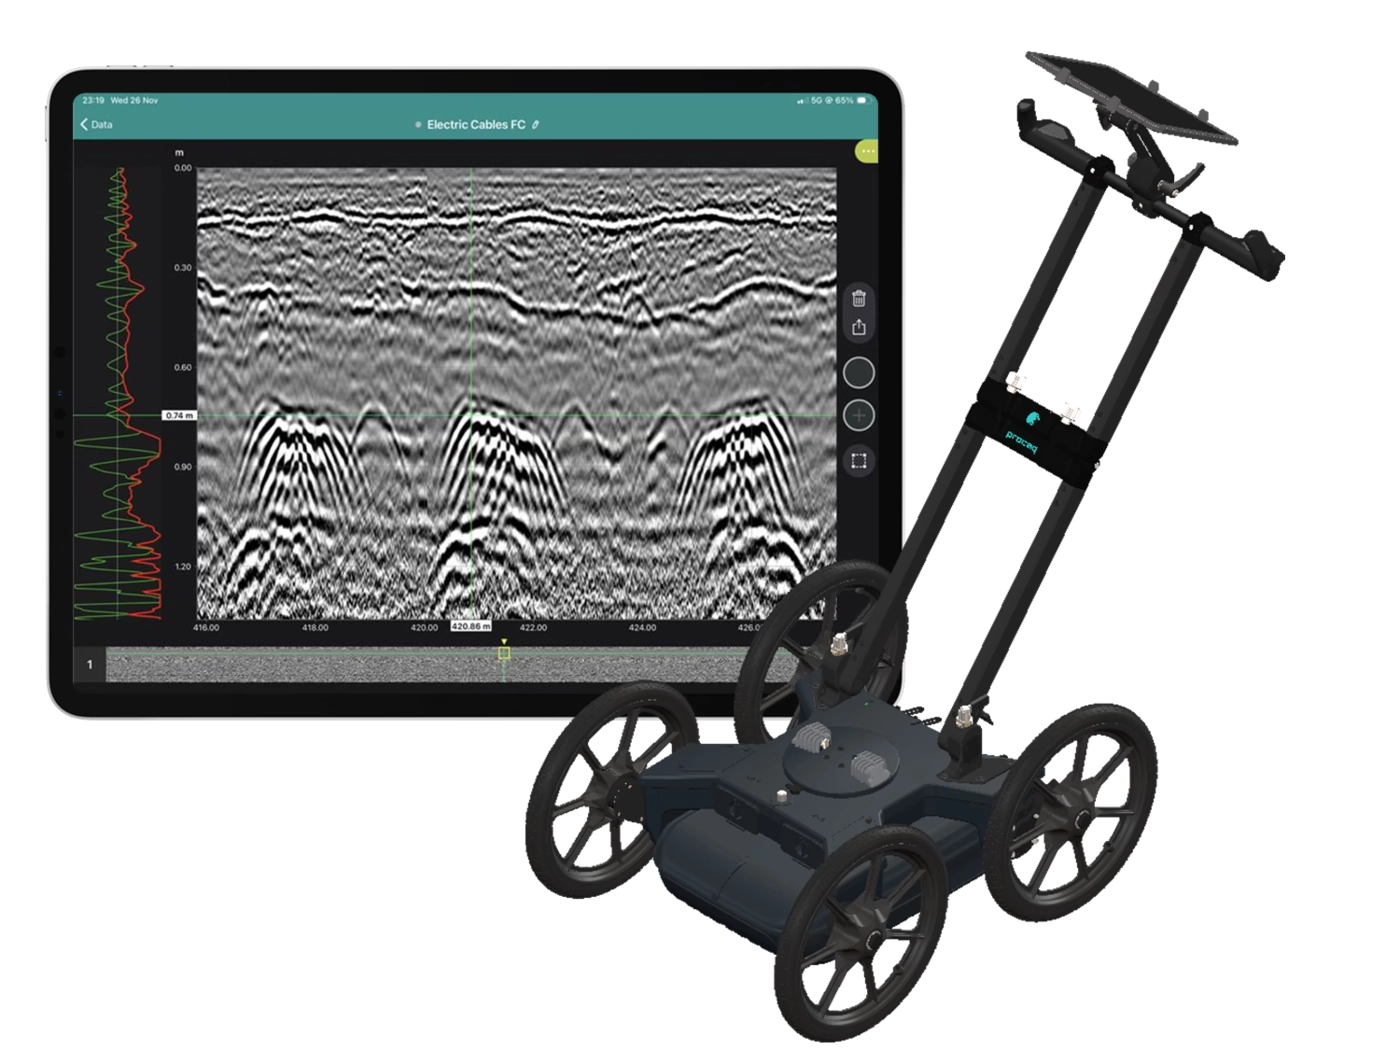
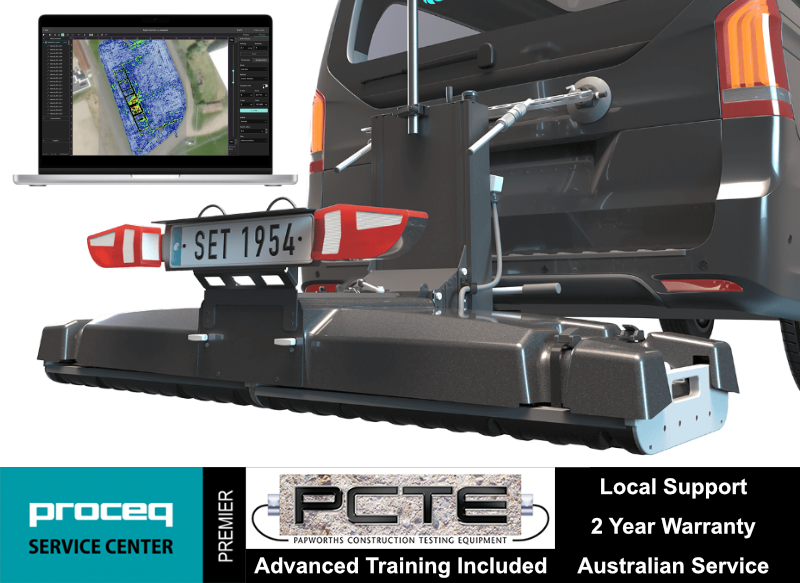
Collect high-density, georeferenced GPR data across wide areas and view the subsurface in 3D as you scan. Choose the GX2 array for SUE and utility mapping, or the GX1 array for structural, bridge and pavement investigations.
Best suited to:
Best suited to:
Recommended array: GX2
Recommended array: GX1
Cover more ground
Collect multiple parallel profiles in one pass instead of uilding a grid line by line.
See results during acquisition
View georeferenced radargrams and time-slice information in the field rather than waiting until the data is returned to the office.
Produce repeatable mapped data
Combine wheel-positioned GPR data with GNSS, project coordinates and survey linework.
Use one platform for two very different applications
Exchange GX1 and GX2 arrays without purchasing two complete cart platforms.
The GX2 transforms the GS9000 into a high-density subsurface utility mapping system. Its 11-channel, low-frequency GPR array captures an 83 cm-wide swath in each pass, helping operators detect and map buried pipes, ducts, cables, voids and other subsurface features. Live georeferenced data lets SUE teams review coverage on site and produce accurate CAD, GIS and project-coordinate deliverables.
1. Plan the survey
Load satellite imagery, CAD information, project coordinates or survey control.
2. Collect dense multichannel data
Survey an approximately 0.82 m-wide swath with 11 channels in each pass.
3. Review data live
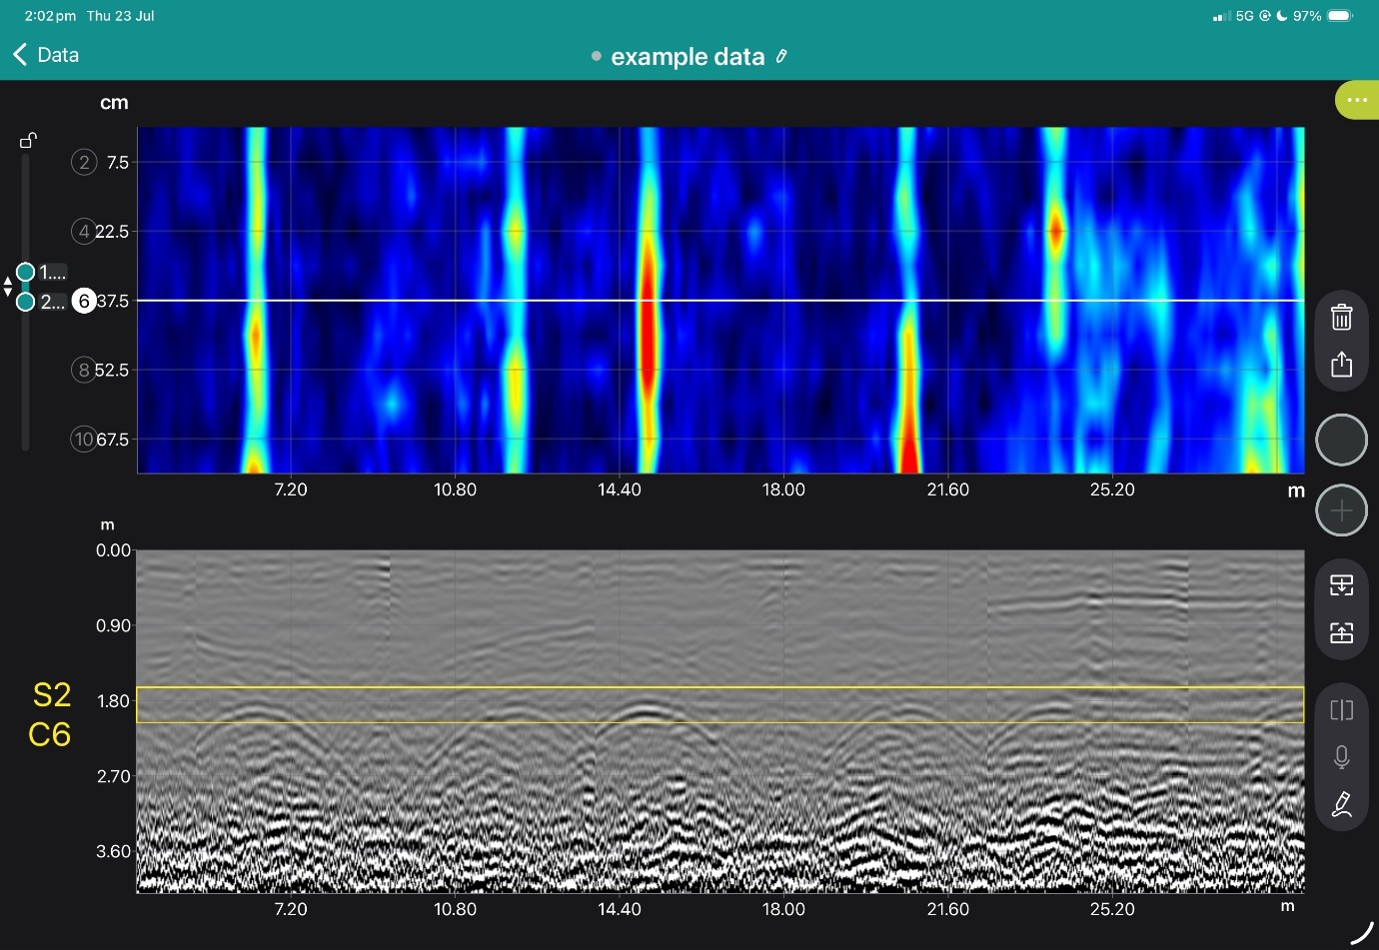
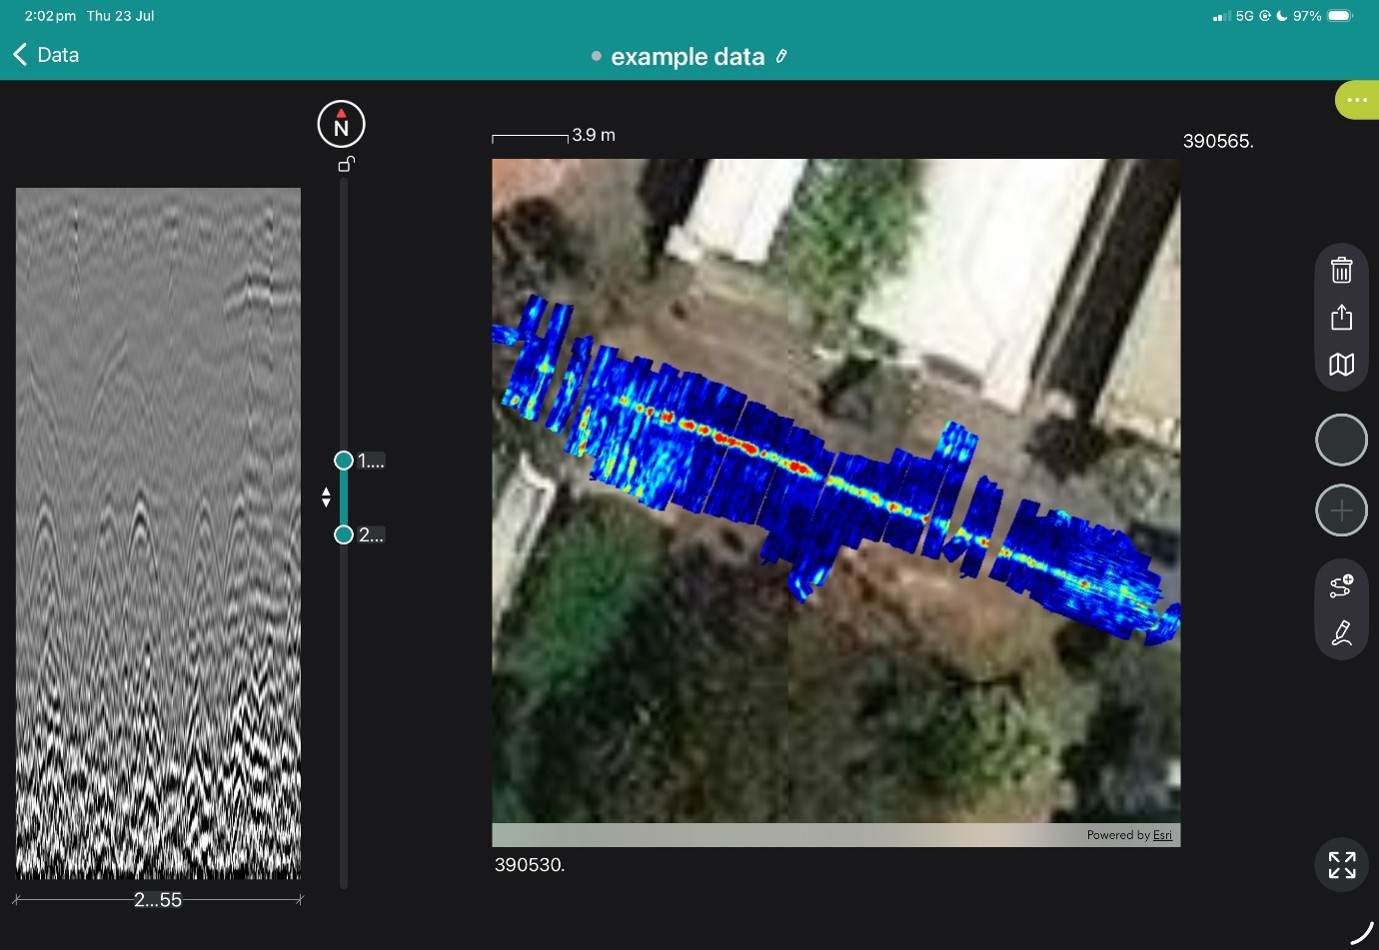
Examine radargrams, georeferenced time slices and marked features while still on site.
4. Interpret and digitise
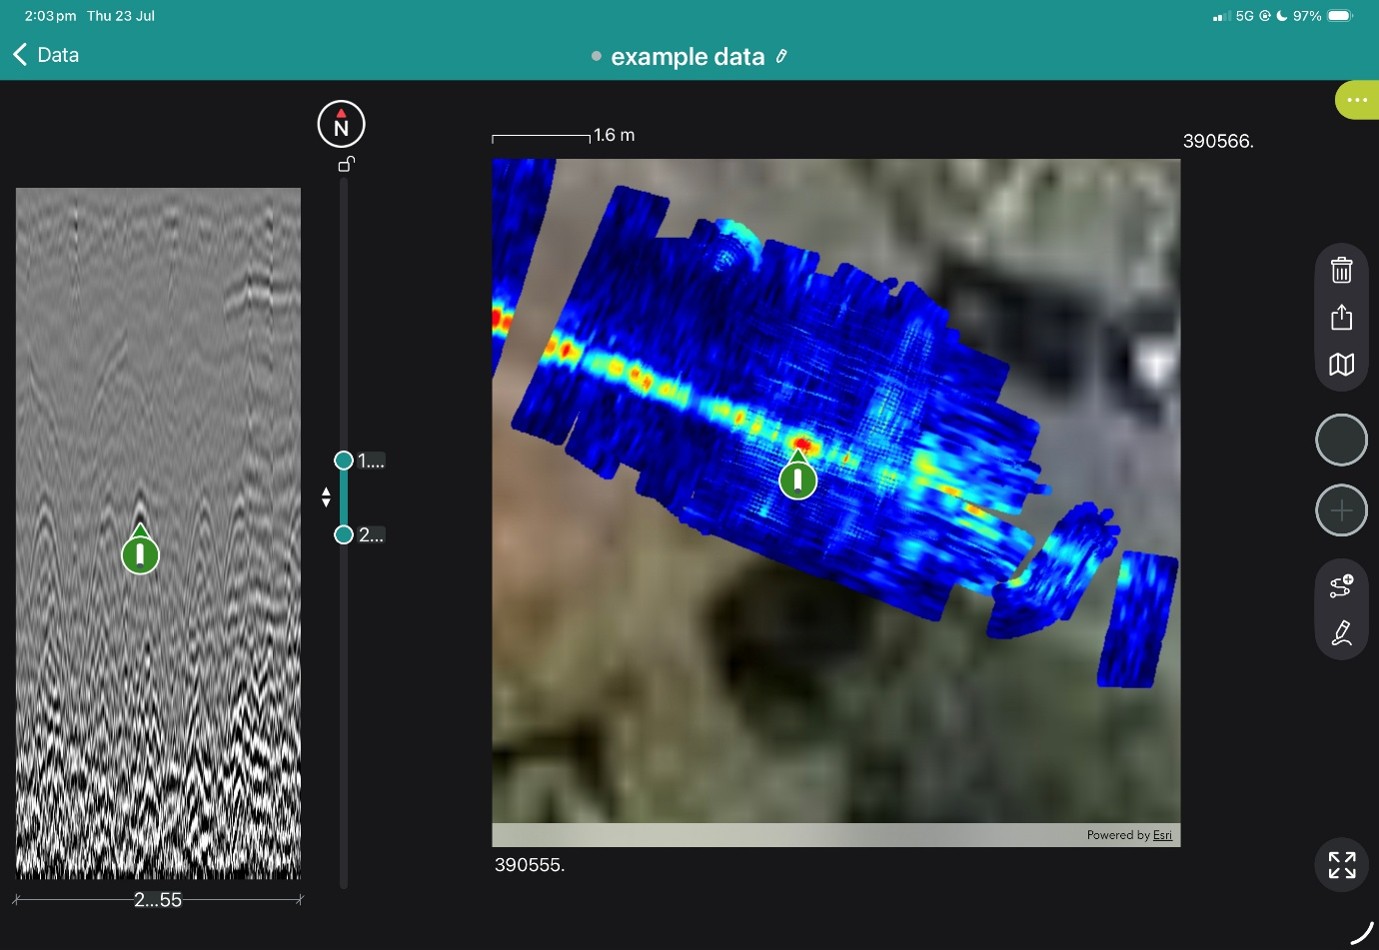
Add points, linework, tags, photographs and field observations.
5. Process and deliver
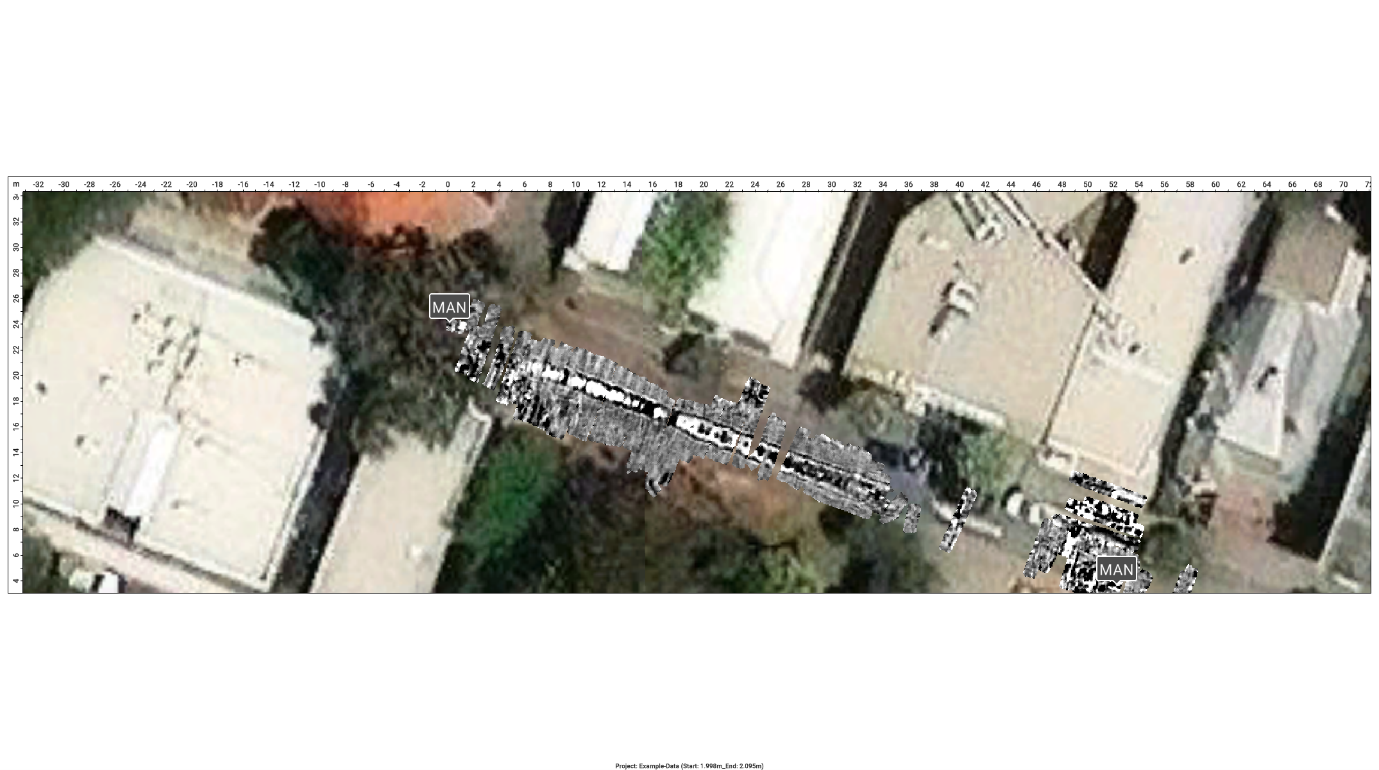
Merge survey areas, apply processing and export mapped information for the customer’s CAD, GIS or reporting workflow.
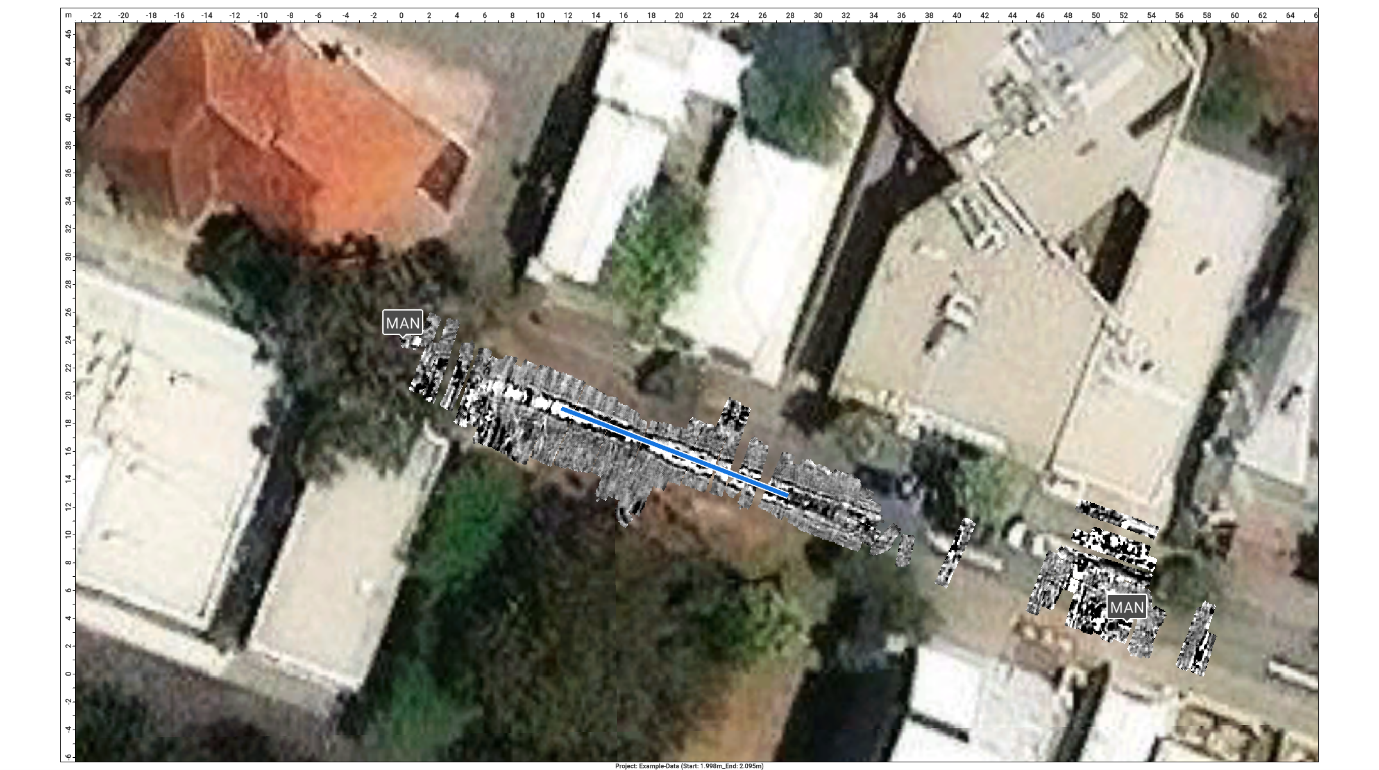
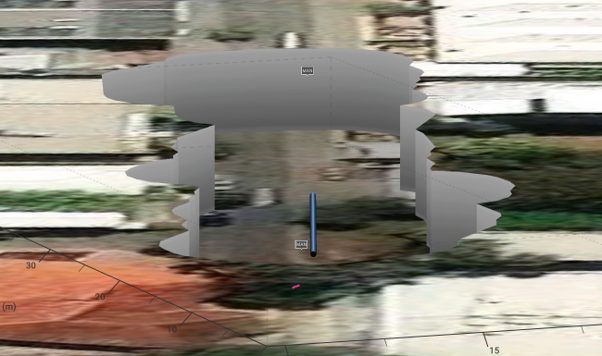
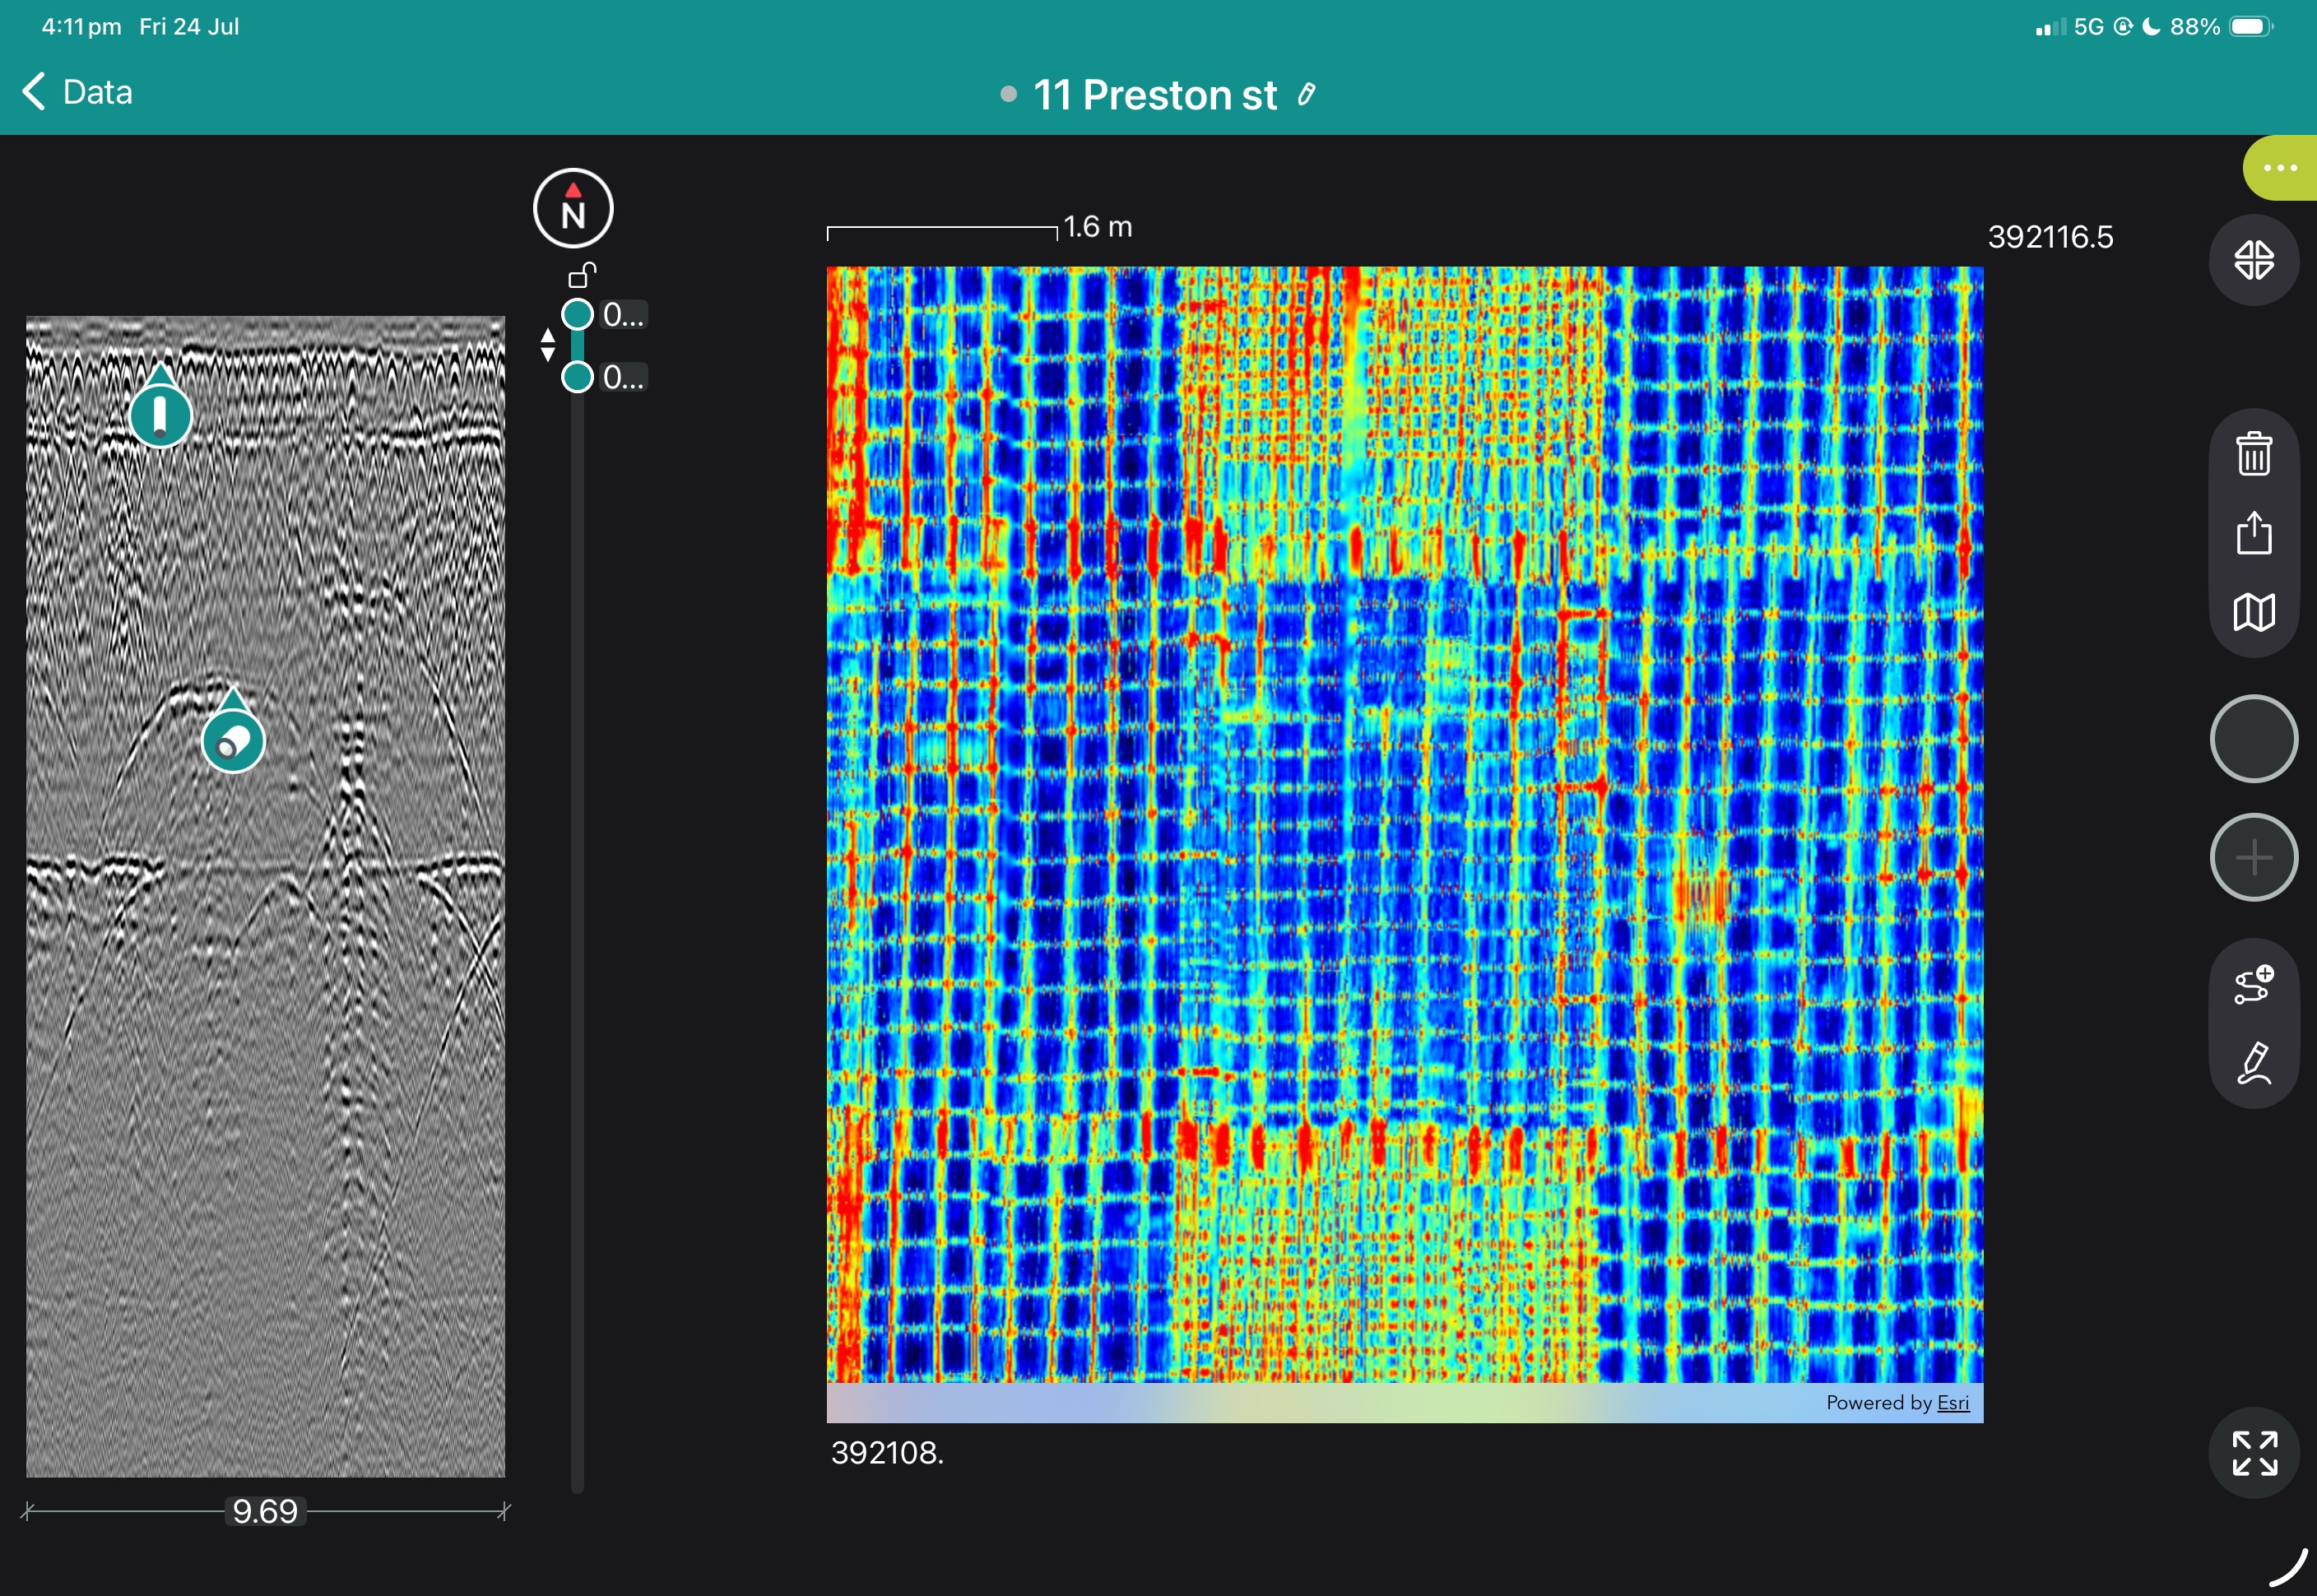
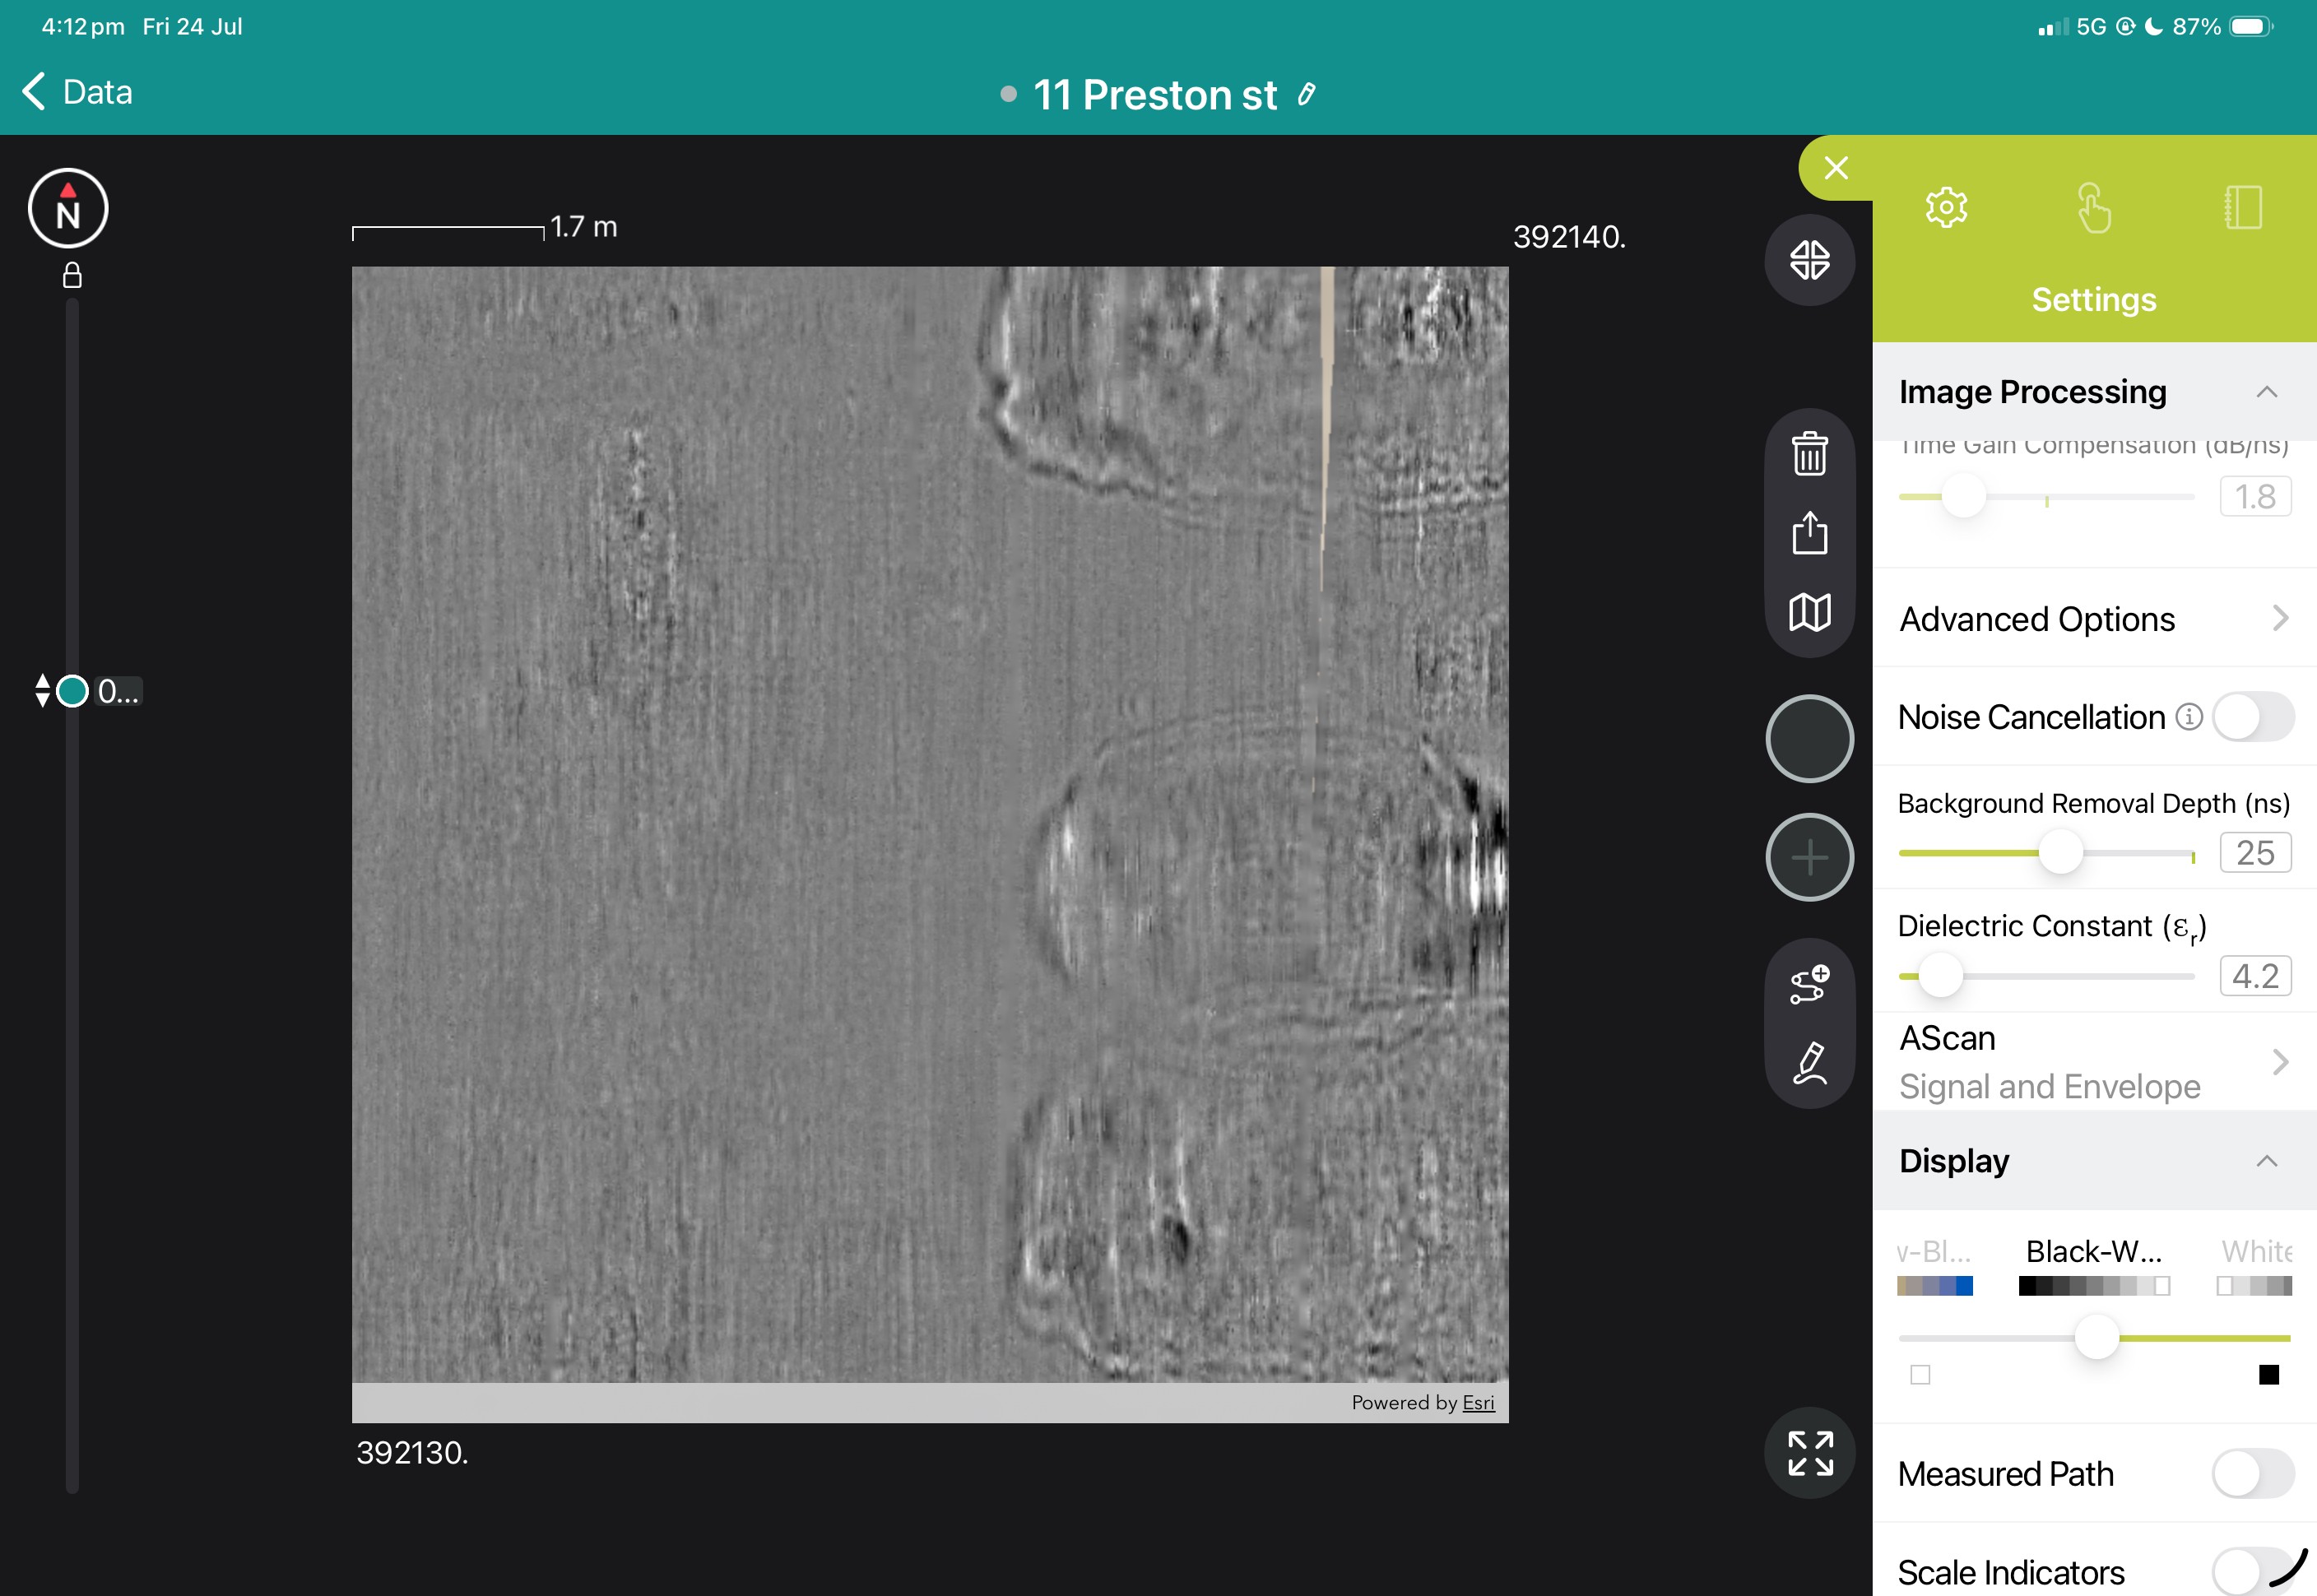
View the images below to see these in action.

Connect the probe wirelessly to your mobile device and enjoy the user-friendly app with insightful statistics, sharing, collaboration and reporting - anywhere, anytime.

The app automatically calculates measurement statistics and displays the series with bar graphs, thus reducing manual transcription errors.
The synchronization and sharing of your measurements through the Proceq Live cloud platform also eliminates the use of easy-to-lose USB drives (or paper scraps) with measurements.
A simple digital workflow makes standards-compliant reporting a breeze, with just a couple of taps, and clear traceable data.
The Zehntner Glossmeter supports Proceq's Logbook feature, recording the Geolocation and supporting voice, image and text annotations.
Cloud synchronisation means the lead time from measurement to sign-off is mere seconds, with a range of ways to send the measurement to another device, or export a .pdf or raw data.
The probe is powered by an off-the-shelf, flight-safe AAA battery that can be recharged over USB.
For measuring sensitive surfaces or curved parts with stability alternative feet are also available. The built-in targeting laser can be used together with the side-view of the measuring spot to make positioning accurate.

Despite its pocket size, the Zehntner ZG8000 probe features a standards-compliant two-angle geometry for measuring high-gloss and mid-gloss surfaces at 20° and 60° of light incidence with high accuracy and repeatability. This also makes it possible to measure haze, i.e. the degree of reflection from inside a highly-reflective coating.
Traditional glossmeters have long suffered from measurement inaccuracies that are caused by stray light from natural or artificial light sources – from the sun or the subtle strobe effect of overhead halogen lights. The Zehntner ZG8000 features Stray Light Compensation - intelligent algorithms monitor the environment for stray light and utilize this information to exclude deviations, so that you can measure with high accuracy and peace of mind - anywhere, anytime.
Book a SUE Workflow Demonstration
The GX1 transforms the GS9000 into a high-resolution structural assessment system for concrete slabs, bridge decks and pavements. Its dense, dual-polarisation array captures detailed 3D data across wide areas, supporting reinforcement and cover mapping, moisture and deterioration assessment, and analysis of asphalt and pavement layers. Live visualisation helps confirm survey coverage on site, while post-processing tools produce clear, report-ready condition maps.
1. Define the inspection area
Import the structure, bridge, pavement or survey background.
2. Collect closely spaced profiles
Capture 35 longitudinal and 15 cross-polarised channels with dense spacing.
3. Review coverage in the field
Use live radargrams and time slices to confirm that the required area has been captured.
4. Process the dataset
Apply velocity, gain, background removal, migration, filtering and topographic correction as appropriate.
5. Generate diagnostic maps
Create depth slices, reinforcement maps, layer information or application-specific condition maps.
6. Integrate with the engineering assessment
Export figures, mapped anomalies and raw data for inclusion in the engineer’s final interpretation and report.
Field information
Processed Diagnostic Information
Engineering deliverables
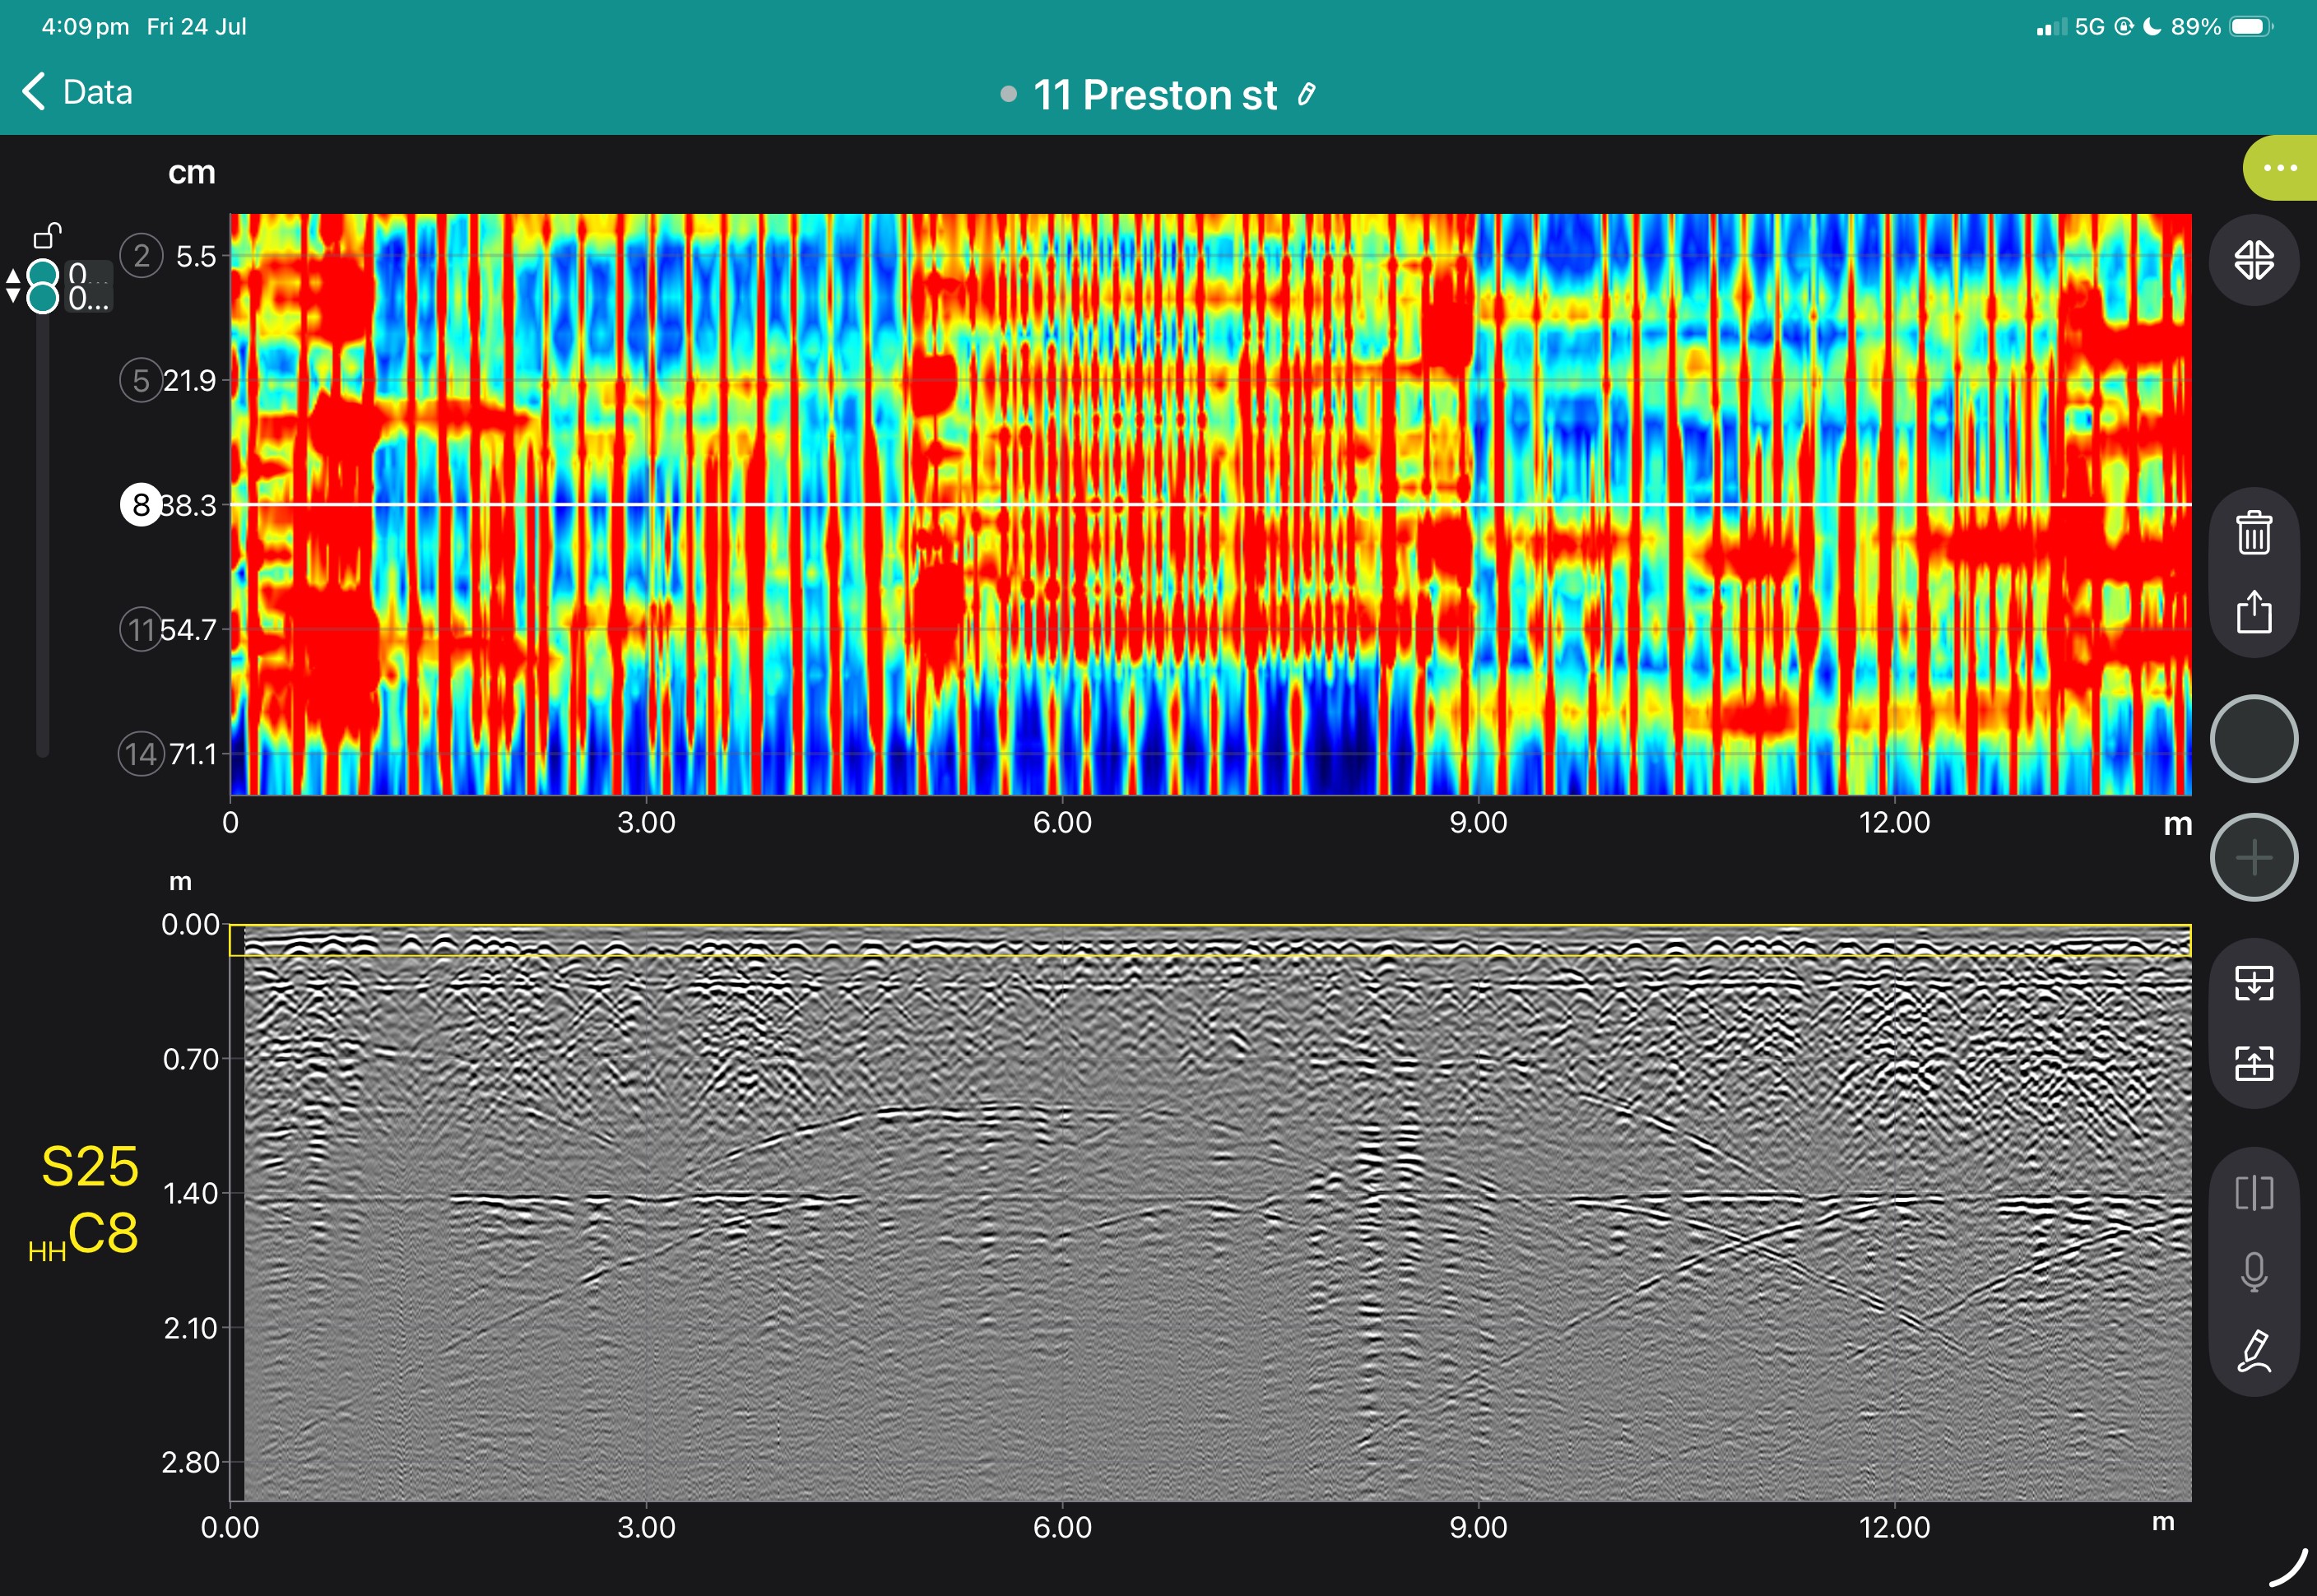
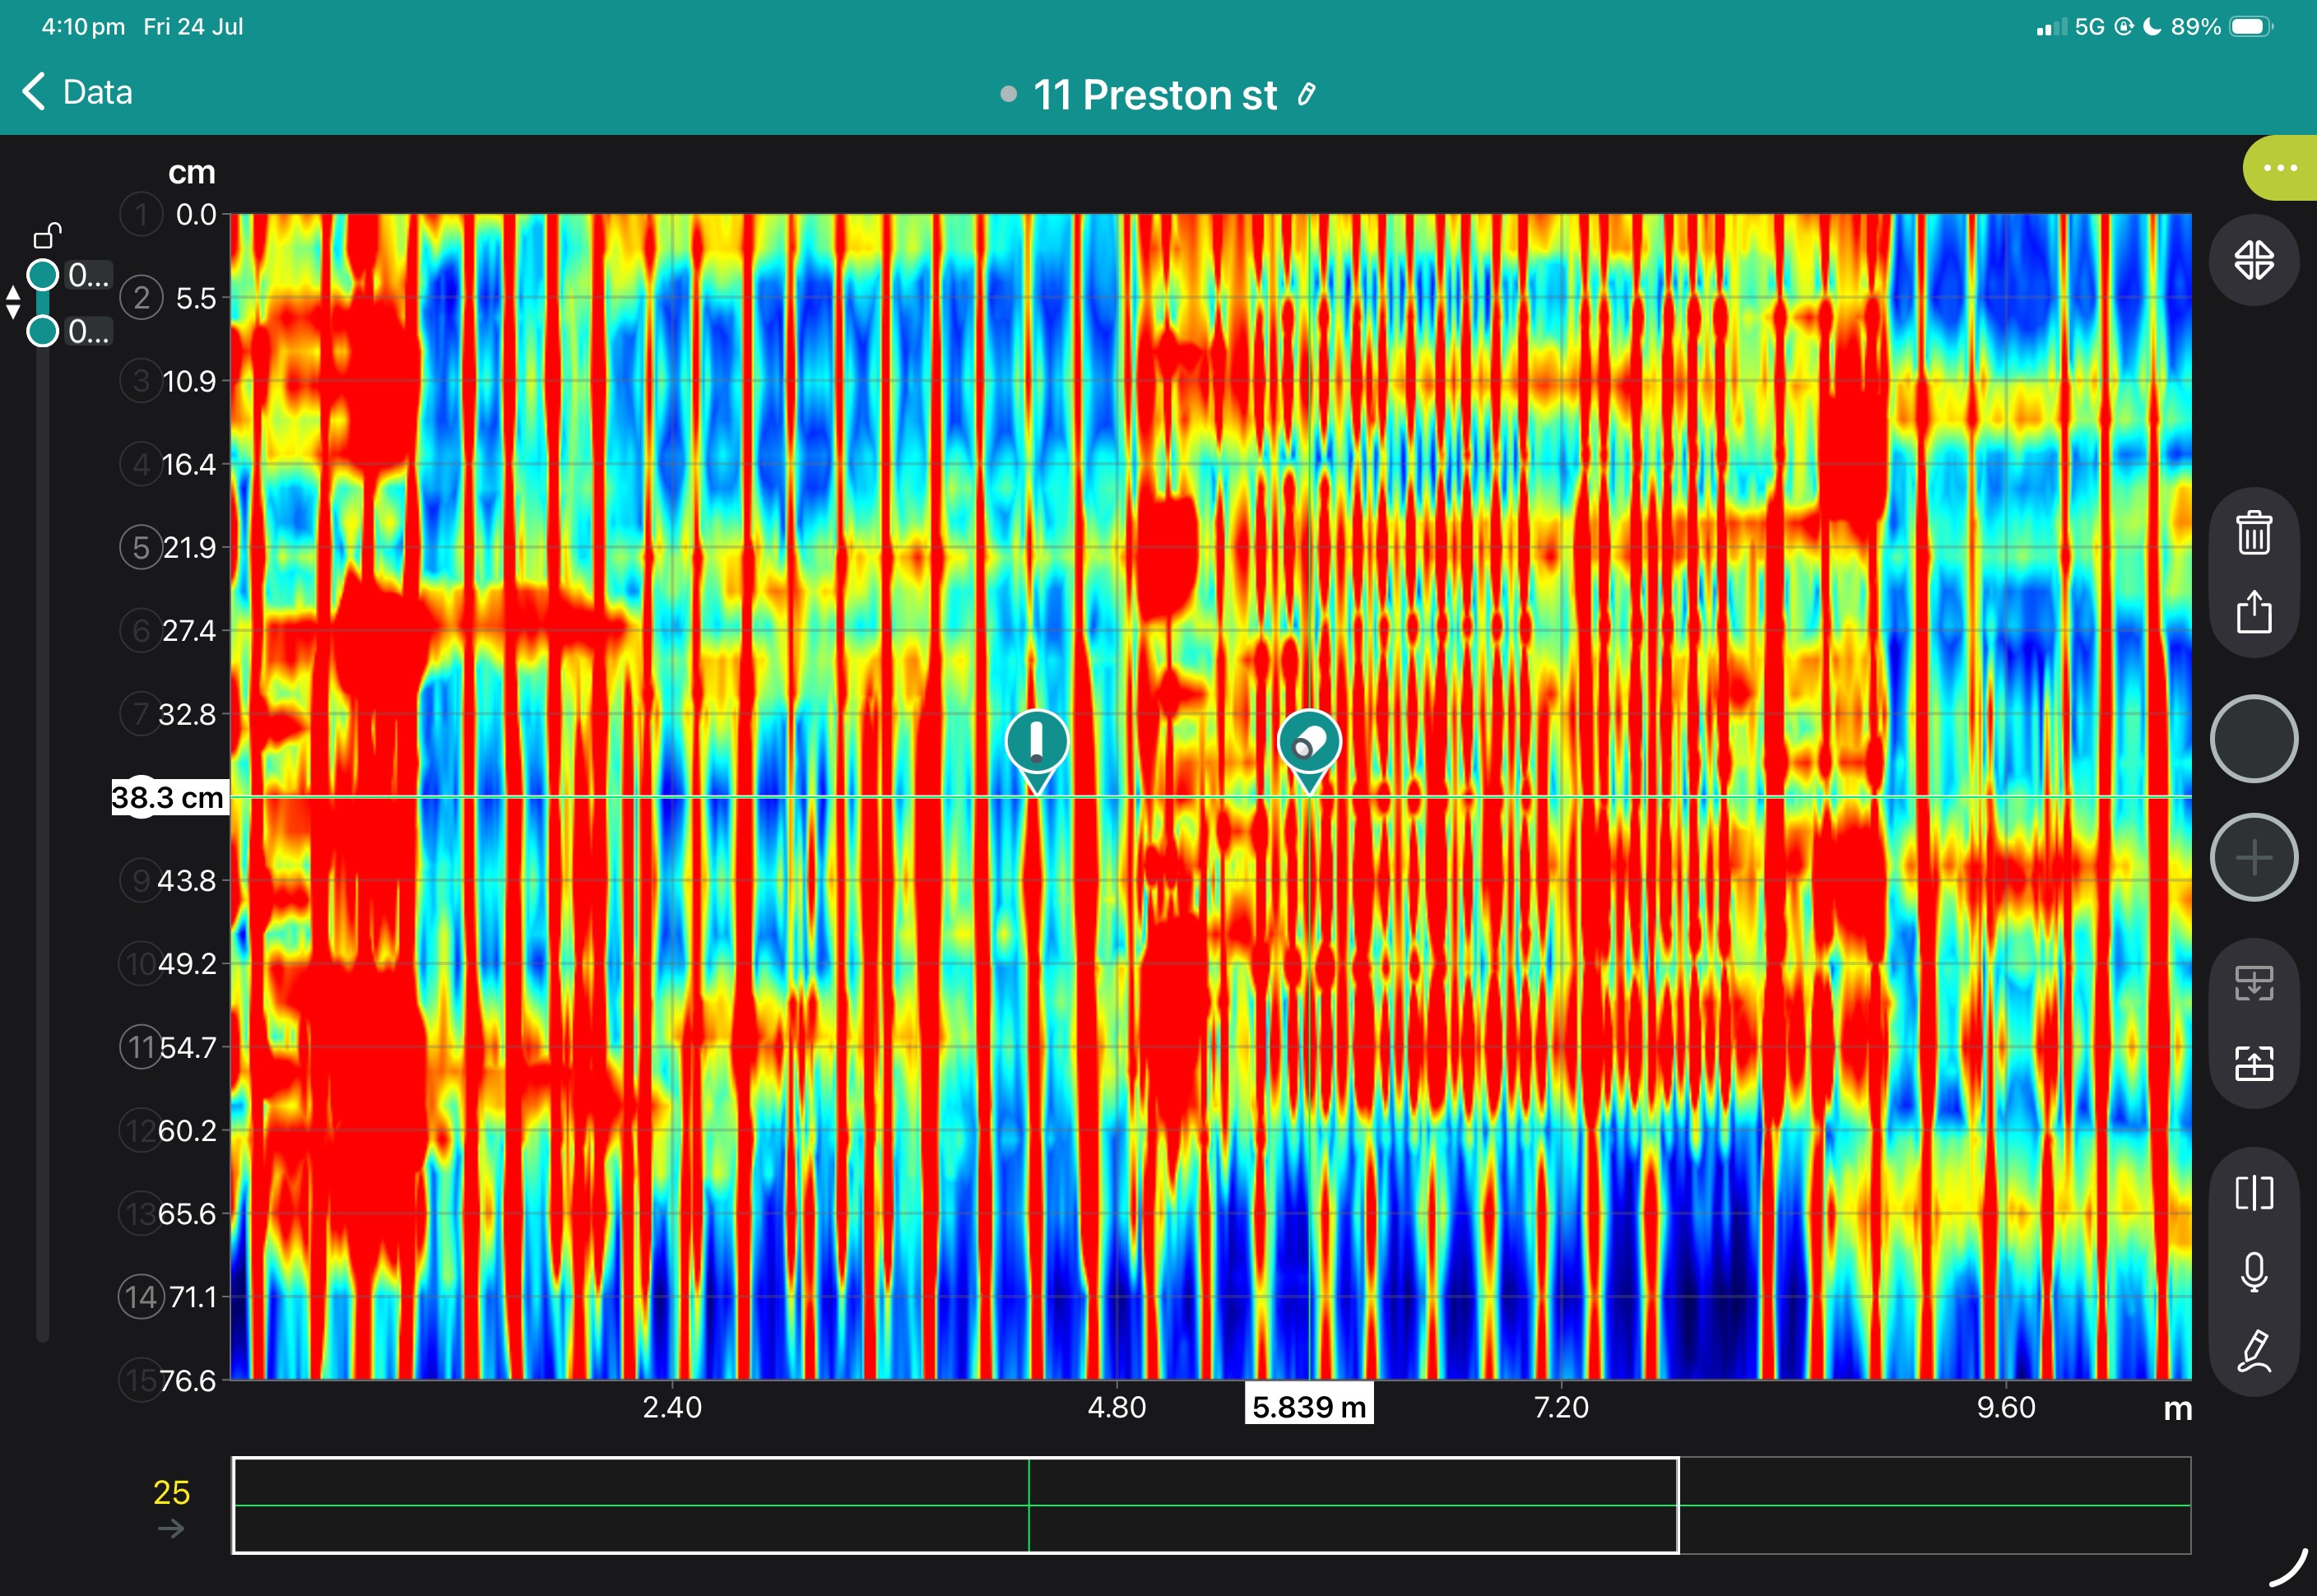
View some of these features at work below, and our case study if you'd like to see more of what the GS9000 can do.




Book a Structural Assessment Demonstration
GS9000 cart with: