%20vector%20logo.svg)


Phone: 02 9453 9999 or Email: sales-operations@pcte.com.au

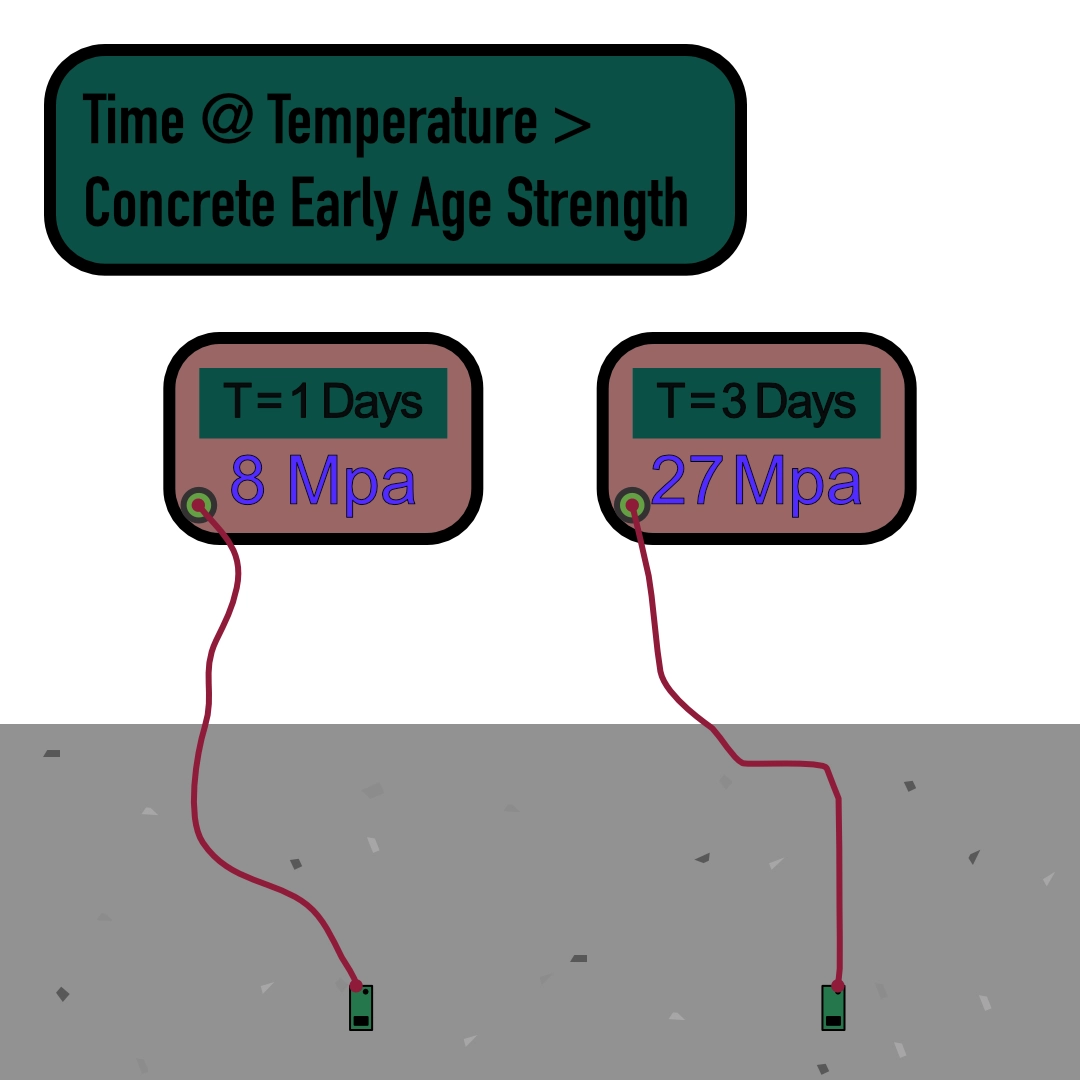
INSITE delivers critical concrete data so you can make better decisions. INSITE loggers record concrete temperature and calculate on site concrete strength using maturity. The concrete maturity method is a proven early age strength estimation technique (ASTM C 1074) that accounts for the effects of time and temperature on the strength development of in-place concrete.
Overview | GX1 vs GX2 | SUE & Utilities | Structures & Pavements | Software & Outputs | Case Studies | Specifications | Support
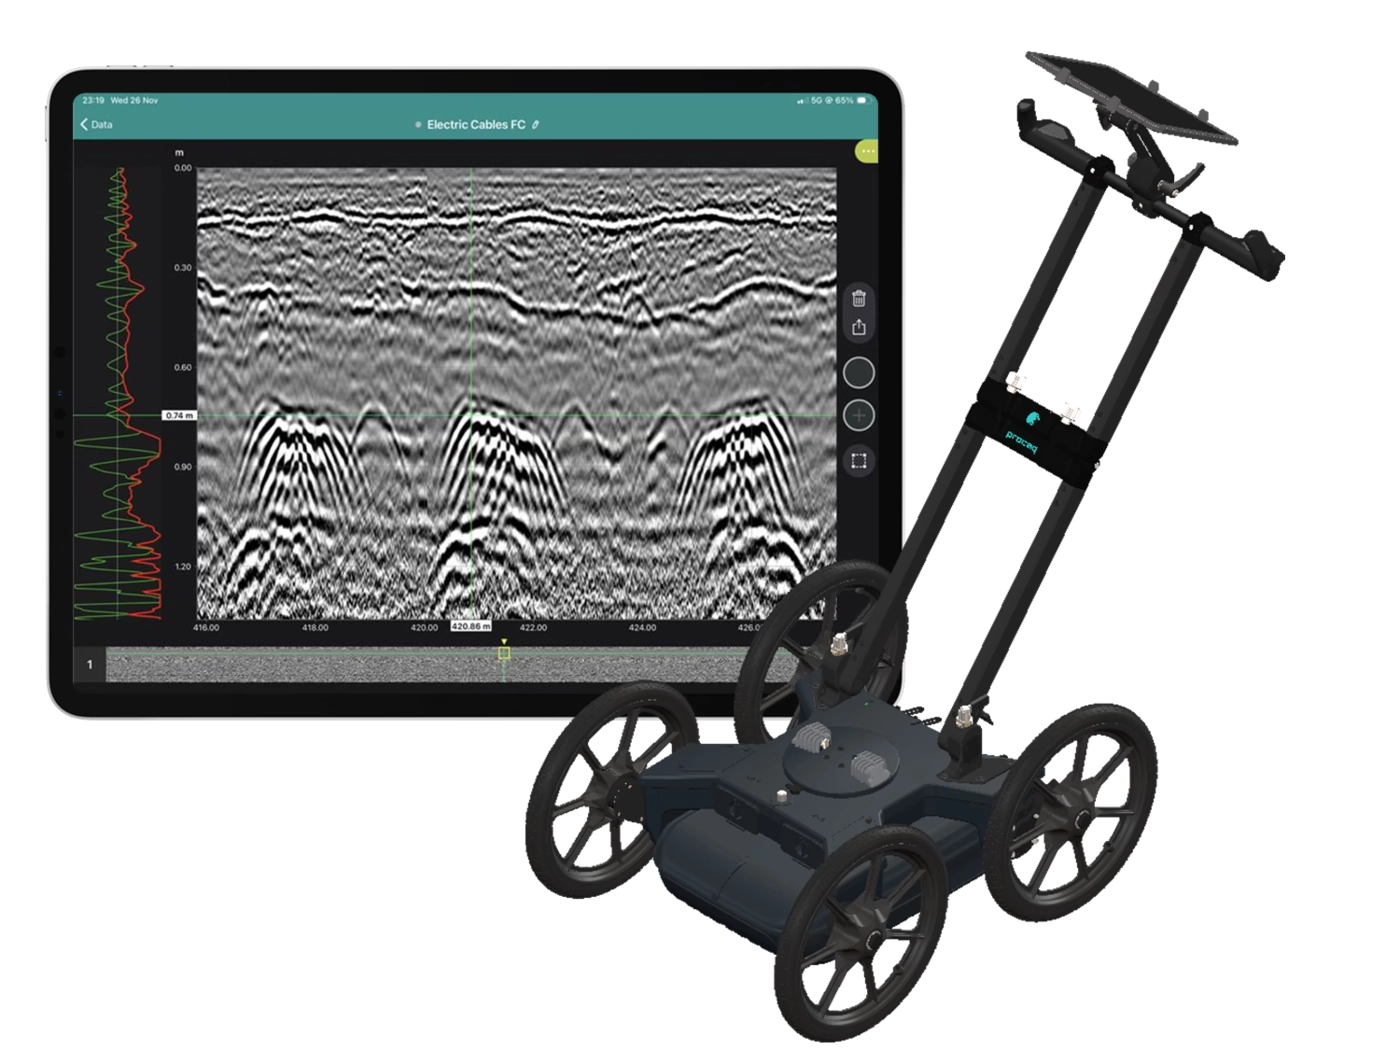
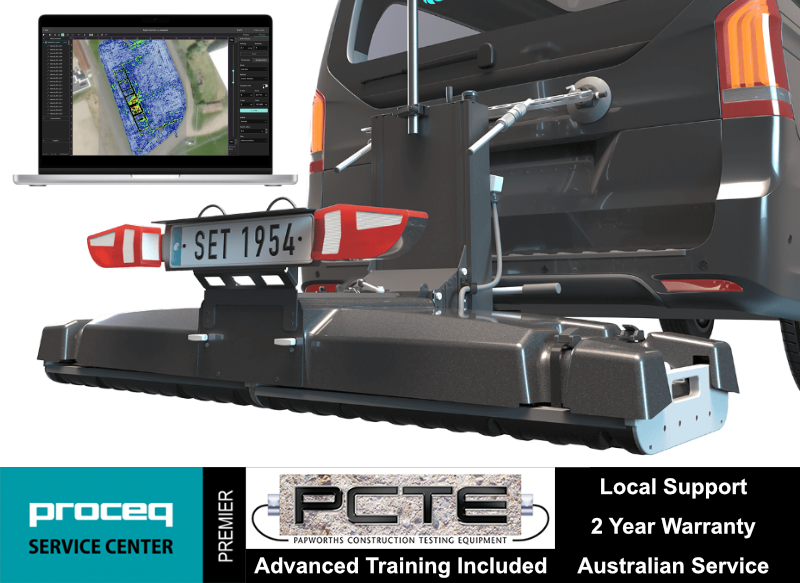
Collect high-density, georeferenced GPR data across wide areas and view the subsurface in 3D as you scan. Choose the GX2 array for SUE and utility mapping, or the GX1 array for structural, bridge and pavement investigations.
Best suited to:
Best suited to:
Recommended array: GX2
Recommended array: GX1
Cover more ground
Collect multiple parallel profiles in one pass instead of uilding a grid line by line.
See results during acquisition
View georeferenced radargrams and time-slice information in the field rather than waiting until the data is returned to the office.
Produce repeatable mapped data
Combine wheel-positioned GPR data with GNSS, project coordinates and survey linework.
Use one platform for two very different applications
Exchange GX1 and GX2 arrays without purchasing two complete cart platforms.
The GX2 transforms the GS9000 into a high-density subsurface utility mapping system. Its 11-channel, low-frequency GPR array captures an 83 cm-wide swath in each pass, helping operators detect and map buried pipes, ducts, cables, voids and other subsurface features. Live georeferenced data lets SUE teams review coverage on site and produce accurate CAD, GIS and project-coordinate deliverables.
1. Plan the survey
Load satellite imagery, CAD information, project coordinates or survey control.
2. Collect dense multichannel data
Survey an approximately 0.82 m-wide swath with 11 channels in each pass.
3. Review data live
Examine radargrams, georeferenced time slices and marked features while still on site.
4. Interpret and digitise
Add points, linework, tags, photographs and field observations.
5. Process and deliver
Merge survey areas, apply processing and export mapped information for the customer’s CAD, GIS or reporting workflow.
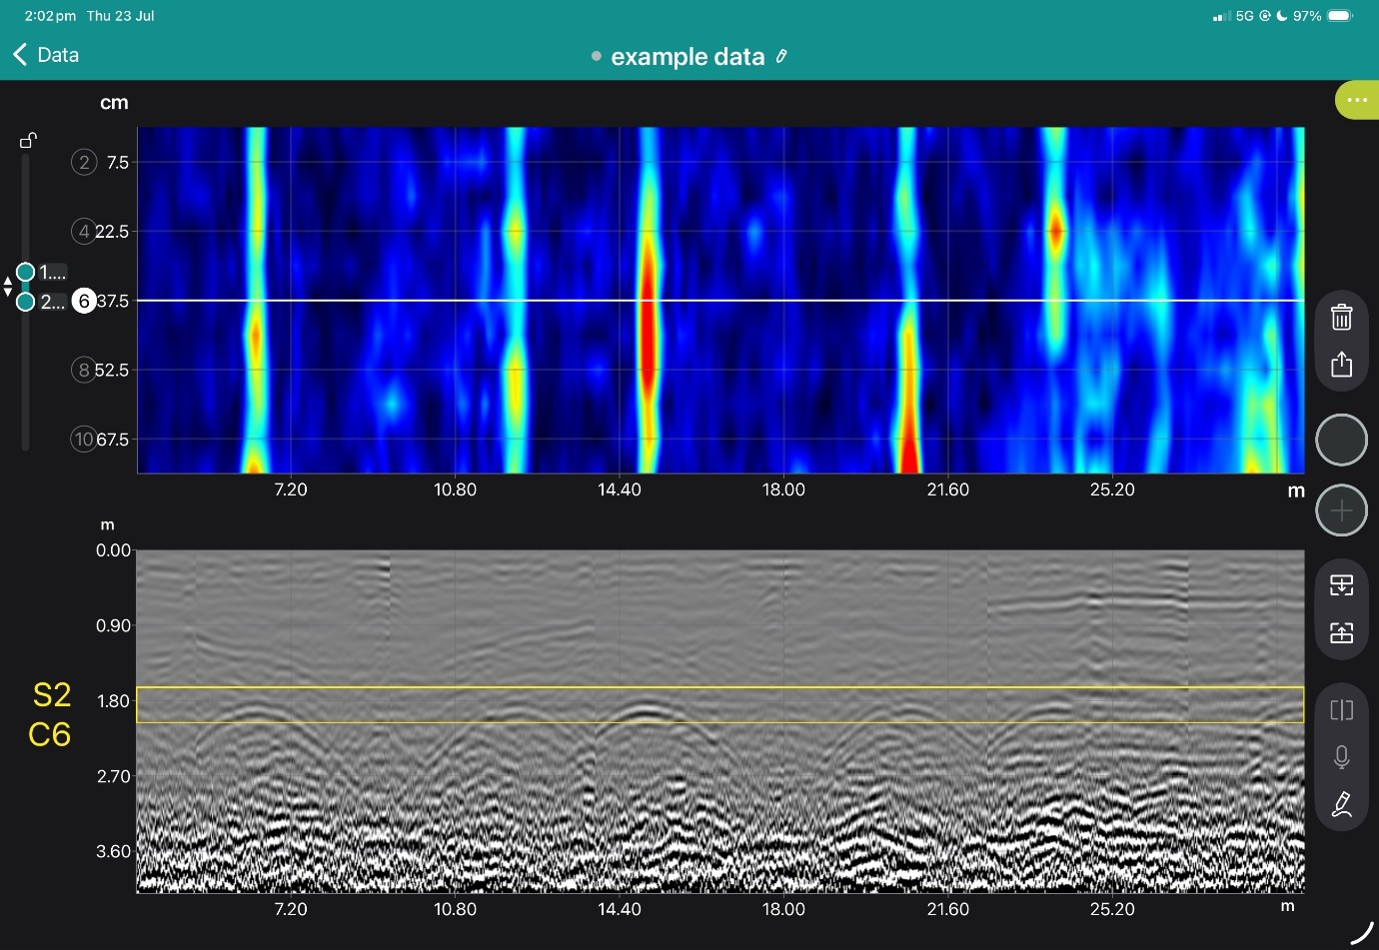
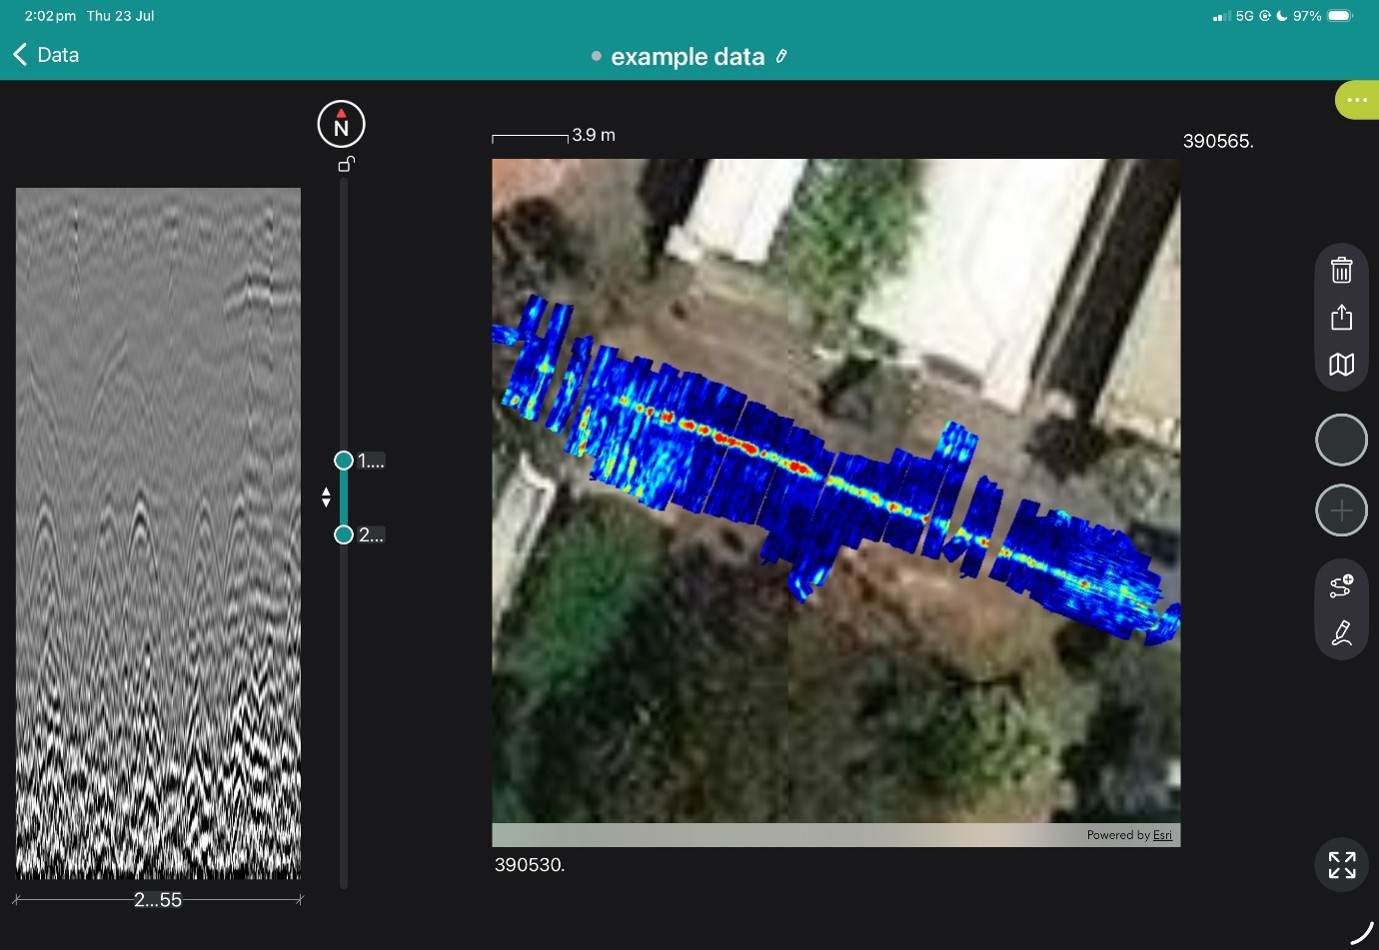
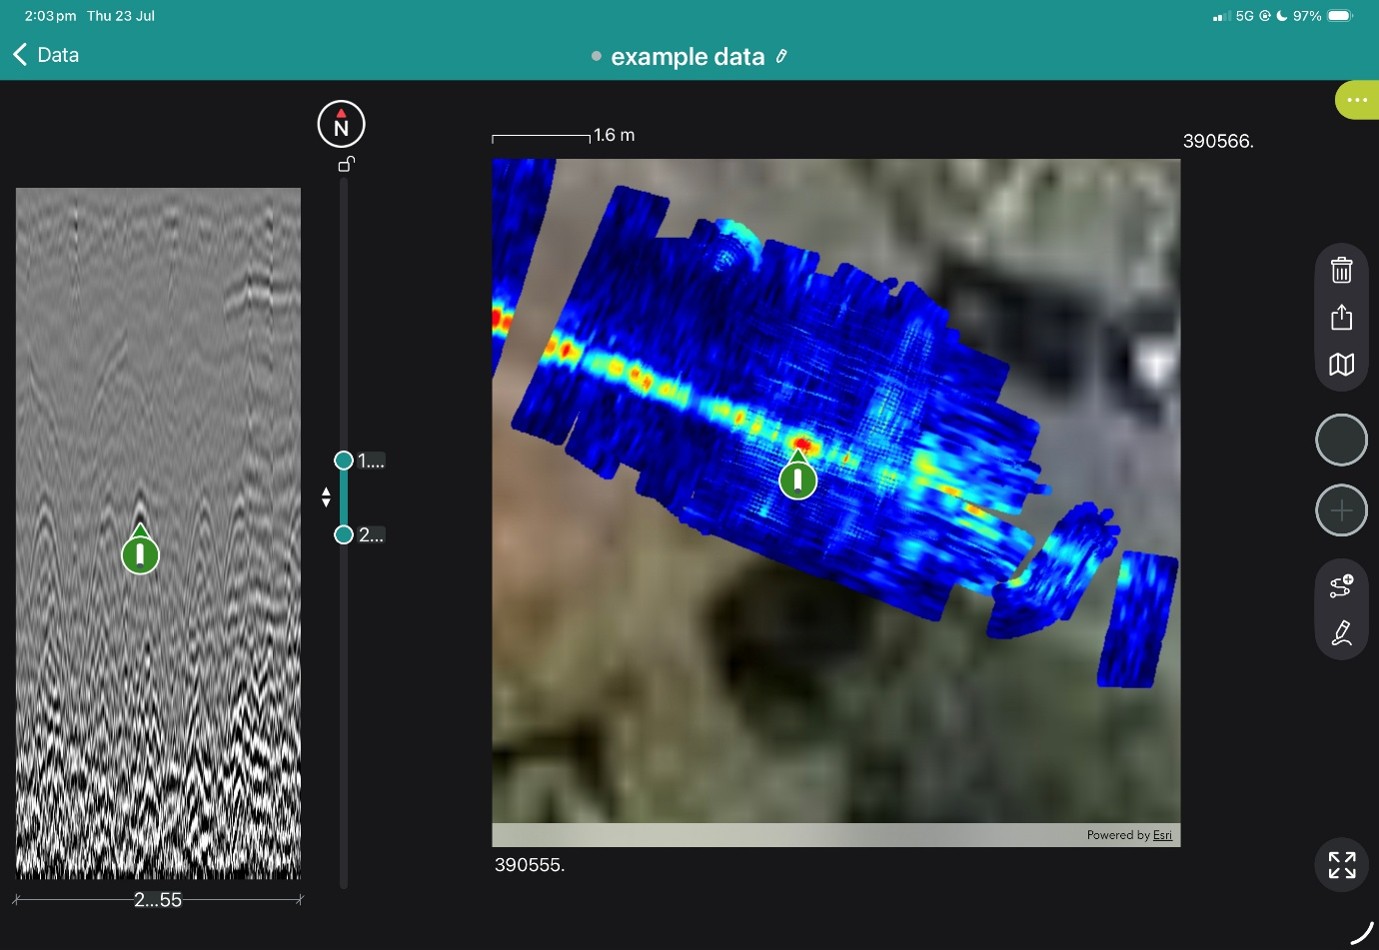
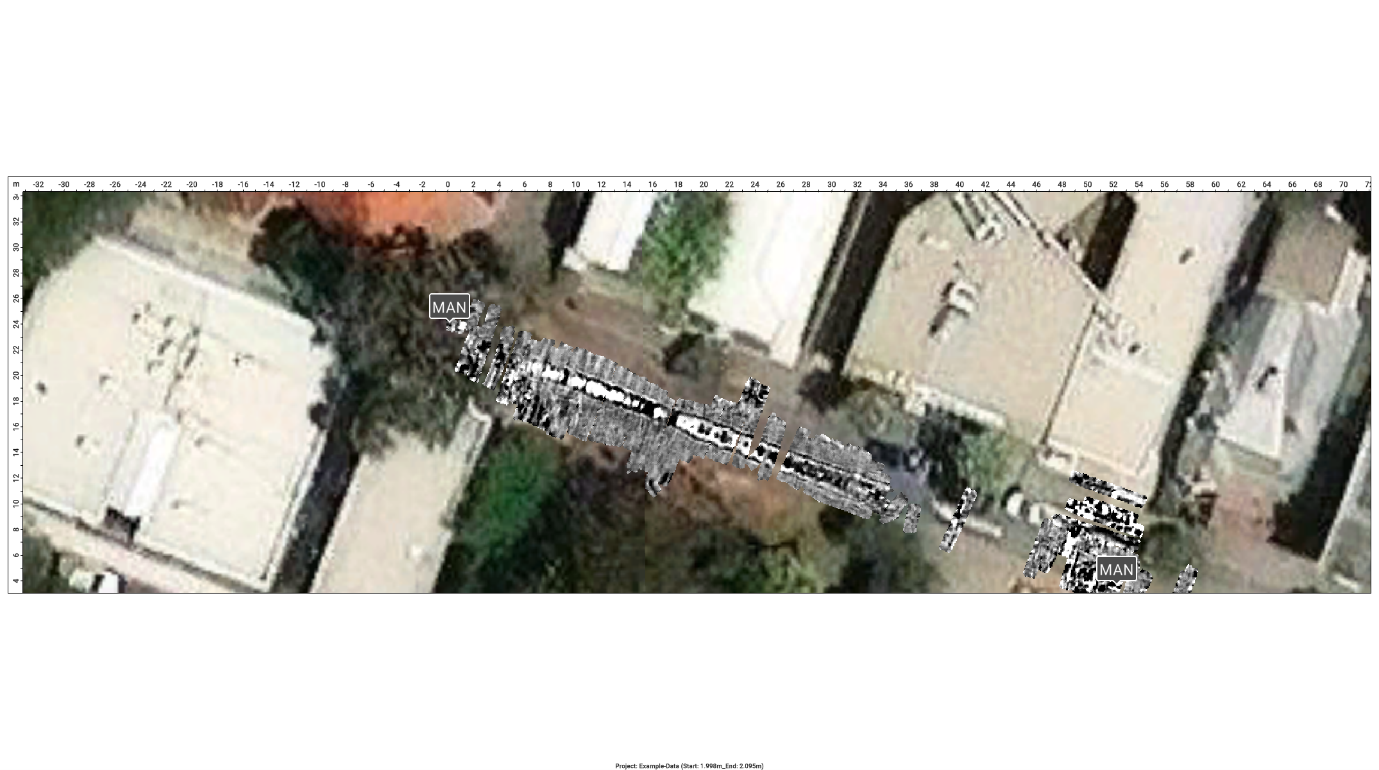
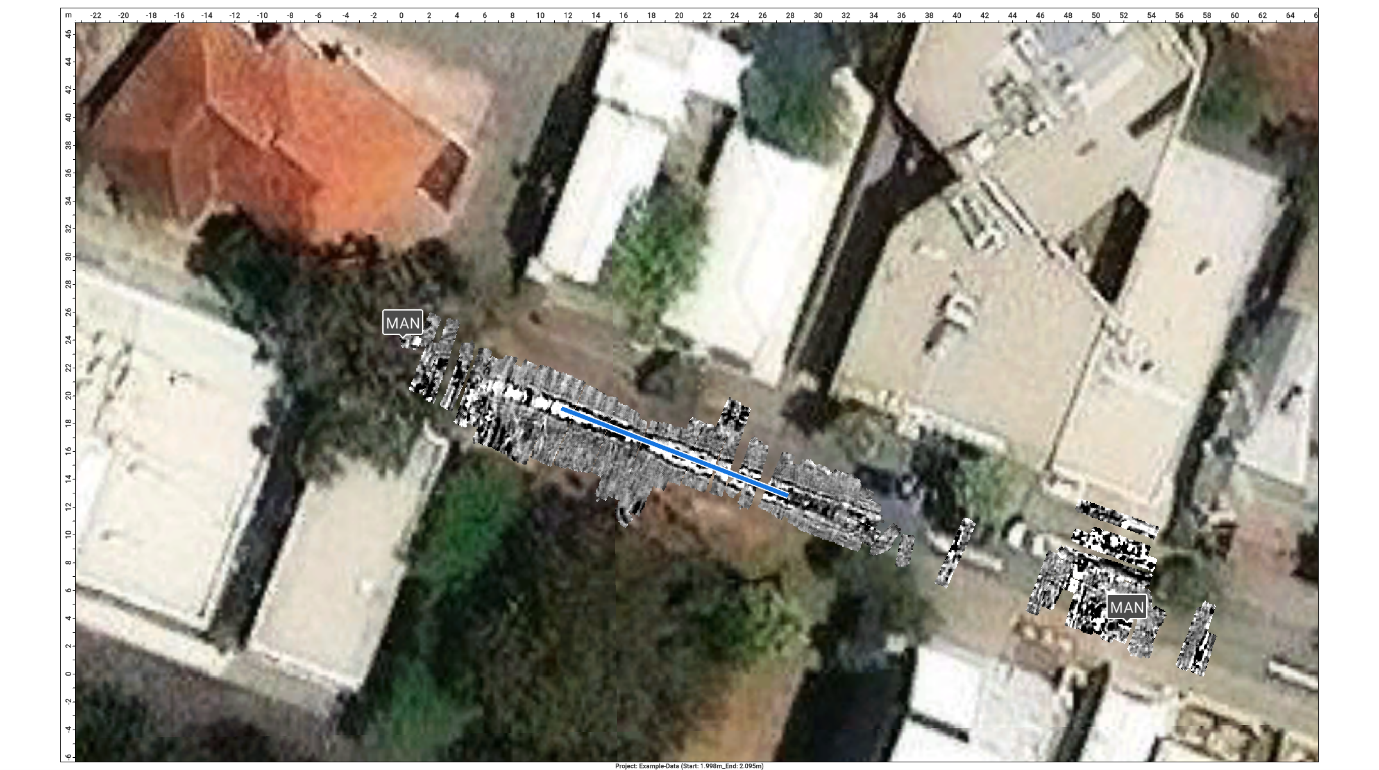
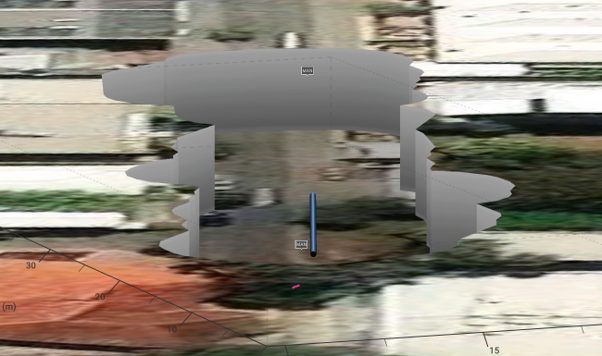
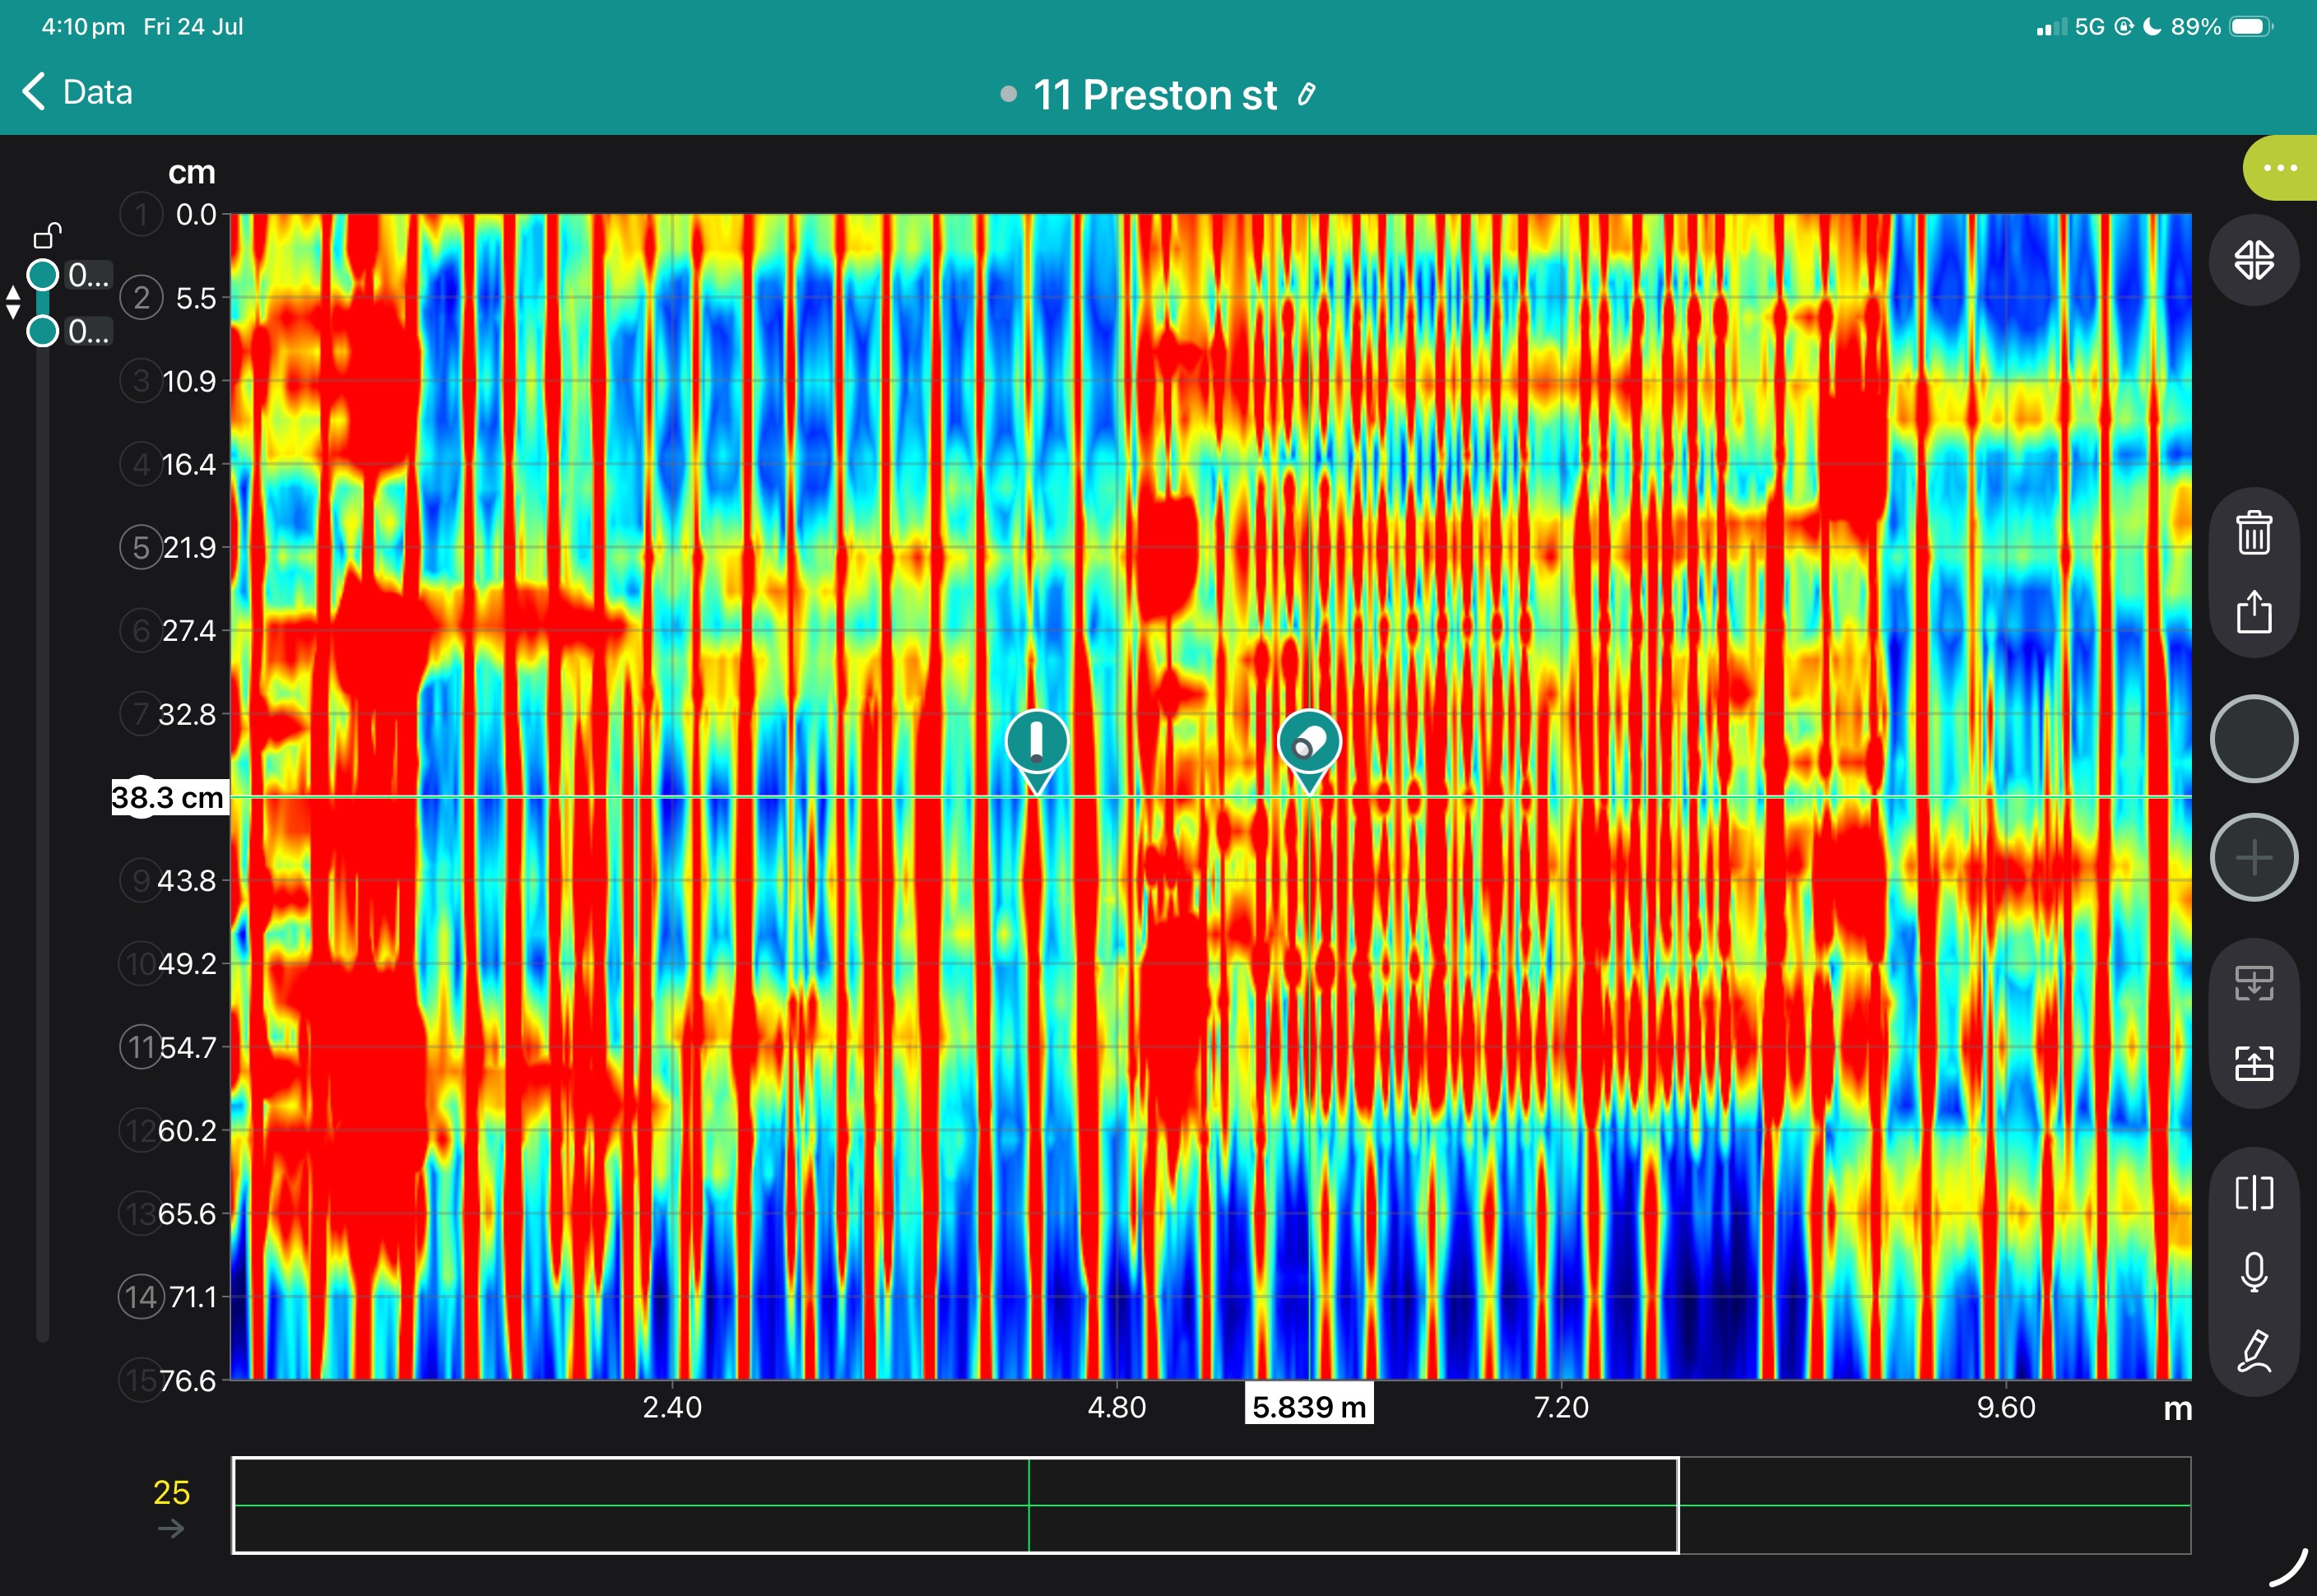
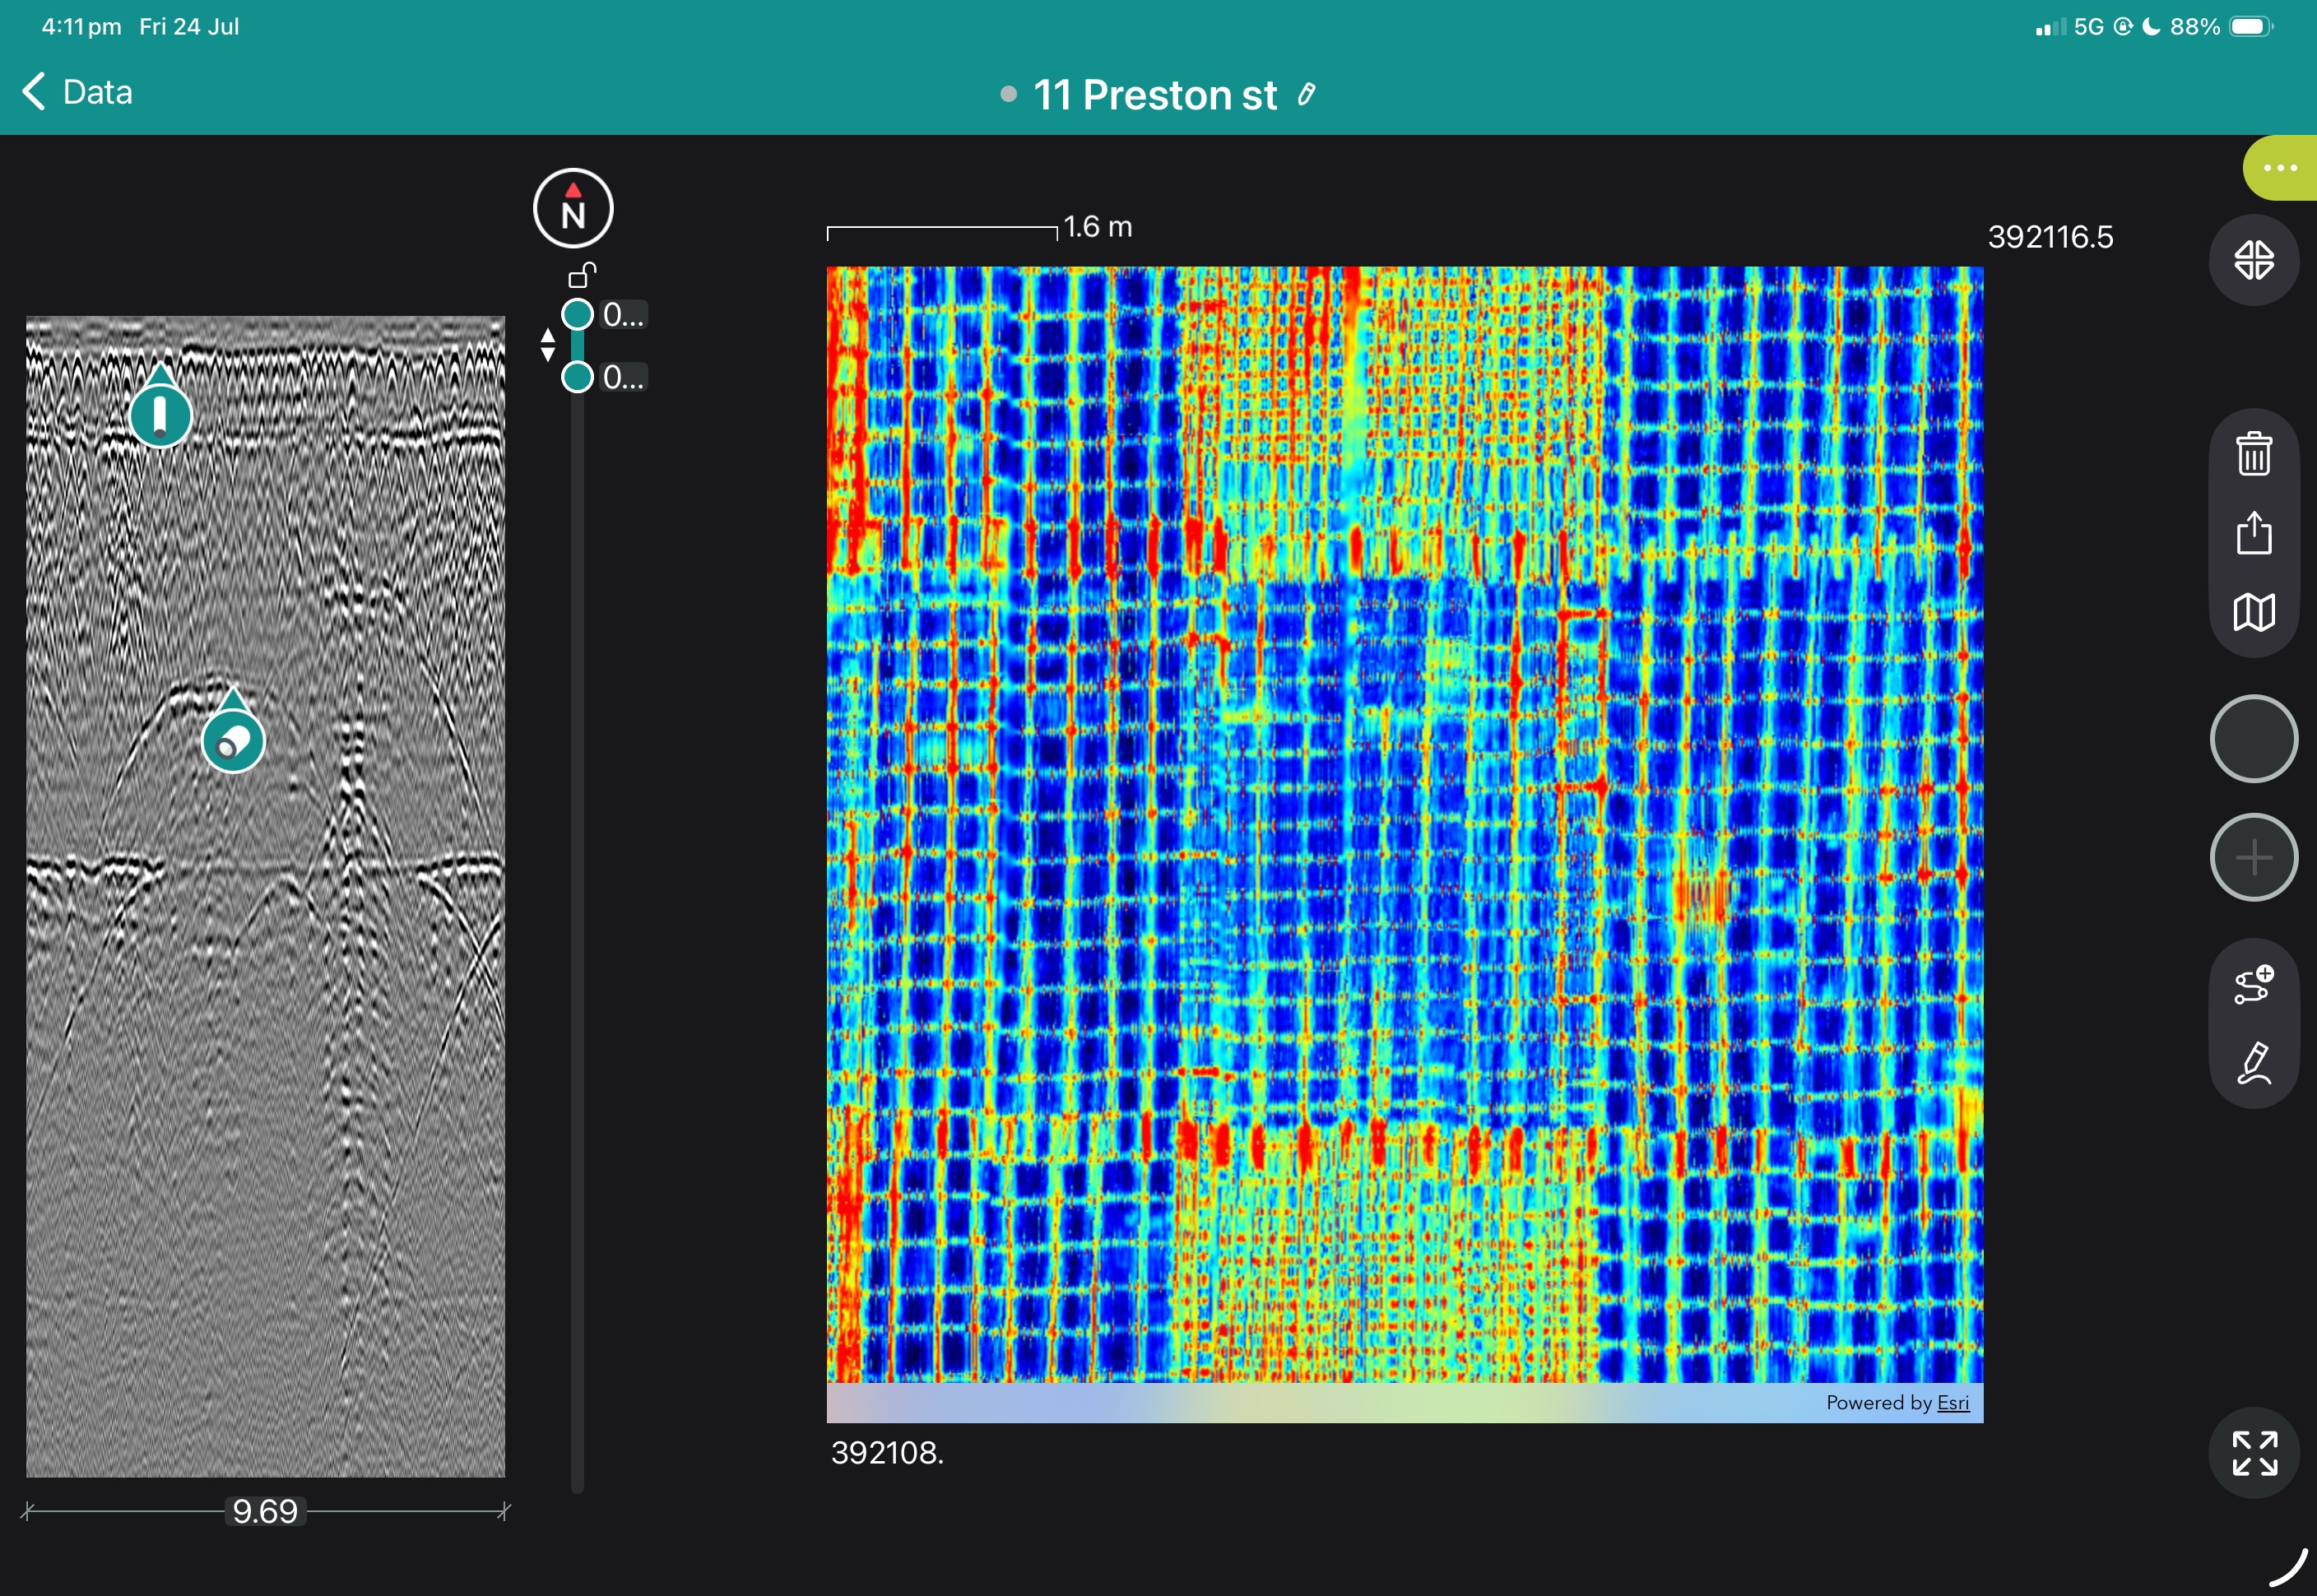
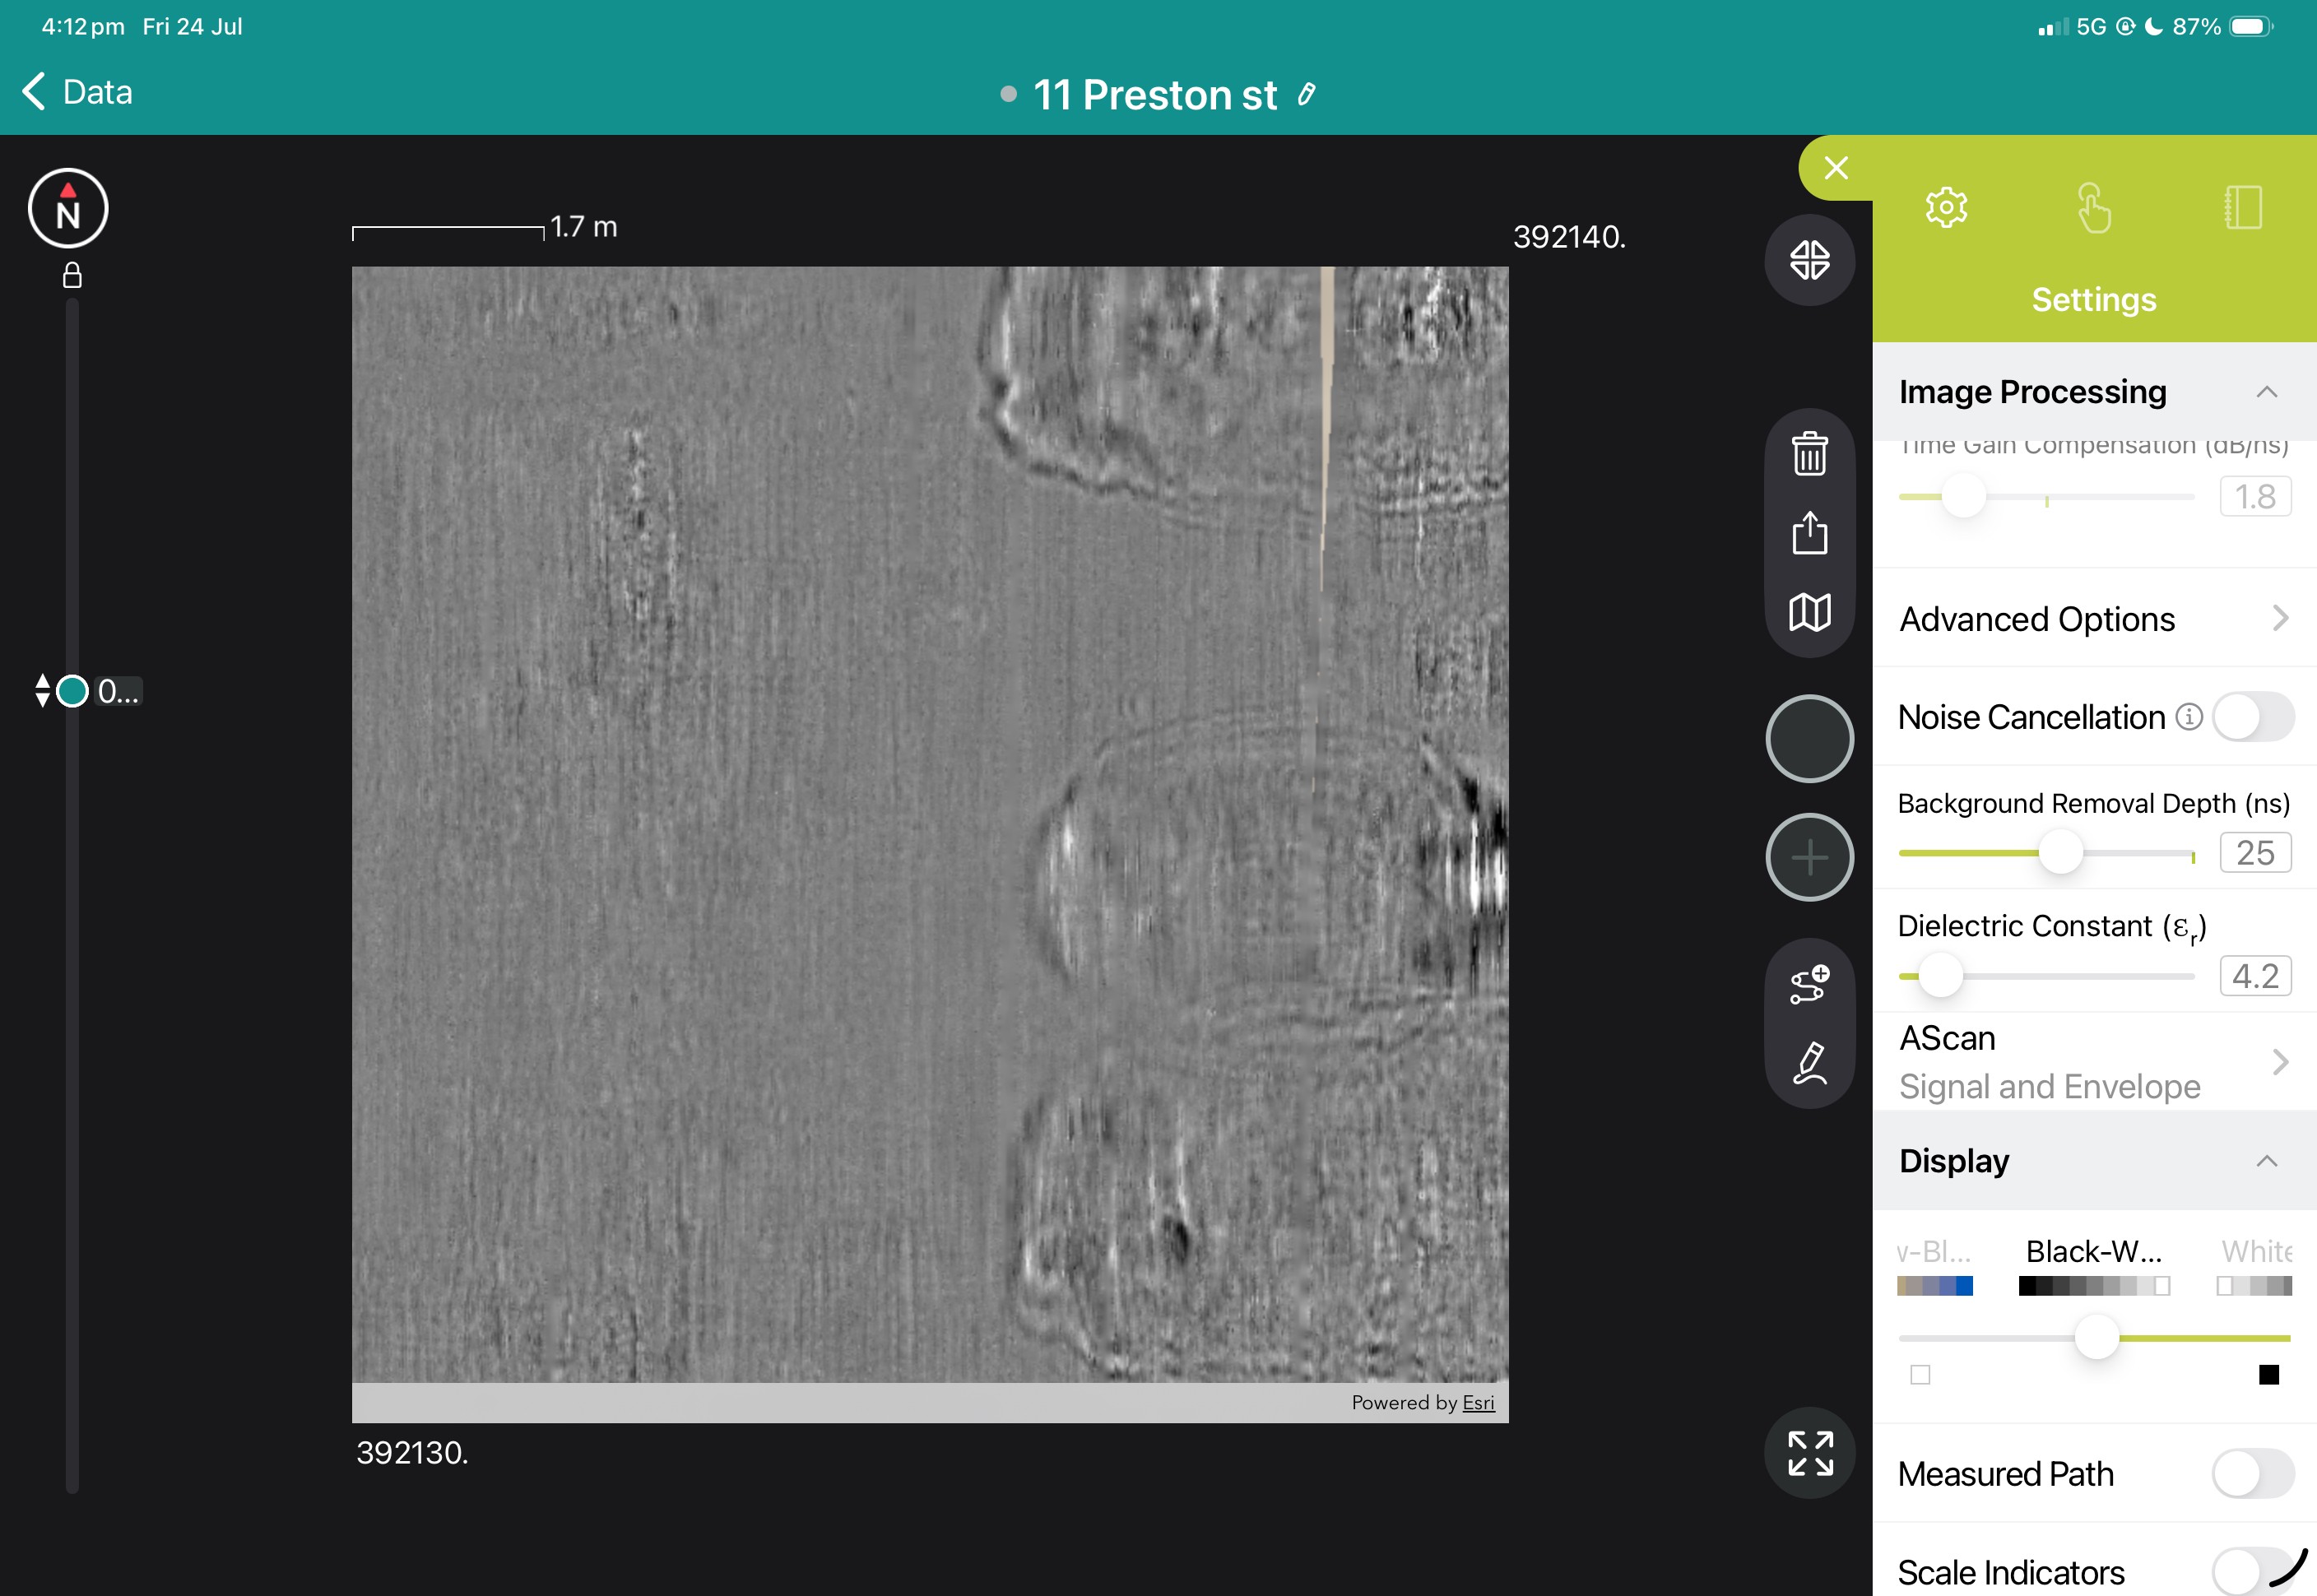
View the images below to see these in action.

INSITE loggers are made for the world´s toughest construction projects. Providing critical temperature profile and strength information so the best decisions can be made at exactly the right time.
These rugged loggers are designed with redundant systems and high temperature components to ensure they survive in the hottest, harshest concrete environments.
INSITE strikes a perfect balance between wired and wireless technologies, resulting in increased reliability, global accessibility, and every-job affordability. When combined with intelligent cloud-based software, InSite puts the concrete data you need in the palm of your hand.
INSITE loggers can run offline and be manually synchronised, or in real-time with continual connection to a Wireless Remote.
A single Base Station provides wireless coverage for a whole construction site using LoRa radio Just log in to your RPX account to access synchronised and live results from any PC or device.
Rugged InSite loggers gather the data you need to get the job done right and on-time.
These self-starting sensors detect fresh concrete and begin logging critical data at exactly the right moment.
Triple-redundant thermistors ensure the most precise temperature accuracy and provide peace of mind against data loss.
Temperature measurements are stored every 60 seconds for 180 days and concrete maturity is calculated using 1-minute temperature readings.
A simple option to activate, and collect data from self contained Insite Loggers.
The Pocket Reader connects to a WiFi network such as a phone hotspot, and downloads temperature data from Loggers, immediately uploading to Insite cloud software.
A Pocket Reader is able to connect to any number of loggers, downloading temperature and maturity data.
When required a reader may be used away from wireless networks, and manually uploaded later.
Data delivery you can trust and power you can rely on.
Insite Wireless Remotes use LoRa radios that extend ranges and use less power expanding your ability to send data and letting you worry less about keeping them going.
Remotes can be set to send data at different intervals so that you can gather critical data more often, or monitor less critical locations less frequently. All Remotes are powered by low-cost, easy to find AA batteries making them powerful and convenient!
The InSite cloud-based software presents you with up to the minute concrete data. Current temperatures and strengths for loggers are easy to access and graph so you know exactly what is happening at any moment.
Alerts can be set to warn you of high or low temperatures, strength thresholds, differential temperatures when monitoring mass pours. All delivered to you via email or text.
INSITE loggers are more durable and simpler to operate than a thermocouple based system, benefits include:
Book a SUE Workflow Demonstration
The GX1 transforms the GS9000 into a high-resolution structural assessment system for concrete slabs, bridge decks and pavements. Its dense, dual-polarisation array captures detailed 3D data across wide areas, supporting reinforcement and cover mapping, moisture and deterioration assessment, and analysis of asphalt and pavement layers. Live visualisation helps confirm survey coverage on site, while post-processing tools produce clear, report-ready condition maps.
1. Define the inspection area
Import the structure, bridge, pavement or survey background.
2. Collect closely spaced profiles
Capture 35 longitudinal and 15 cross-polarised channels with dense spacing.
3. Review coverage in the field
Use live radargrams and time slices to confirm that the required area has been captured.
4. Process the dataset
Apply velocity, gain, background removal, migration, filtering and topographic correction as appropriate.
5. Generate diagnostic maps
Create depth slices, reinforcement maps, layer information or application-specific condition maps.
6. Integrate with the engineering assessment
Export figures, mapped anomalies and raw data for inclusion in the engineer’s final interpretation and report.
Field information
Processed Diagnostic Information
Engineering deliverables
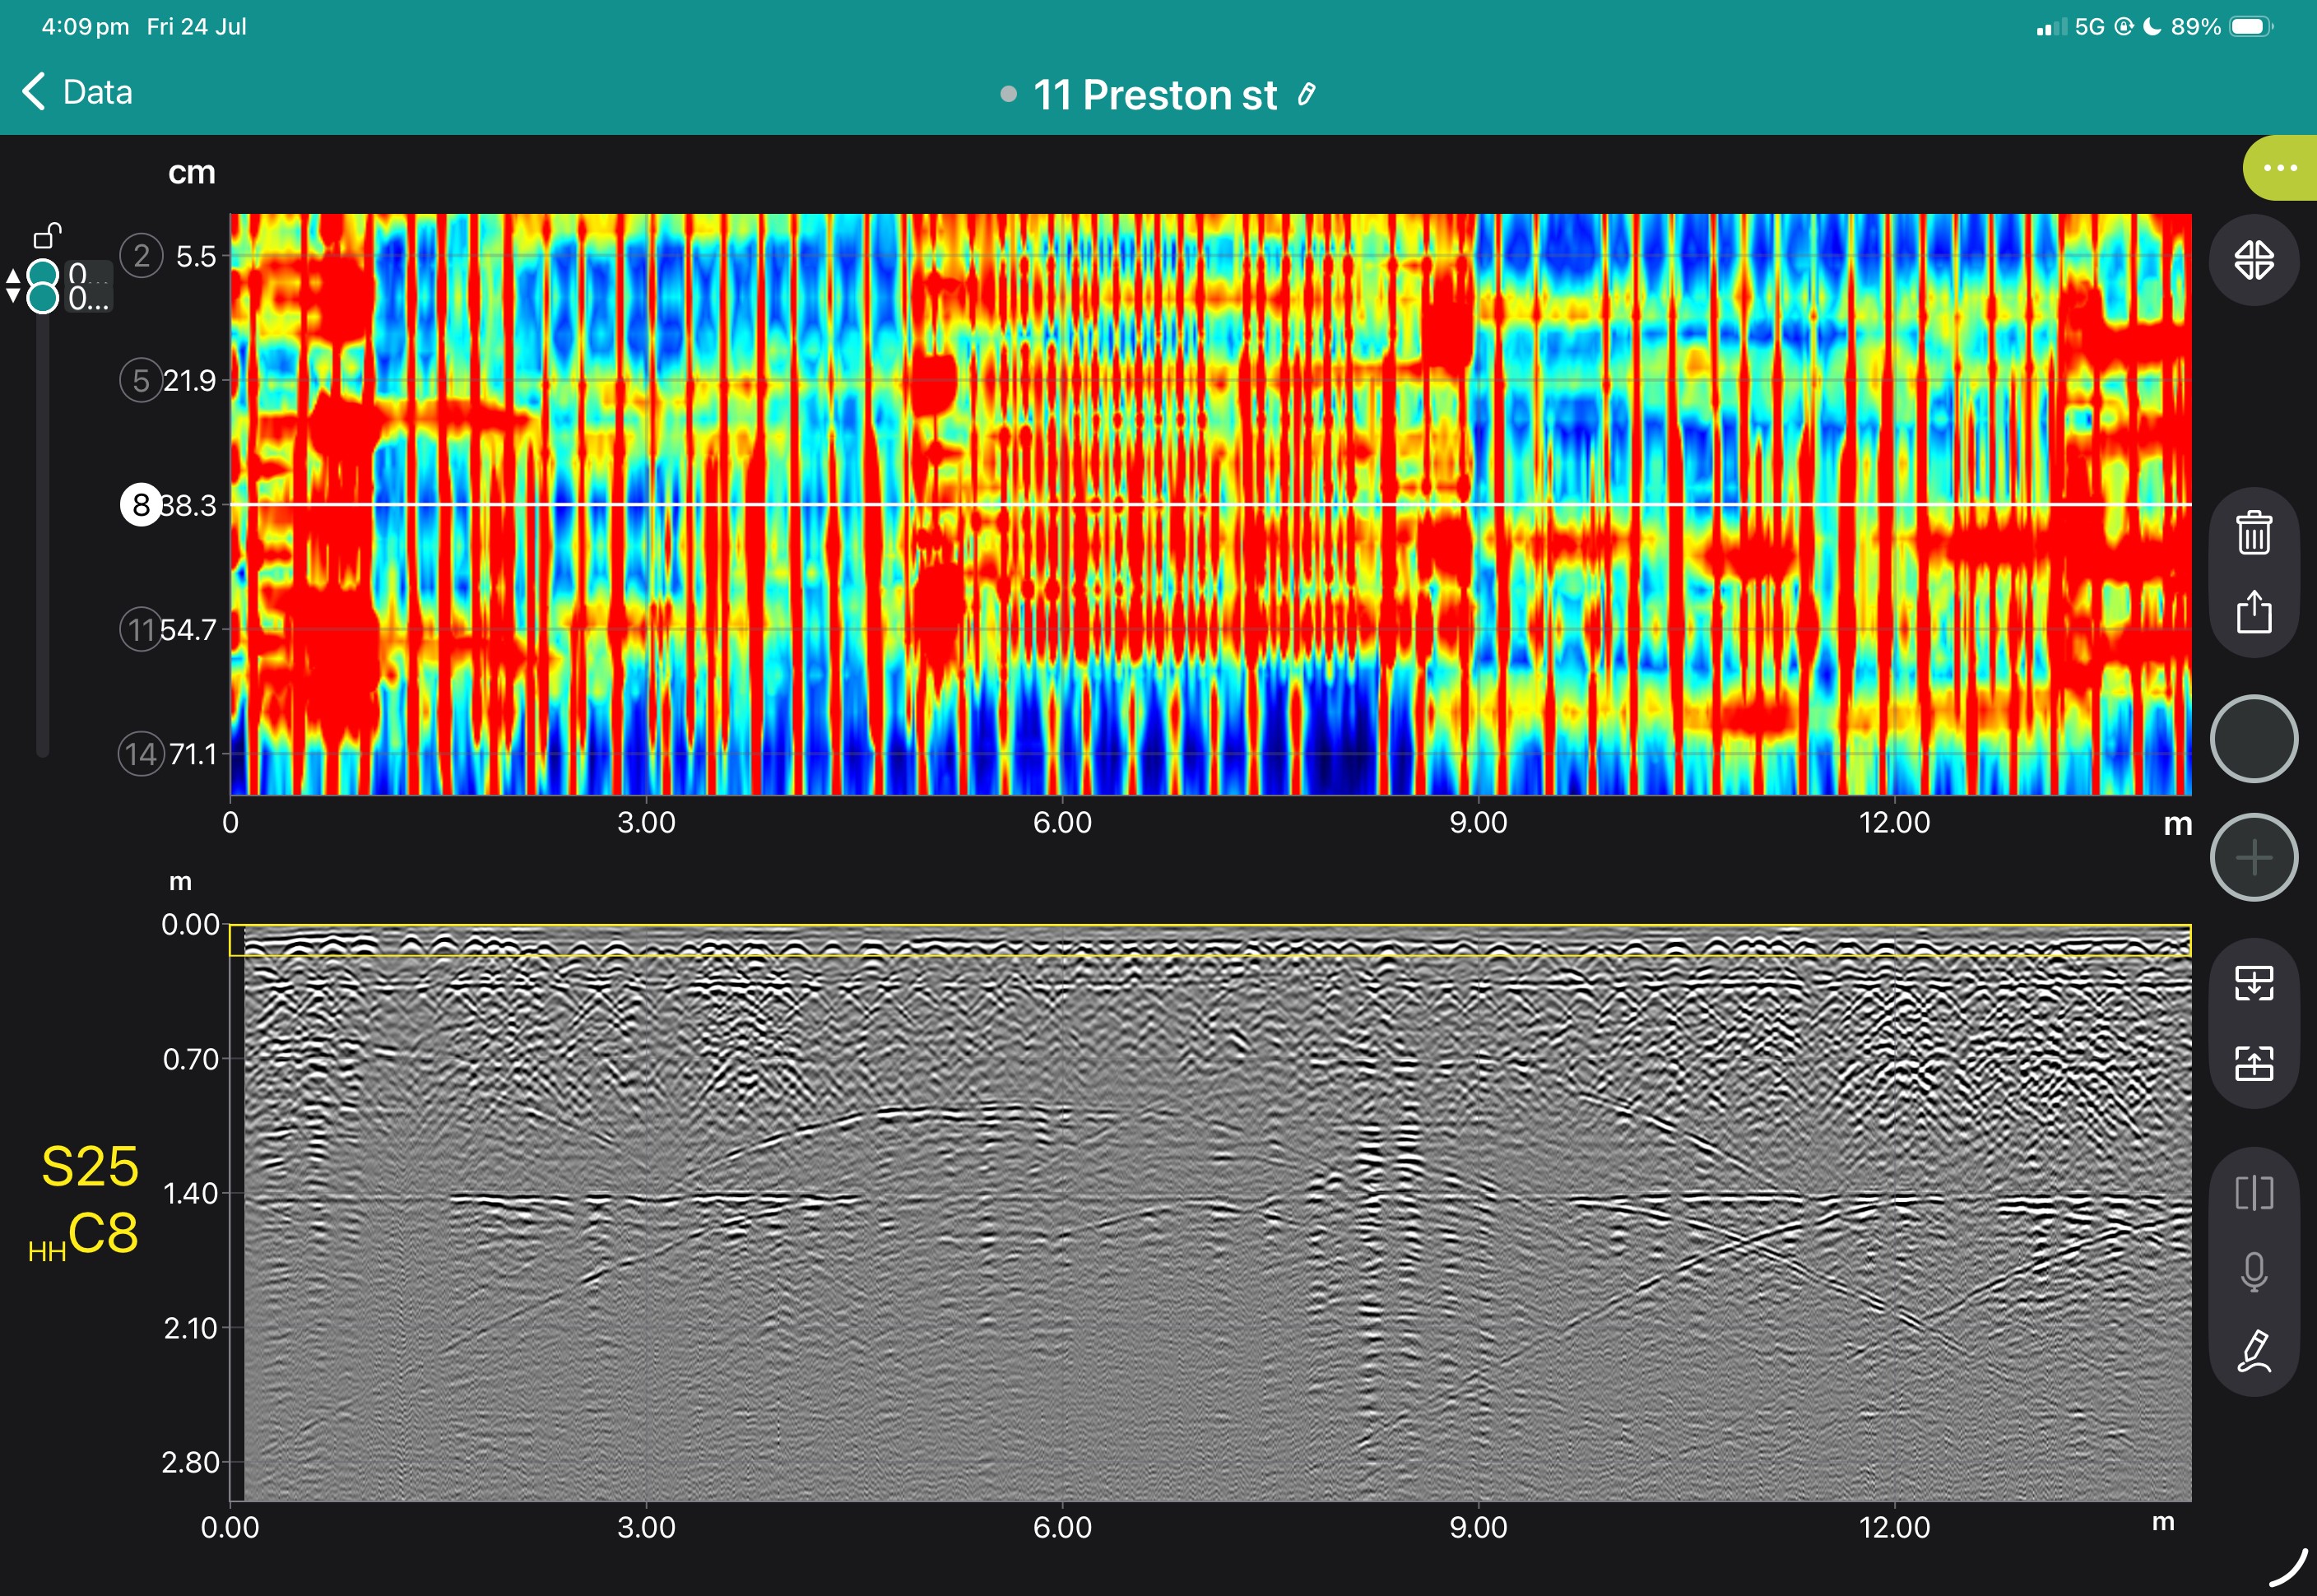
View some of these features at work below, and our case study if you'd like to see more of what the GS9000 can do.




Book a Structural Assessment Demonstration
GS9000 cart with:

This quick start guide show the user how to first set up their Insite Pocket Reader to connect to a WiFi Network.
A full operational guide for INSITE's Pocket Reader.