%20vector%20logo.svg)

Phone: 02 9453 9999 or Email: sales-operations@pcte.com.au

Laarmann Test sieves are produced to comply with the specifications set out by the world's most demanding Standards.
Overview | GX1 vs GX2 | SUE & Utilities | Structures & Pavements | Software & Outputs | Case Studies | Specifications | Support
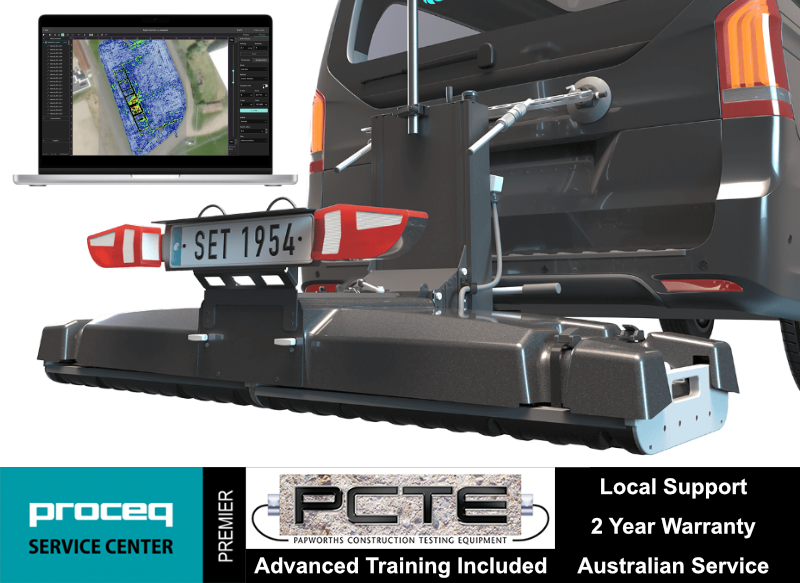
Collect high-density, georeferenced GPR data across wide areas and view the subsurface in 3D as you scan. Choose the GX2 array for SUE and utility mapping, or the GX1 array for structural, bridge and pavement investigations.
Best suited to:
Best suited to:
Recommended array: GX2
Recommended array: GX1
Cover more ground
Collect multiple parallel profiles in one pass instead of uilding a grid line by line.
See results during acquisition
View georeferenced radargrams and time-slice information in the field rather than waiting until the data is returned to the office.
Produce repeatable mapped data
Combine wheel-positioned GPR data with GNSS, project coordinates and survey linework.
Use one platform for two very different applications
Exchange GX1 and GX2 arrays without purchasing two complete cart platforms.
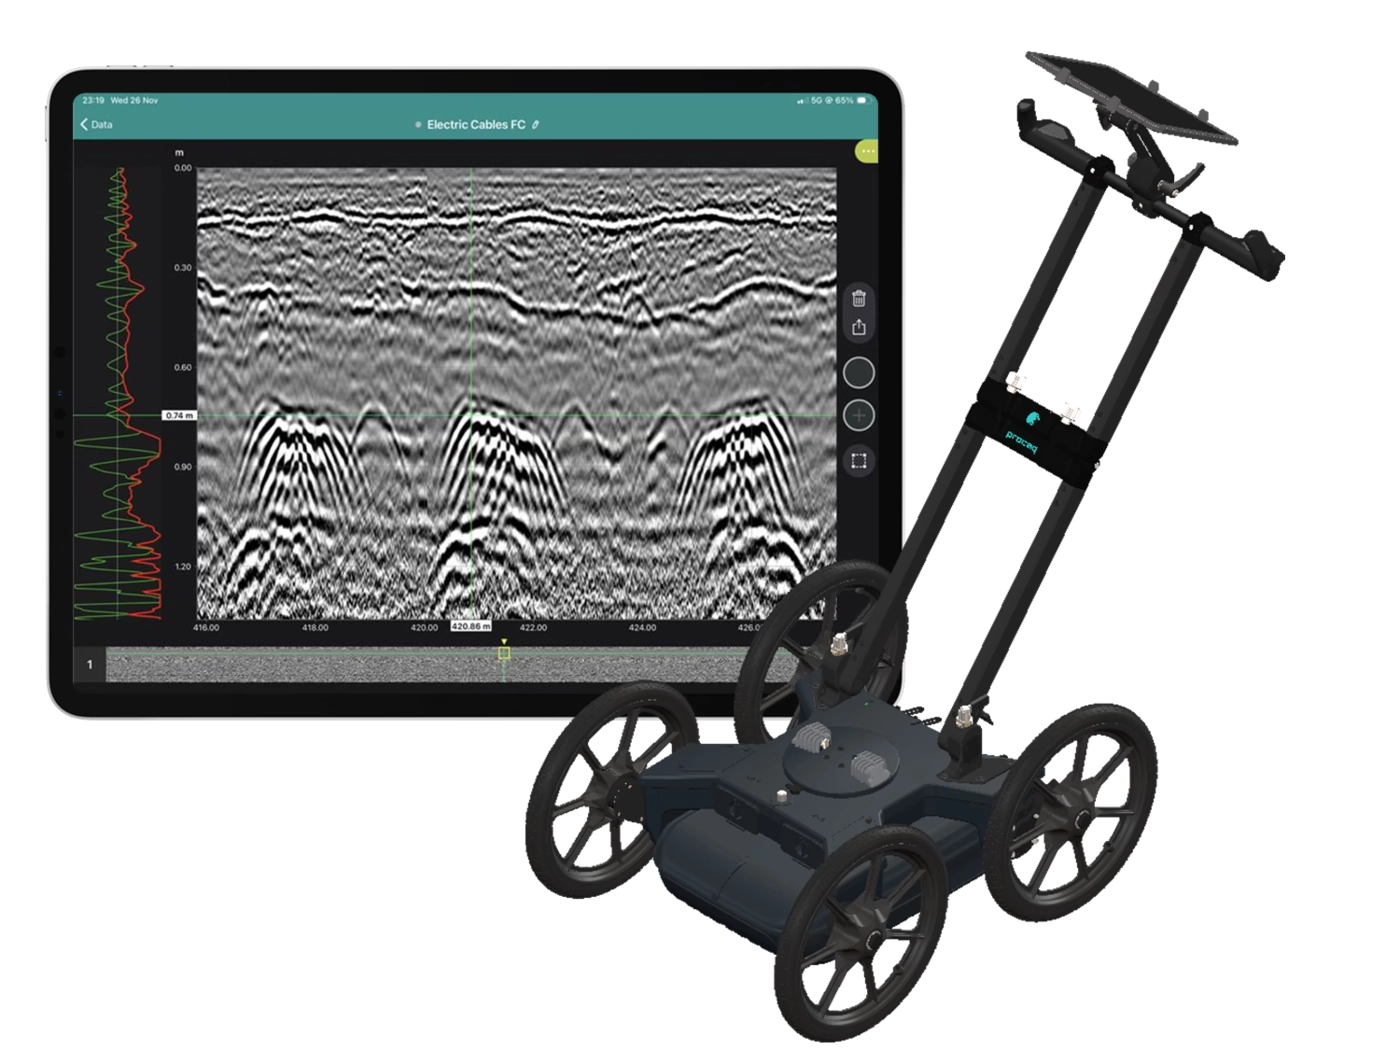
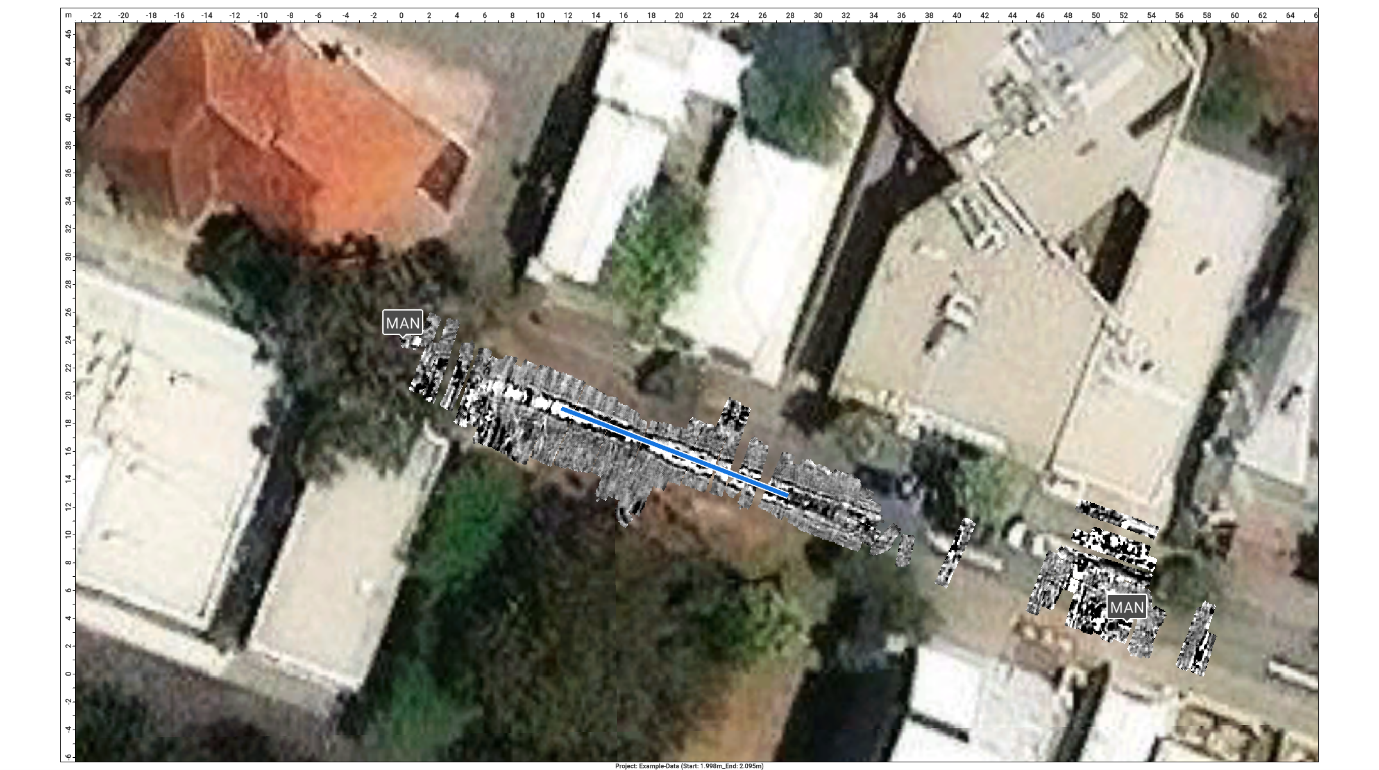
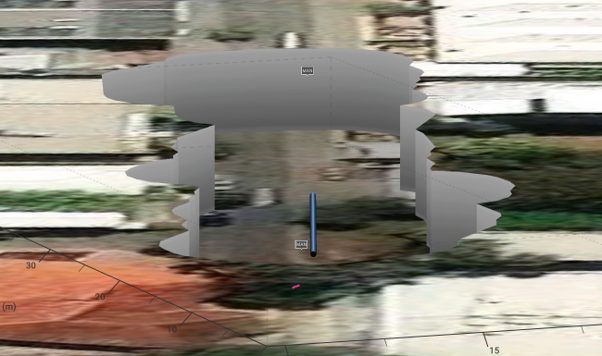
The GX2 transforms the GS9000 into a high-density subsurface utility mapping system. Its 11-channel, low-frequency GPR array captures an 83 cm-wide swath in each pass, helping operators detect and map buried pipes, ducts, cables, voids and other subsurface features. Live georeferenced data lets SUE teams review coverage on site and produce accurate CAD, GIS and project-coordinate deliverables.
1. Plan the survey
Load satellite imagery, CAD information, project coordinates or survey control.
2. Collect dense multichannel data
Survey an approximately 0.82 m-wide swath with 11 channels in each pass.
3. Review data live
Examine radargrams, georeferenced time slices and marked features while still on site.
4. Interpret and digitise
Add points, linework, tags, photographs and field observations.
5. Process and deliver
Merge survey areas, apply processing and export mapped information for the customer’s CAD, GIS or reporting workflow.
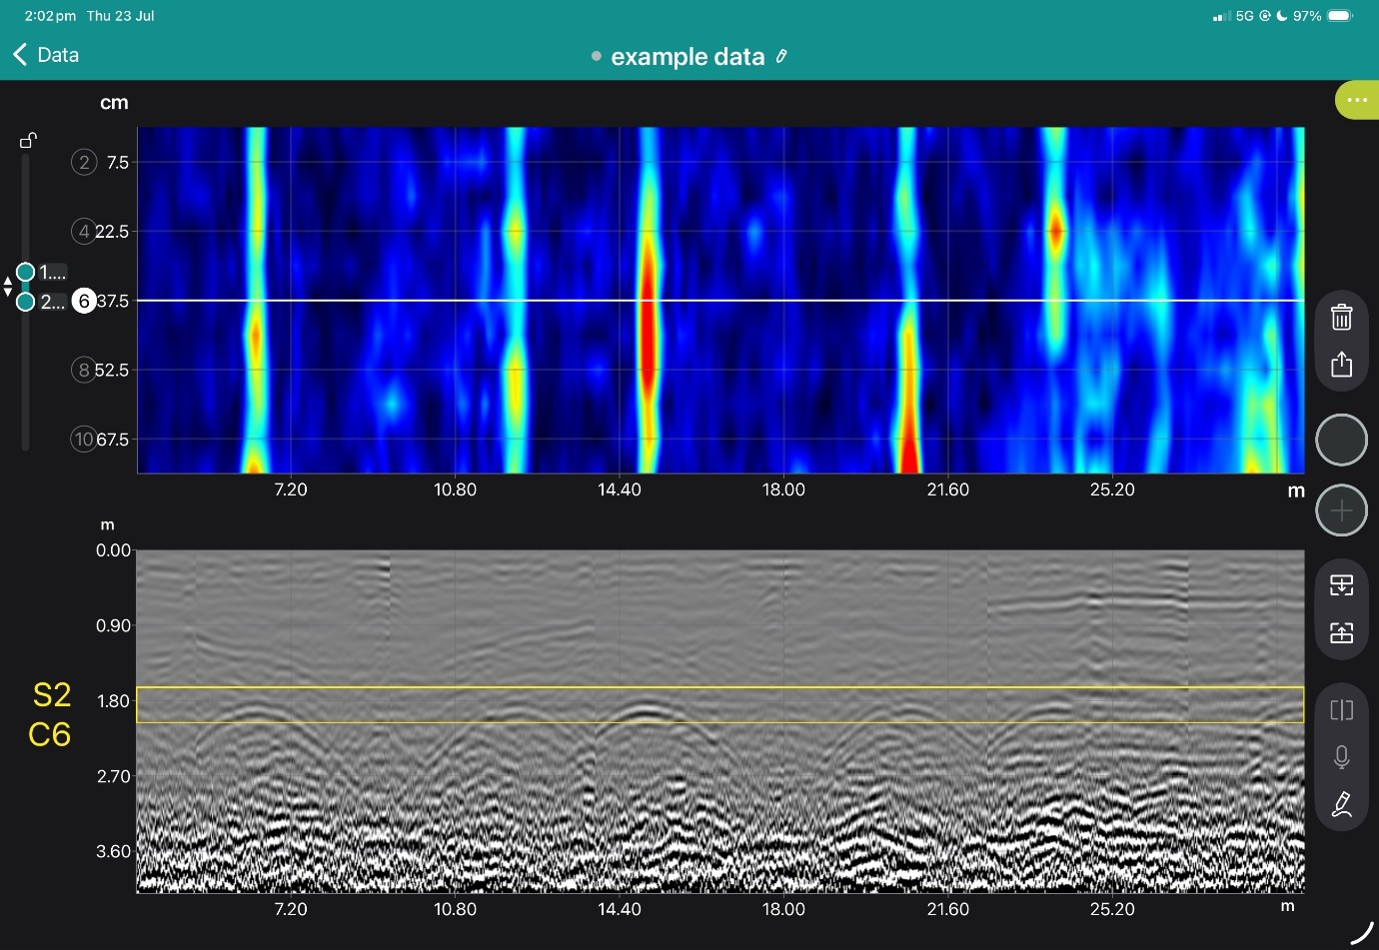
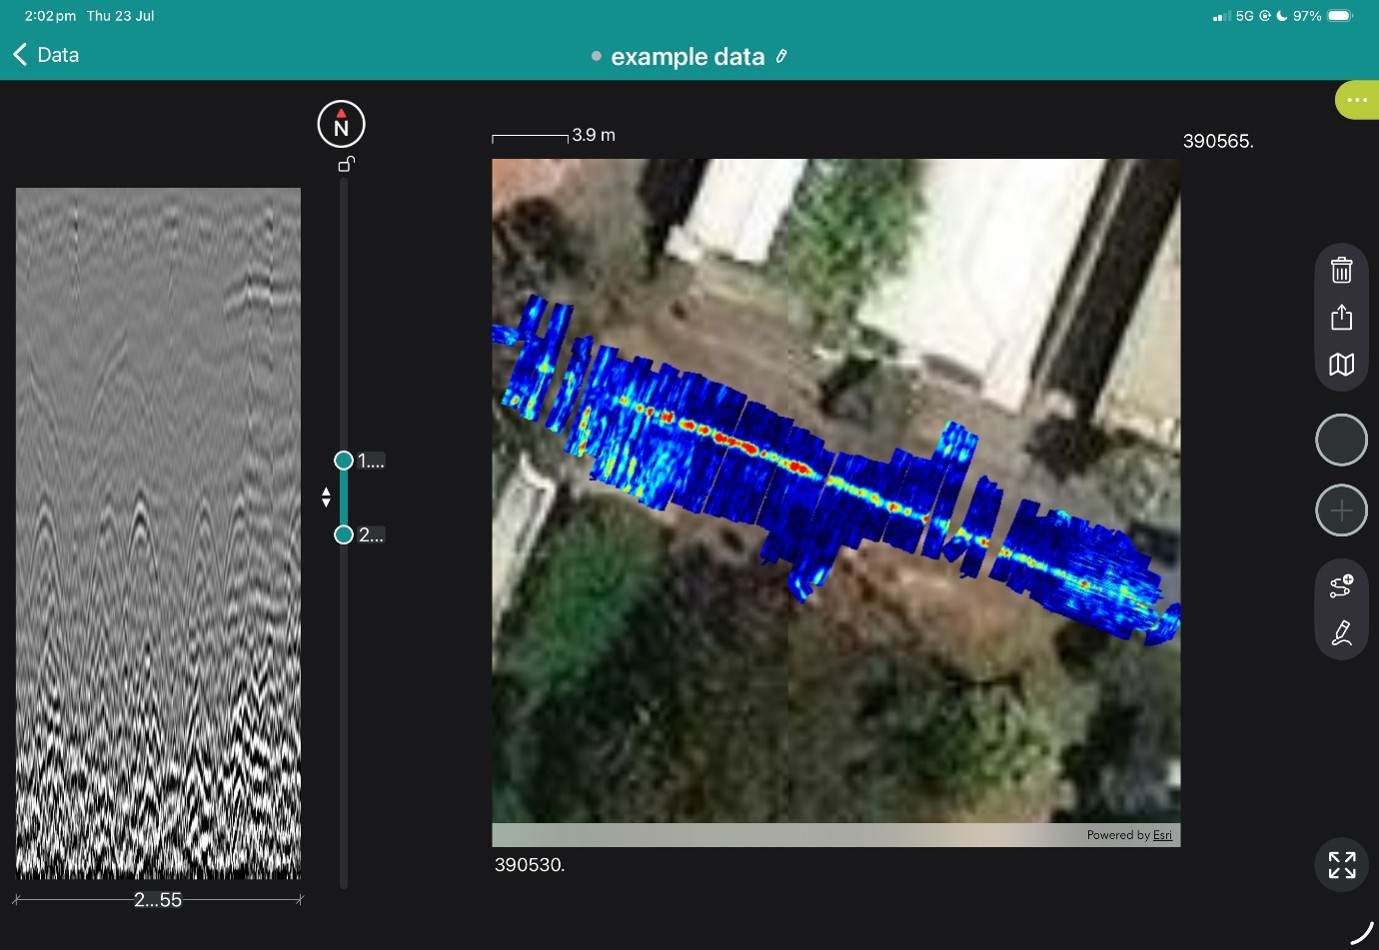
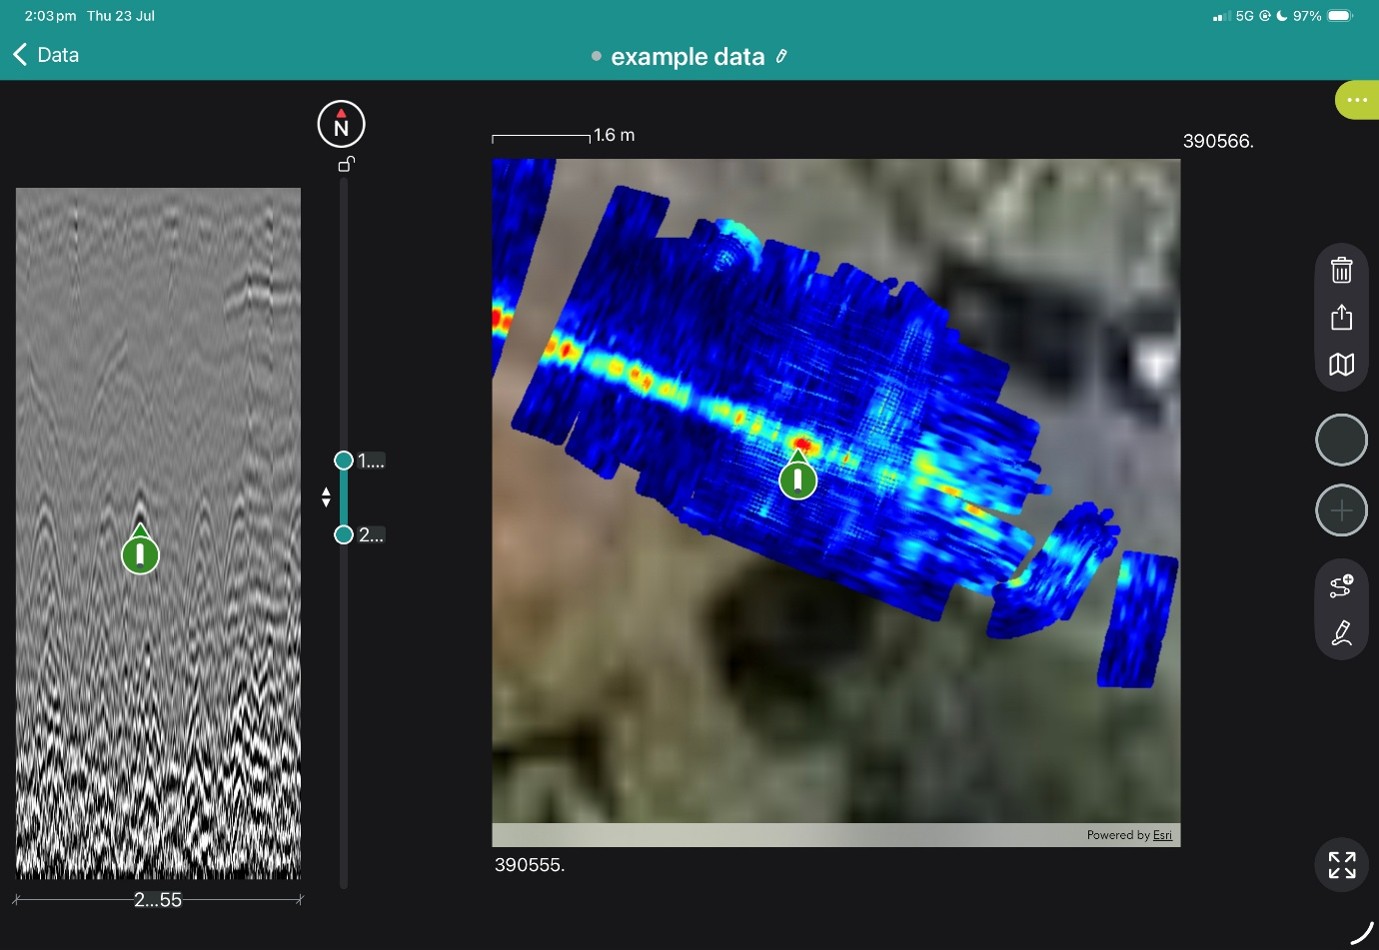
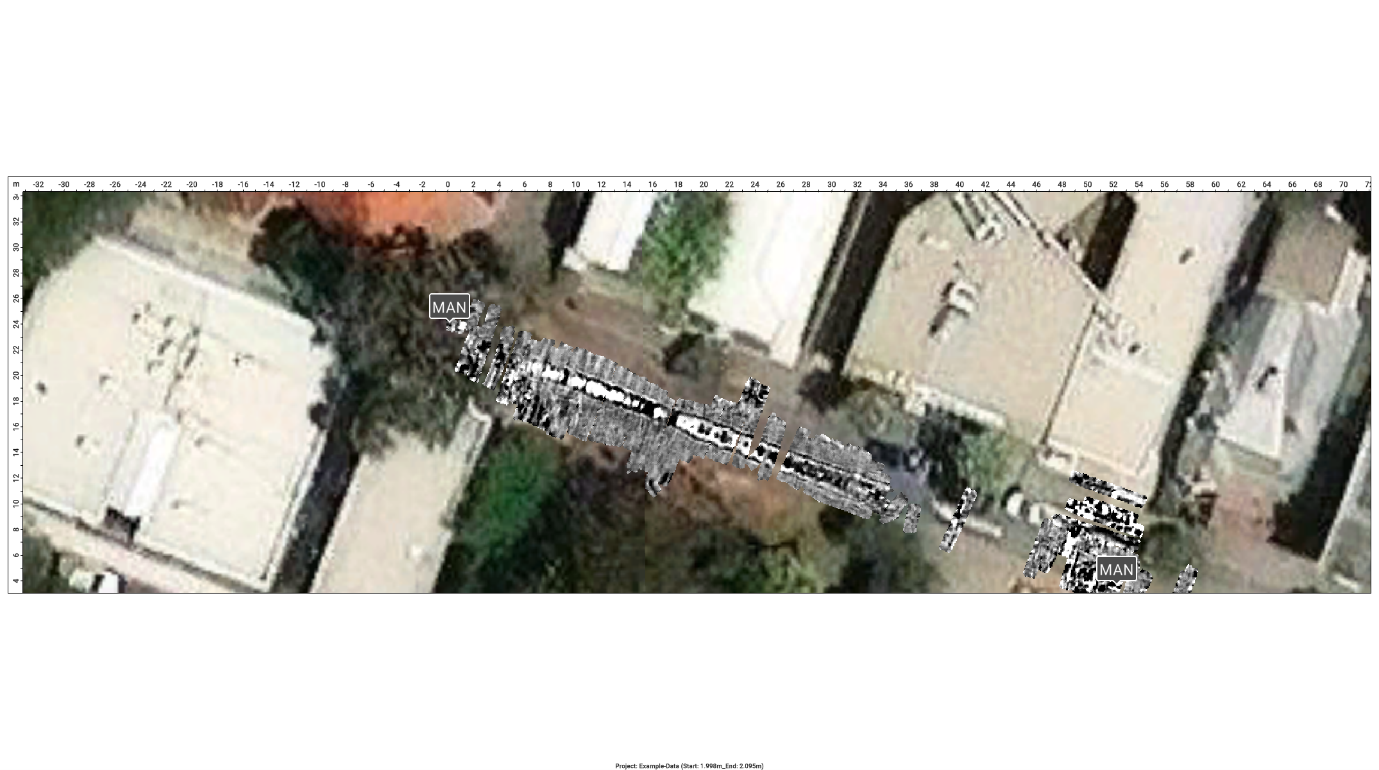
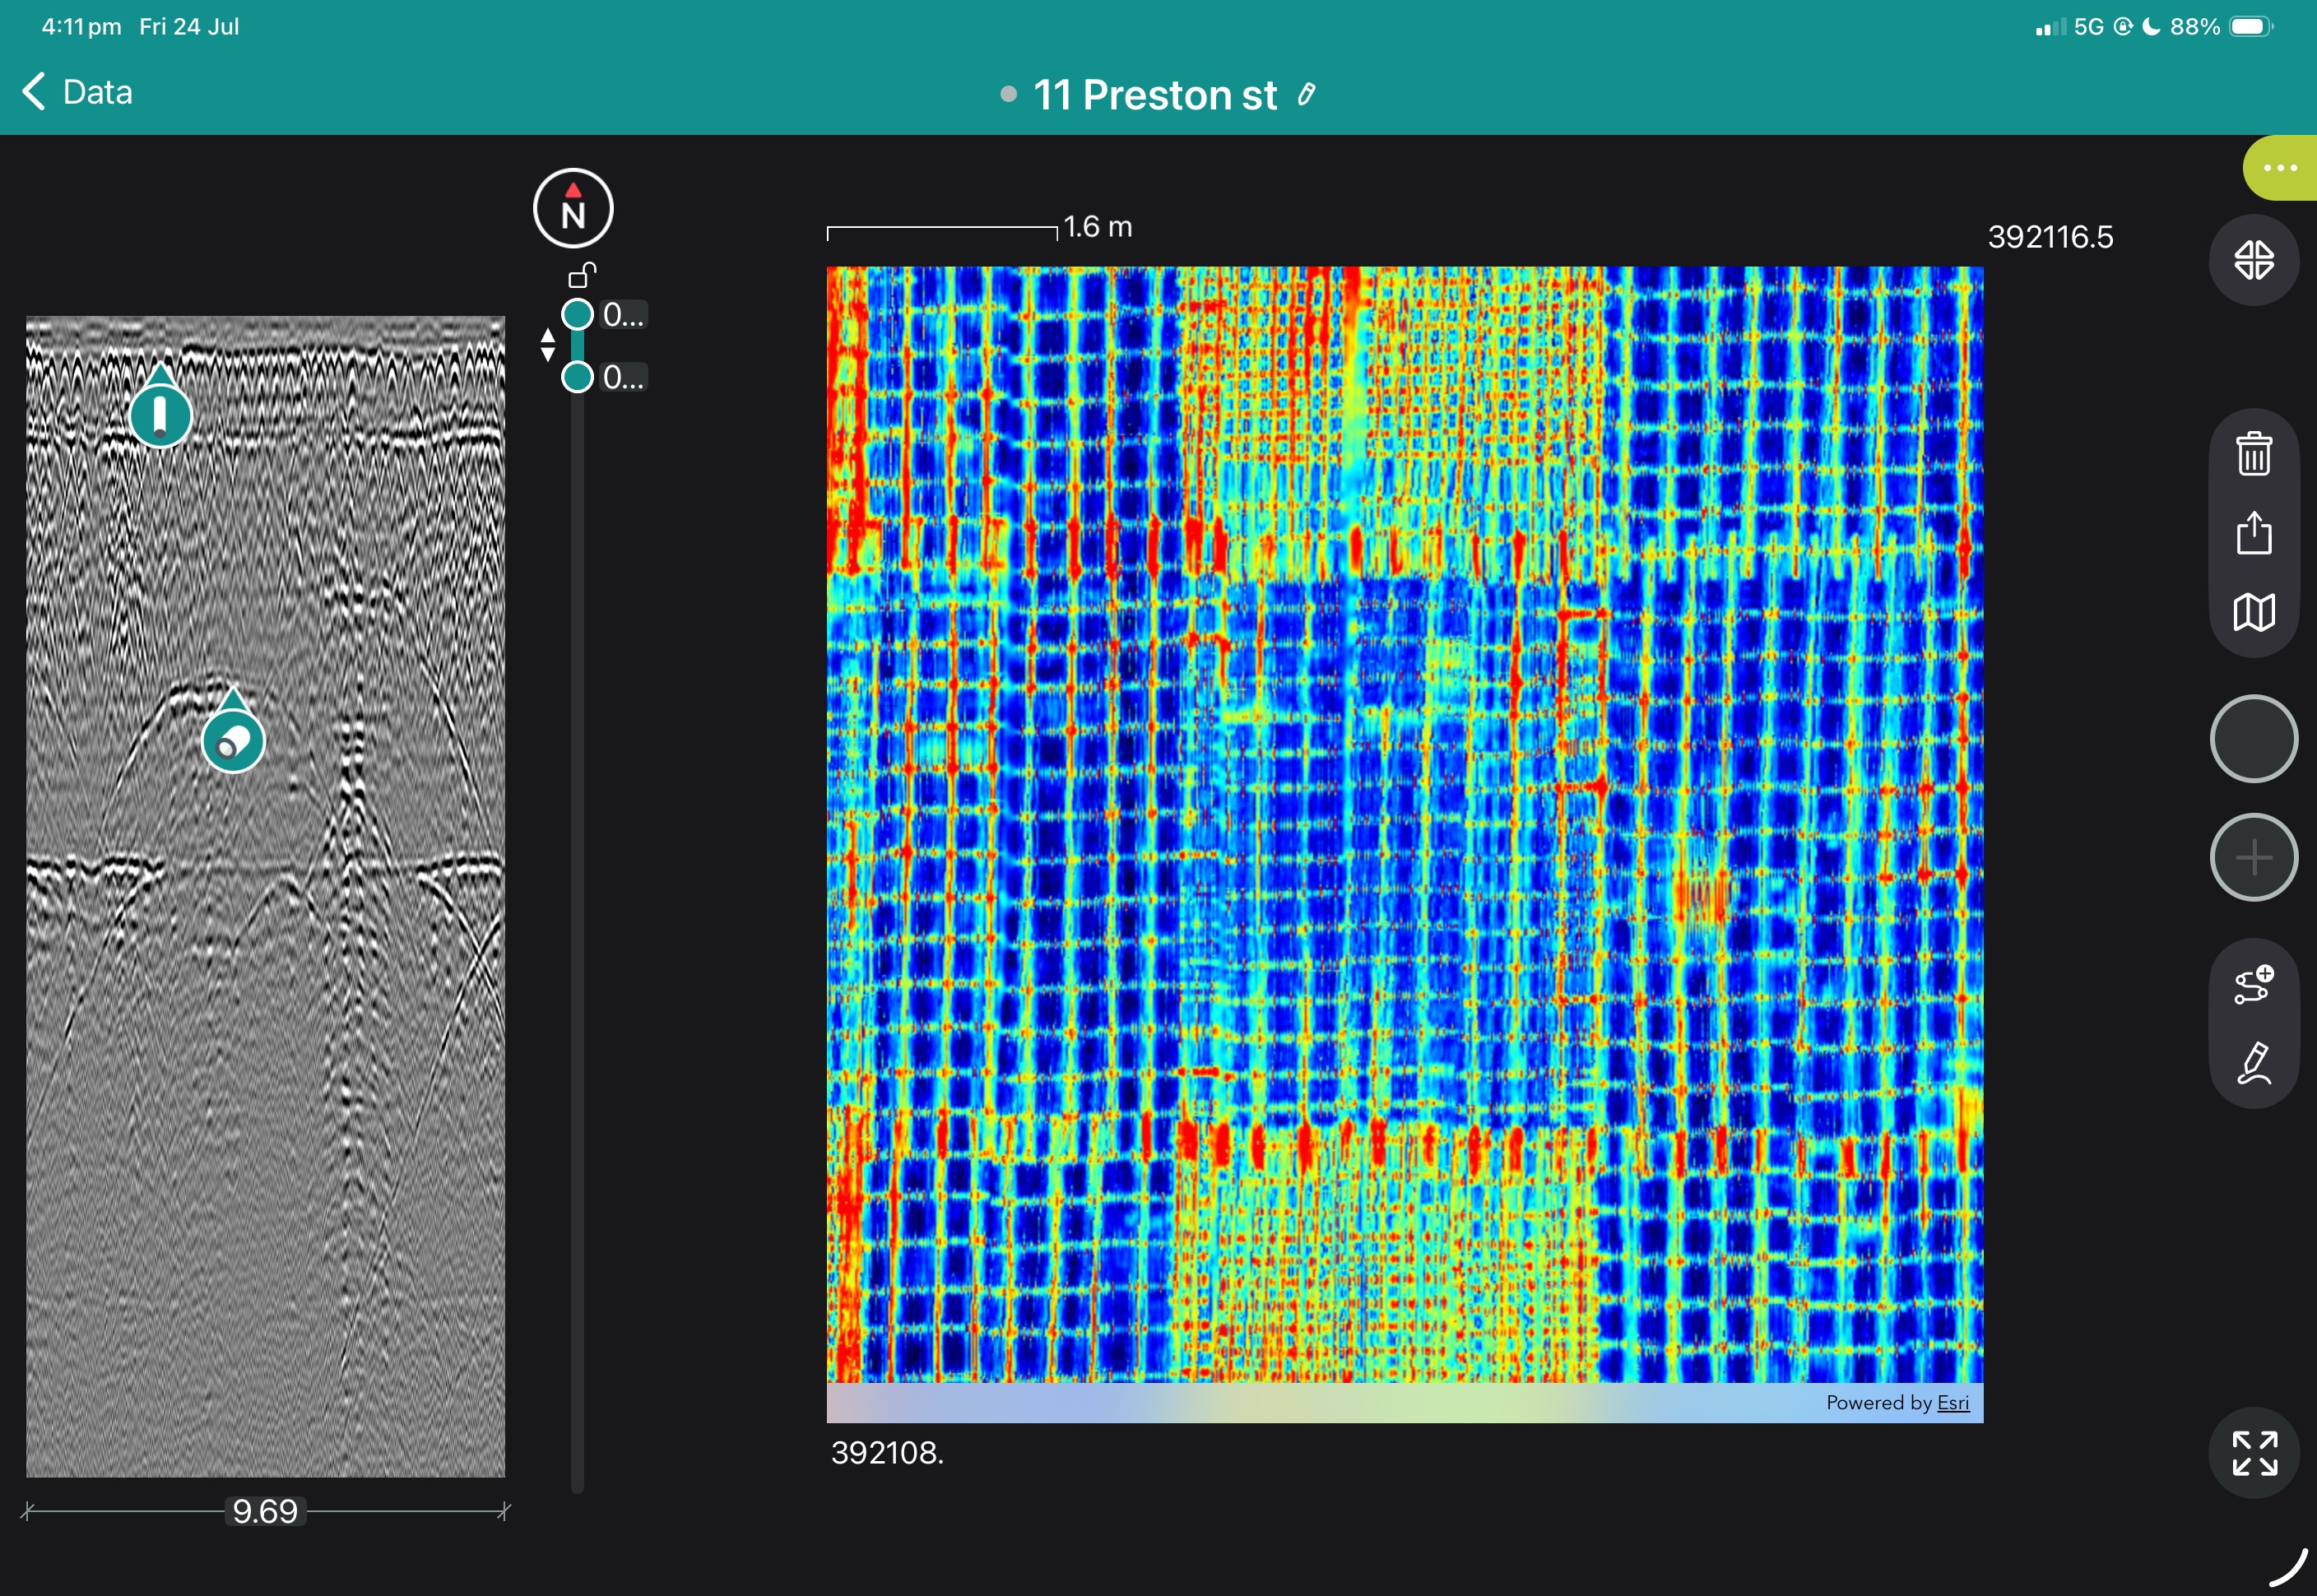
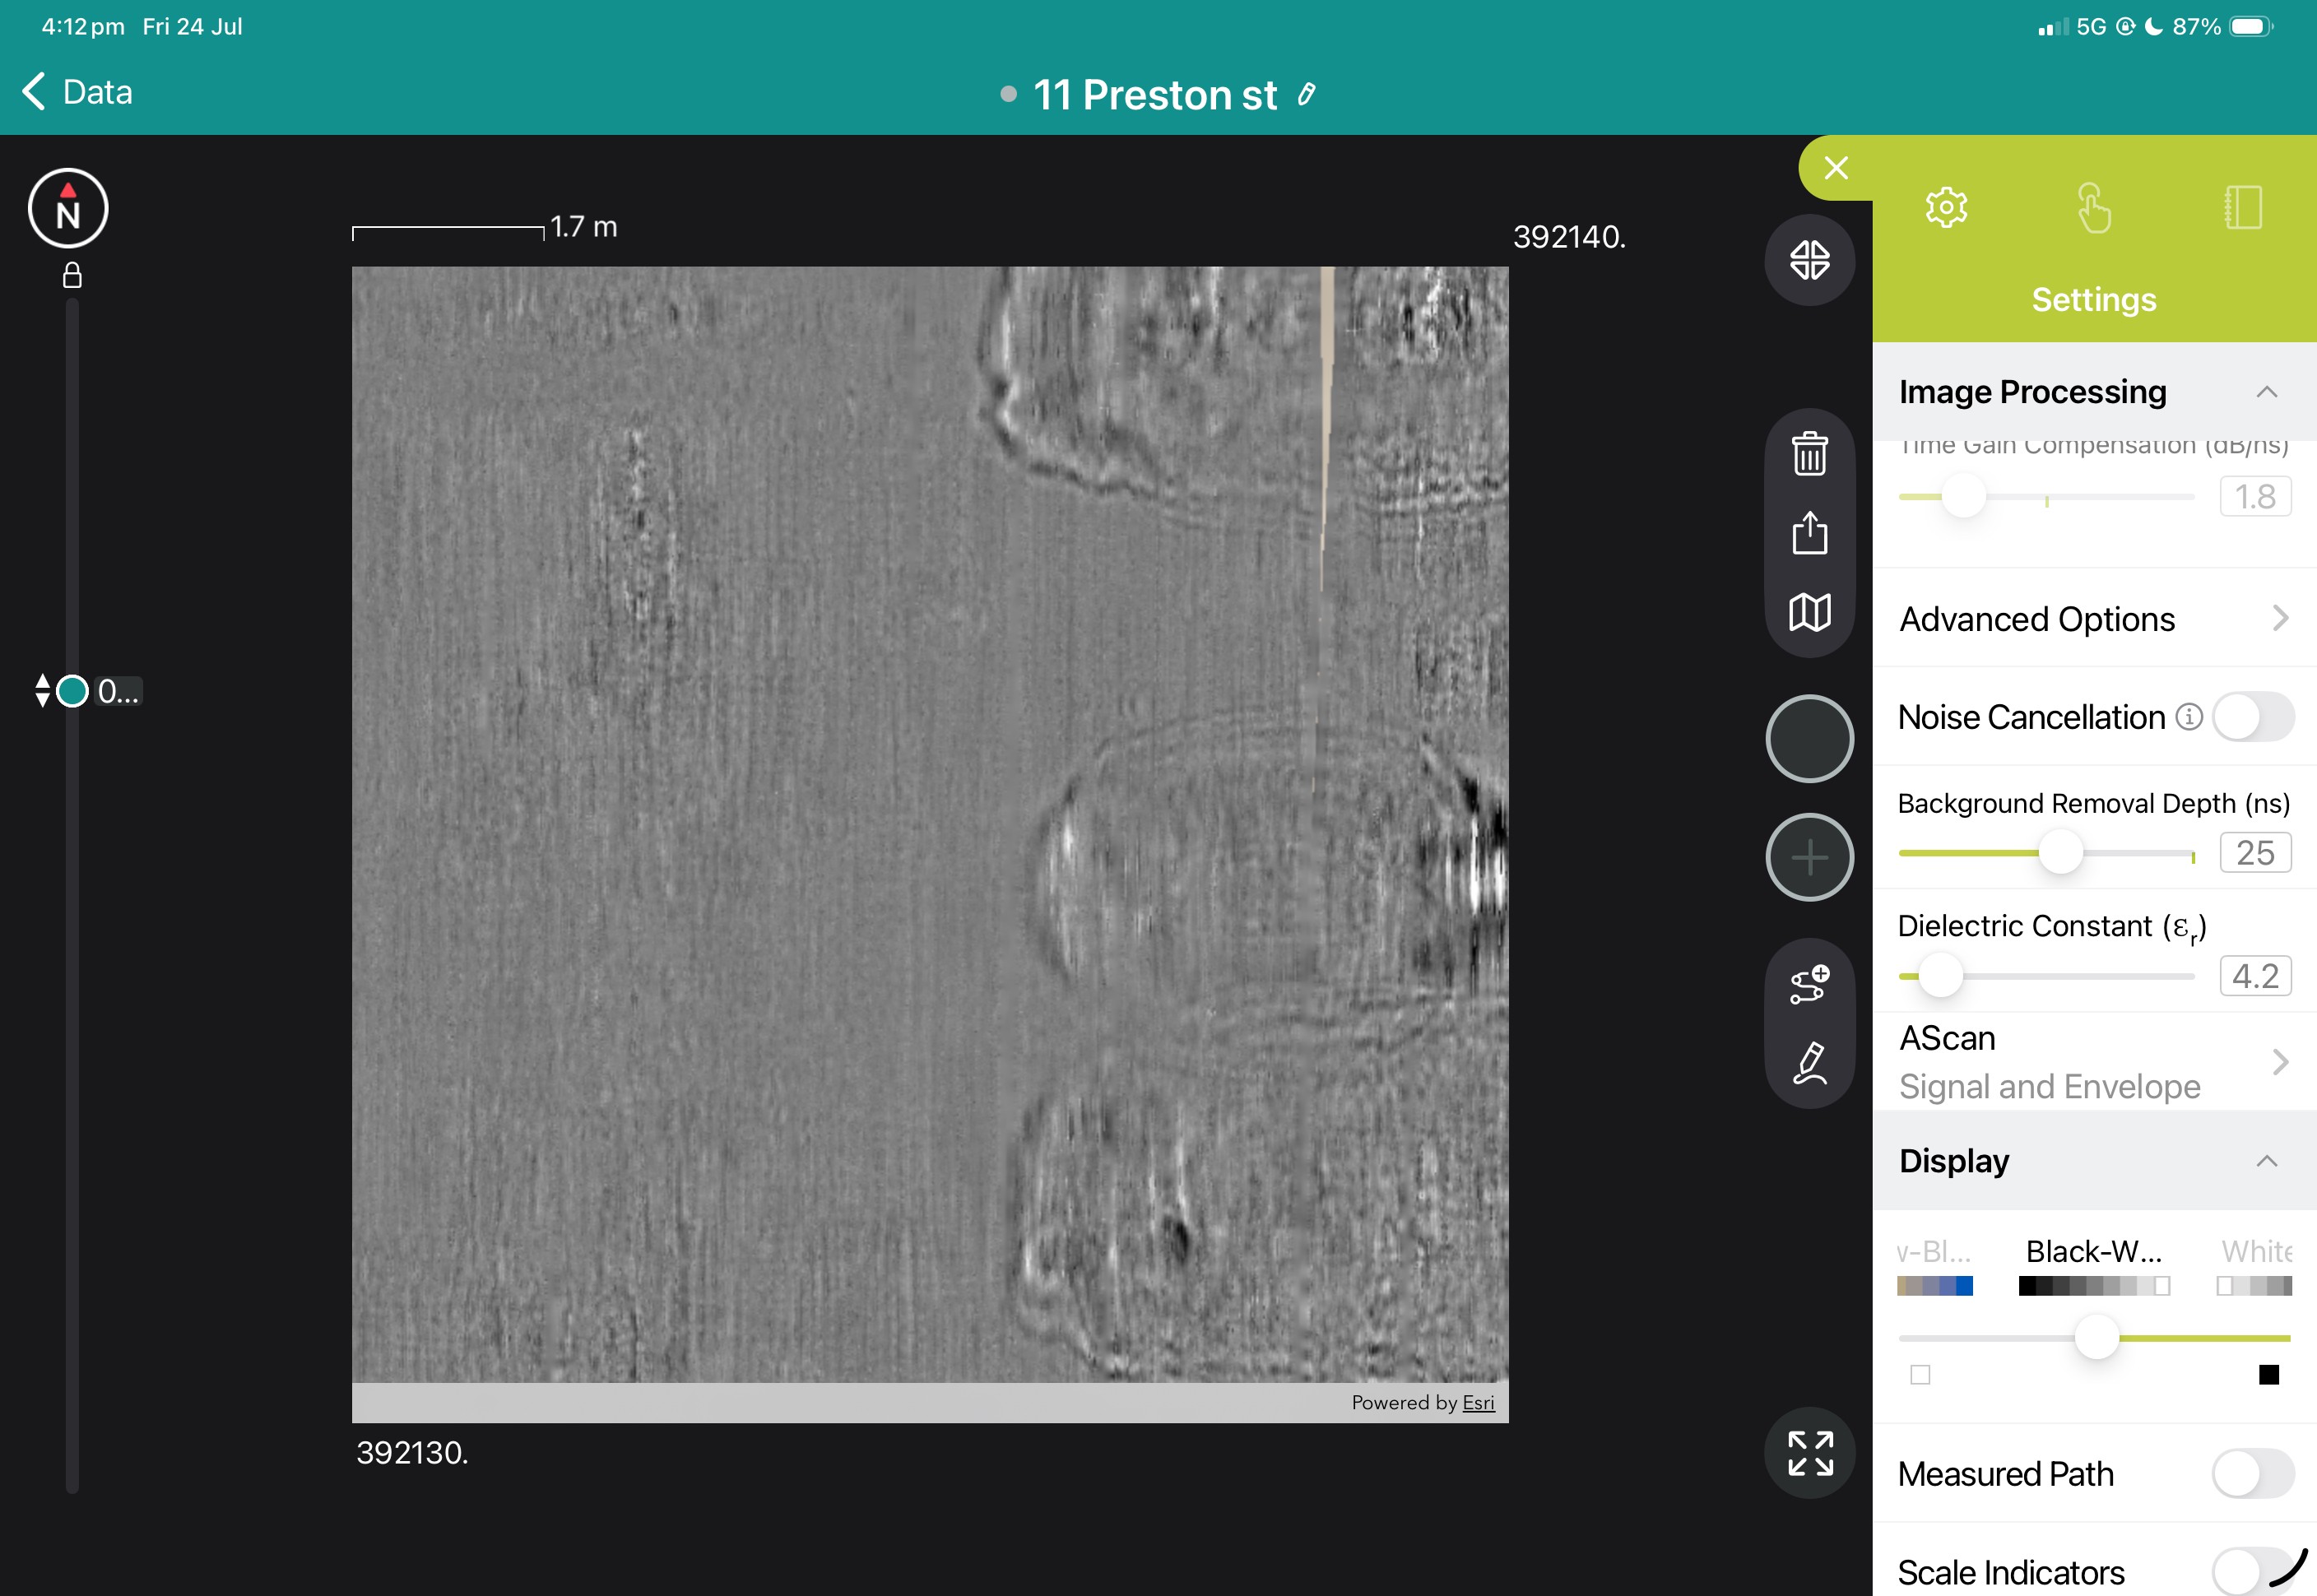
View the images below to see these in action.

Prior to leaving our quality assurance department, each test sieve is carefully packaged along with a Certificate of Conformity and Record Card. Each sieve is laser engraved with a unique serial number for quality tracking. All Laarmann 200mm (50mm height), 300mm (75mm height) test sieves are manufactured with a unique safety edge.
Advantages
We offer qualitative advantages compared with other manufacturers in each detail. It is profitable to compare the details. Multiple advantages due to the sum of the details:
Woven Wire Mesh Sieves
We stock 200 and 300mm diameter woven sieves. Other sizes also available non-standard are 100, 150, 315 mm, 400 mm, 450 mm. They are manufactured from grade 304 stainless steel. The tension of the sieve fabric is guaranteed durable and well joined to the sieve frame. Sizes available in stock include:
3.35mm, 1.7mm, 600μm, 212μm
2.36mm, 1.18mm, 425μm, 150μm
2mm, 850μm, 300μm, 75μm
Other sizes on special order are available, please call your local PCTE sales office
Perforated Plate Sieves
We stock 200 and 300mm diameter perforated plate sieves whichare manufactured with stainless steel bodies and mild steel plates. These are only stocked as square holes although round holes are available on special order. Available aperture sizes in stock are:
75mm, 26.5mm, 13.2mm, 8mm,
53mm, 19mm, 11.2mm, 6.7mm
37.5mm, 16mm, 9.5mm, 4.75mm
Other sizes on special order are available, please call your local PCTE sales office
Pan and Cover

Durable pans and covers are available for delivery with all the sieves stocked.
Washing Sieves
75 μm, wet washing sieve are available in 200 and 300mm diameter. They are 200mm in height.

Book a SUE Workflow Demonstration
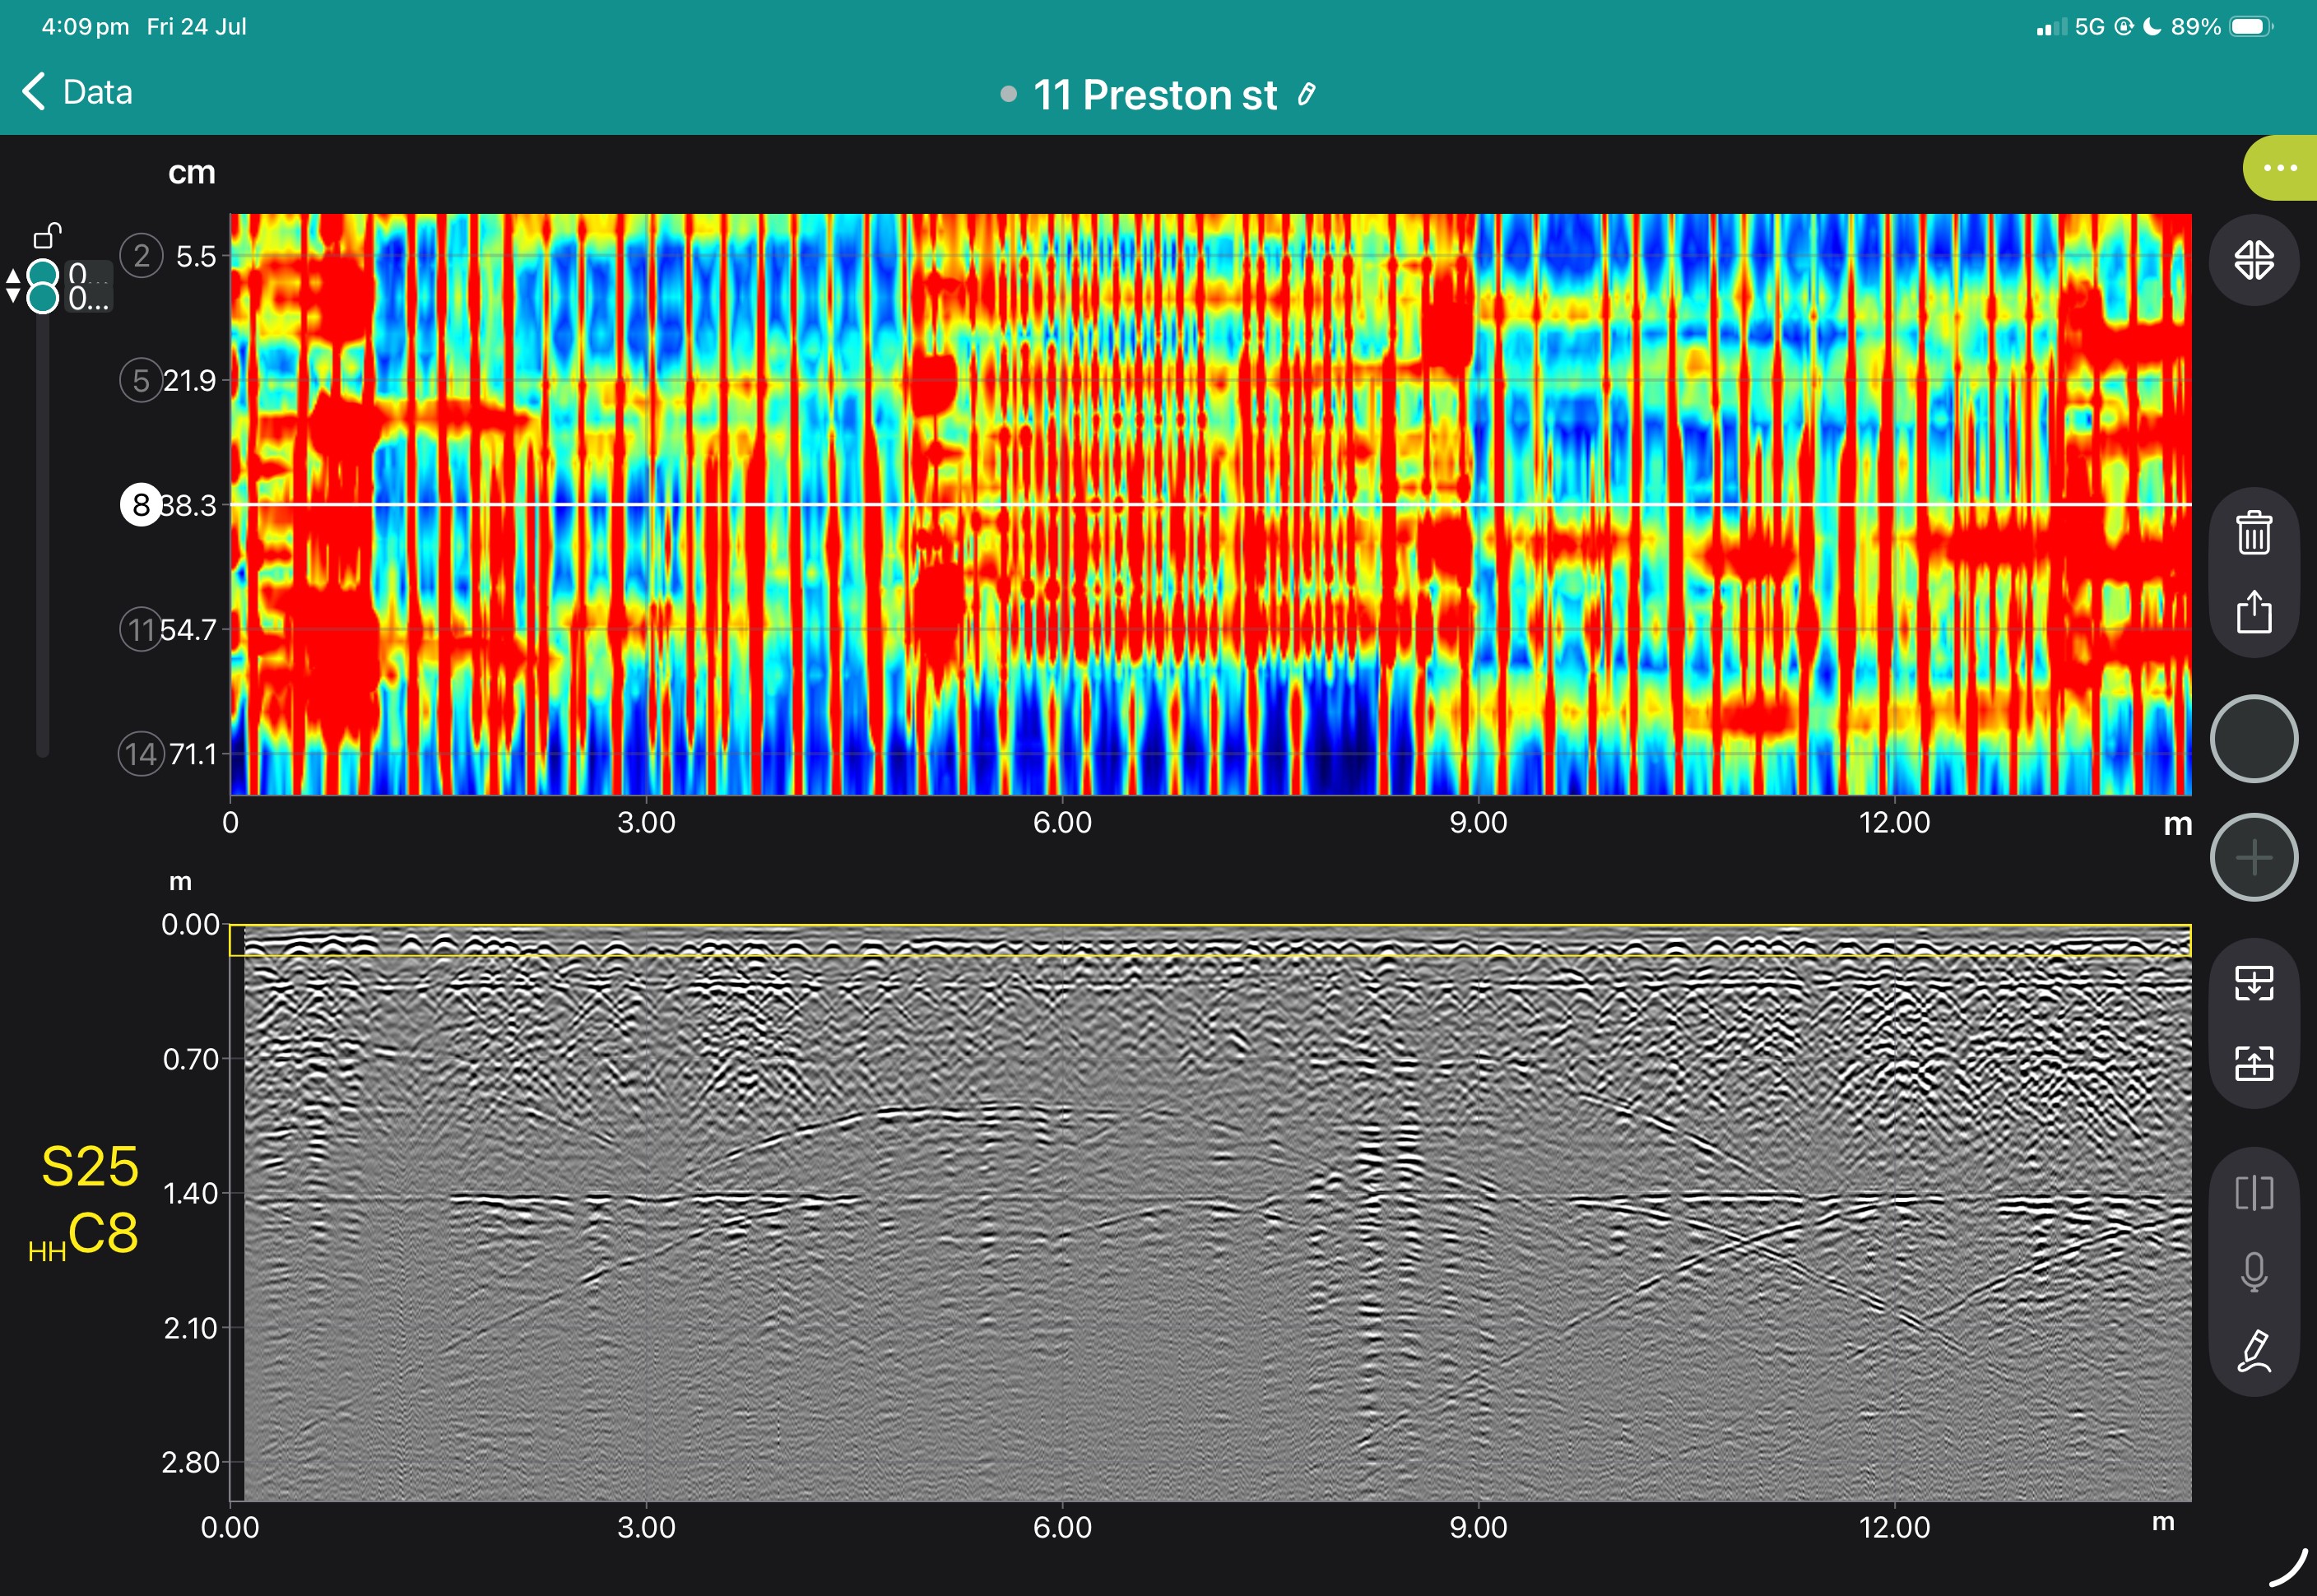
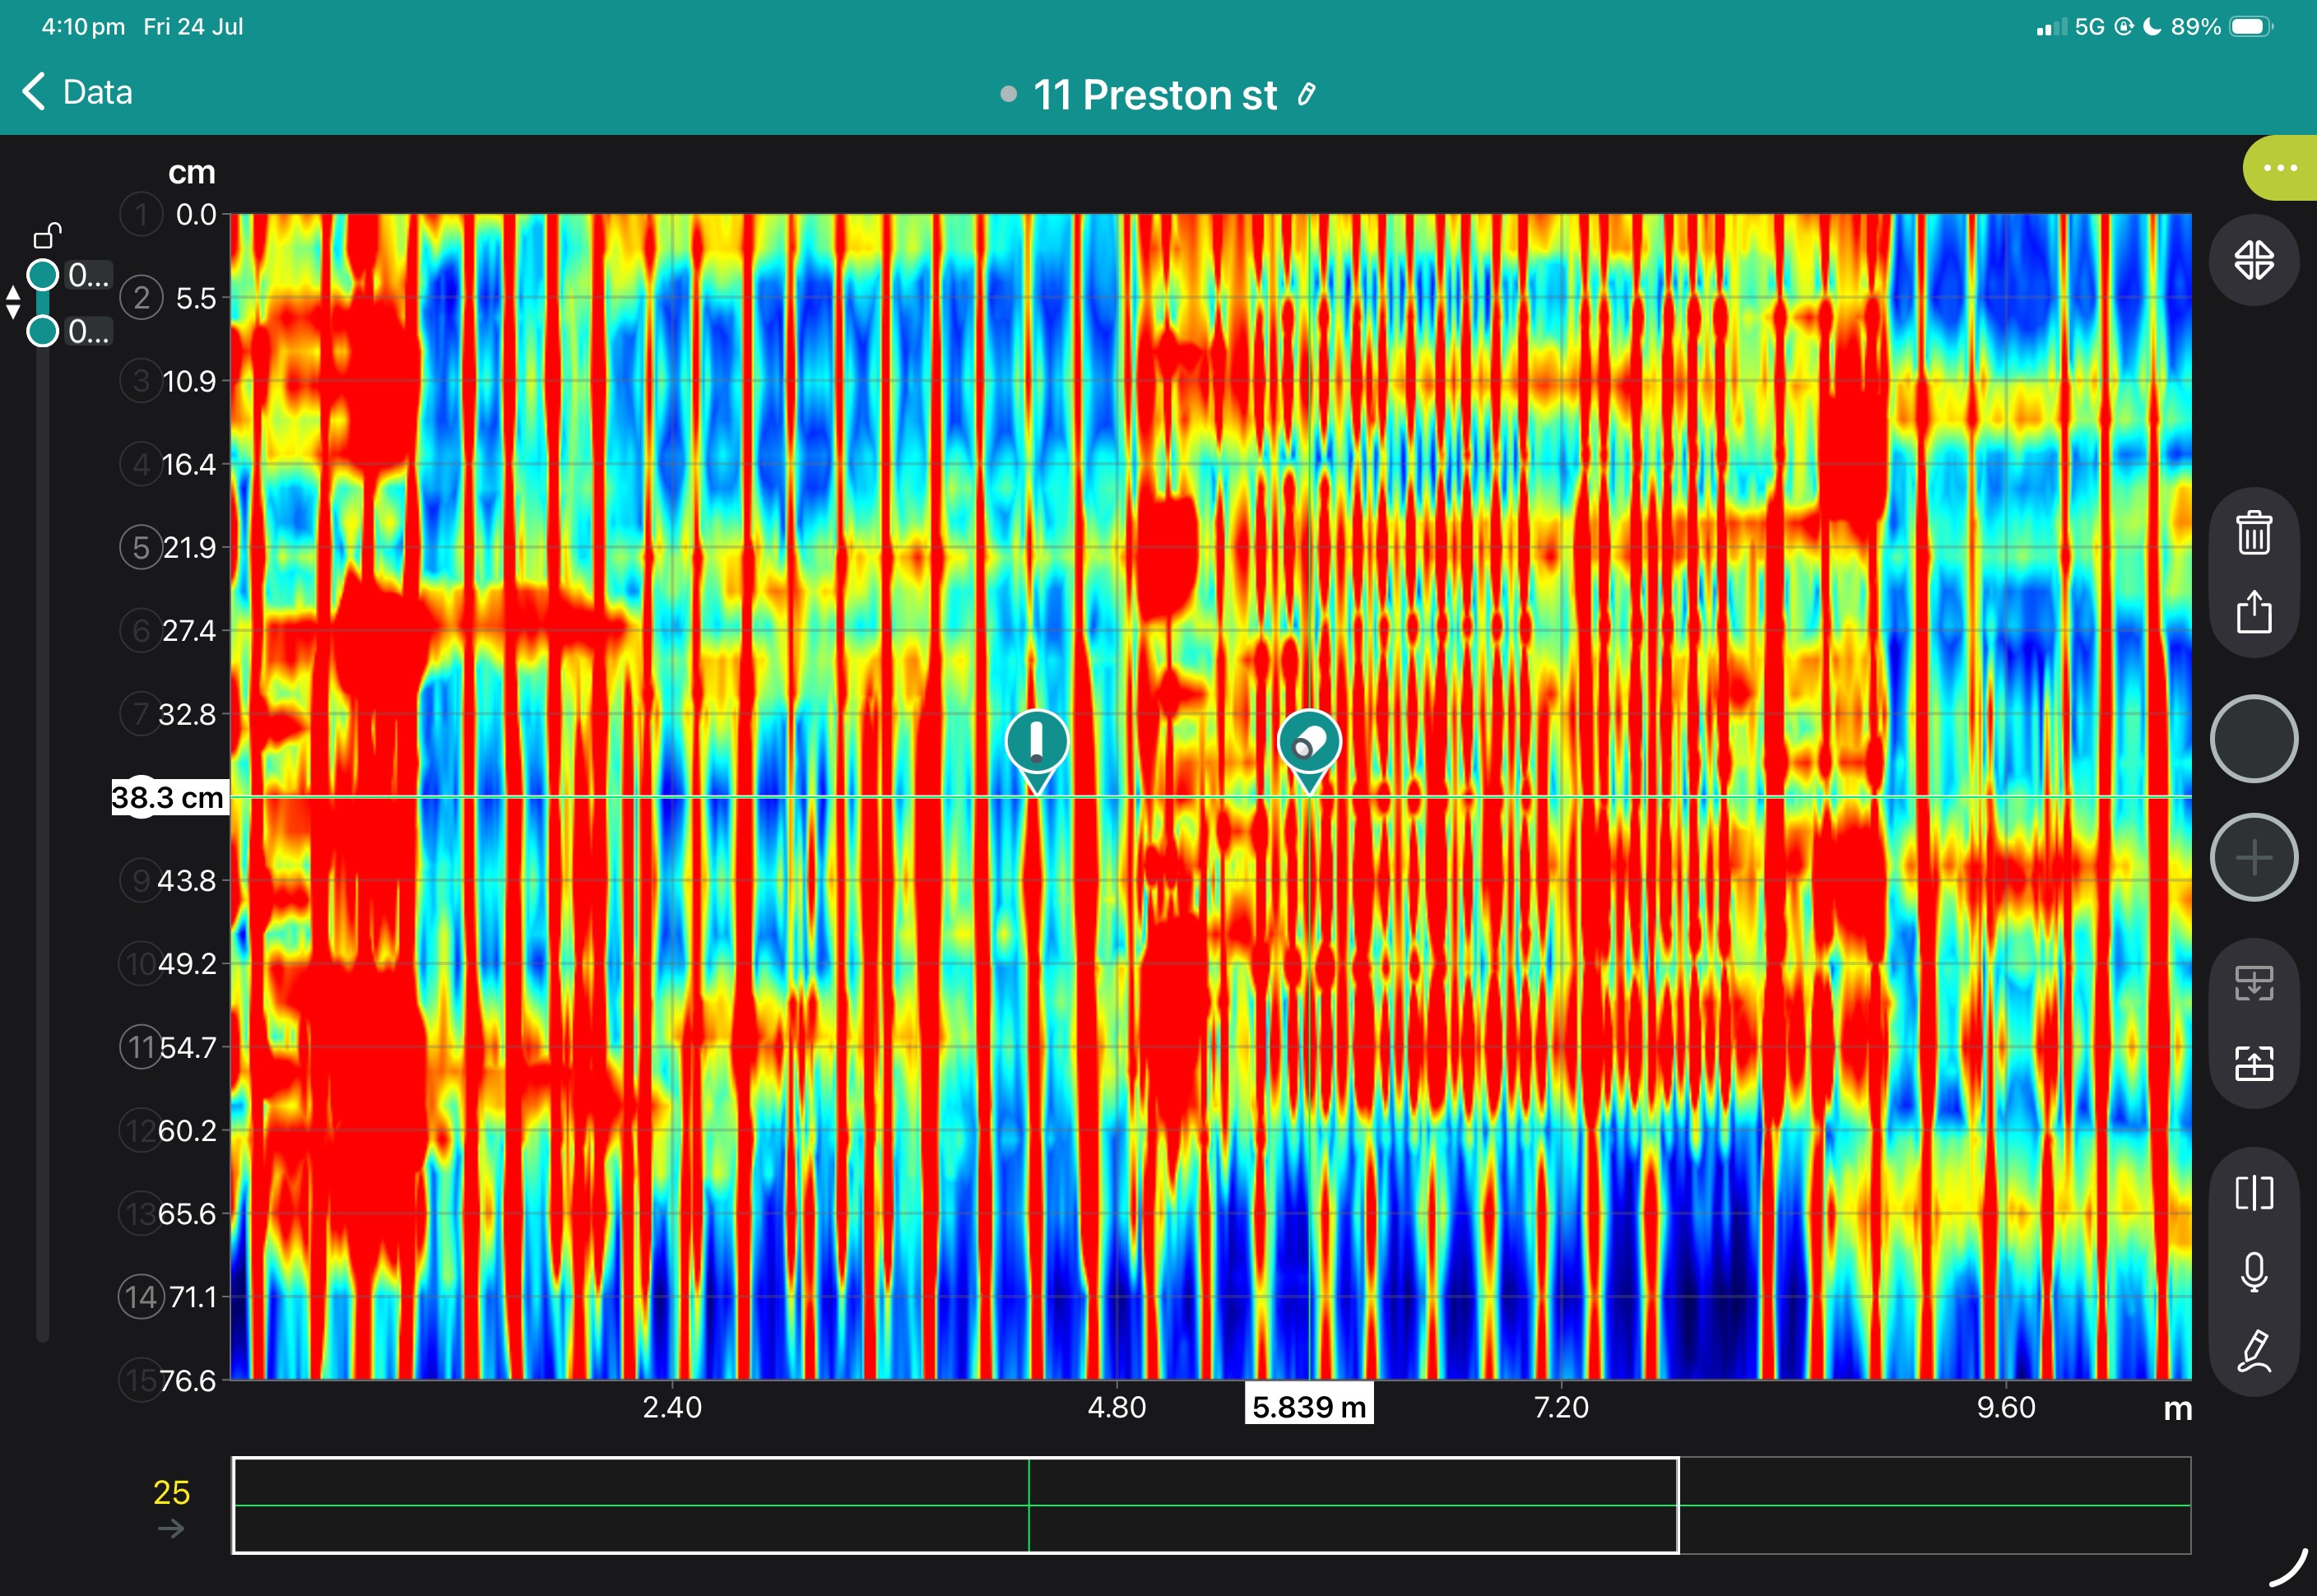
The GX1 transforms the GS9000 into a high-resolution structural assessment system for concrete slabs, bridge decks and pavements. Its dense, dual-polarisation array captures detailed 3D data across wide areas, supporting reinforcement and cover mapping, moisture and deterioration assessment, and analysis of asphalt and pavement layers. Live visualisation helps confirm survey coverage on site, while post-processing tools produce clear, report-ready condition maps.
1. Define the inspection area
Import the structure, bridge, pavement or survey background.
2. Collect closely spaced profiles
Capture 35 longitudinal and 15 cross-polarised channels with dense spacing.
3. Review coverage in the field
Use live radargrams and time slices to confirm that the required area has been captured.
4. Process the dataset
Apply velocity, gain, background removal, migration, filtering and topographic correction as appropriate.
5. Generate diagnostic maps
Create depth slices, reinforcement maps, layer information or application-specific condition maps.
6. Integrate with the engineering assessment
Export figures, mapped anomalies and raw data for inclusion in the engineer’s final interpretation and report.
Field information
Processed Diagnostic Information
Engineering deliverables
View some of these features at work below, and our case study if you'd like to see more of what the GS9000 can do.




Book a Structural Assessment Demonstration
GS9000 cart with: