Measures and records climatic conditions including: Relative humidity, air temperature, surface temperature, dew point temperature and difference between surface and dew point temperatures.
$ 0.00 AUD
This product is out of stock.
Product is not available in this quantity.
Thank you! Your submission has been received!
Oops! Something went wrong while submitting the form.
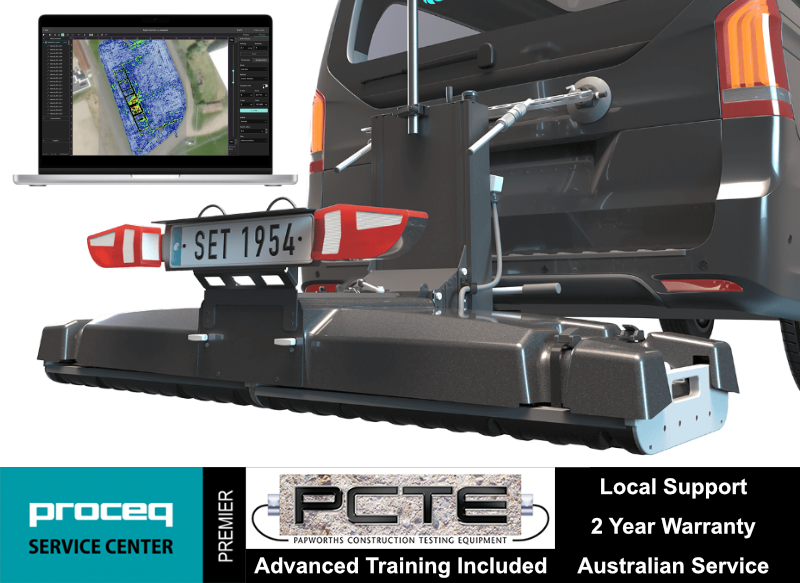
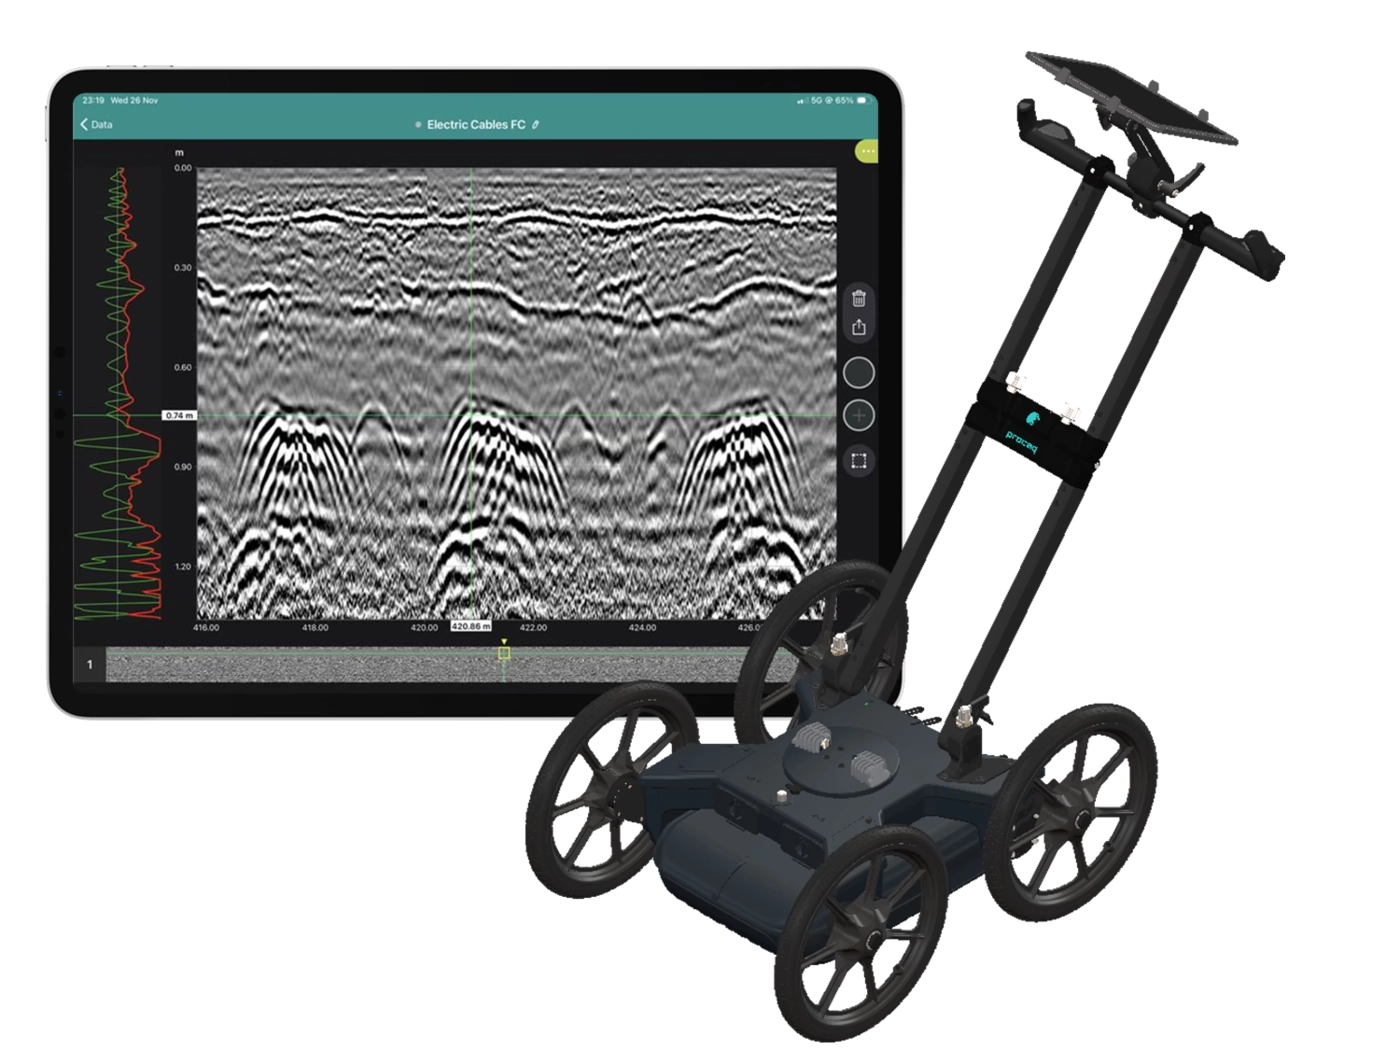
Collect high-density, georeferenced GPR data across wide areas and view the subsurface in 3D as you scan. Choose the GX2 array for SUE and utility mapping, or the GX1 array for structural, bridge and pavement investigations.
Why use the GS9000 instead of a conventional single-channel GPR?
Cover more ground
Collect multiple parallel profiles in one pass instead of uilding a grid line by line.
See results during acquisition
View georeferenced radargrams and time-slice information in the field rather than waiting until the data is returned to the office.
Produce repeatable mapped data
Combine wheel-positioned GPR data with GNSS, project coordinates and survey linework.
Use one platform for two very different applications
Exchange GX1 and GX2 arrays without purchasing two complete cart platforms.
High-density 3D GPR mapping for SUE and utility investigations
The GX2 transforms the GS9000 into a high-density subsurface utility mapping system. Its 11-channel, low-frequency GPR array captures an 83 cm-wide swath in each pass, helping operators detect and map buried pipes, ducts, cables, voids and other subsurface features. Live georeferenced data lets SUE teams review coverage on site and produce accurate CAD, GIS and project-coordinate deliverables.
Utility corridor mapping
Detection of pipes, ducts and cables
Mapping non-conductive services that may not respond to electromagnetic locating
Congested service investigations
Road-crossing and easement surveys
Potential void and cavity investigation
Pre-excavation and design-stage surveys
Utility mapping to project or local coordinates
The SUE field workflow
1. Plan the survey
Load satellite imagery, CAD information, project coordinates or survey control.
2. Collect dense multichannel data
Survey an approximately 0.82 m-wide swath with 11 channels in each pass.
3. Review data live
Examine radargrams, georeferenced time slices and marked features while still on site.
4. Interpret and digitise
Add points, linework, tags, photographs and field observations.
5. Process and deliver
Merge survey areas, apply processing and export mapped information for the customer’s CAD, GIS or reporting workflow.
SUE Outputs and Deliverables
Georeferenced time-slice maps
Radar profiles
Utility alignments and interpreted linework
Depth estimates
Survey trajectory
Points of interest
Field photographs and annotations
CAD, SHP and KML outputs
SEG-Y raw-data export
Project-coordinate and local-grid outputs
PDF or shareable project reports
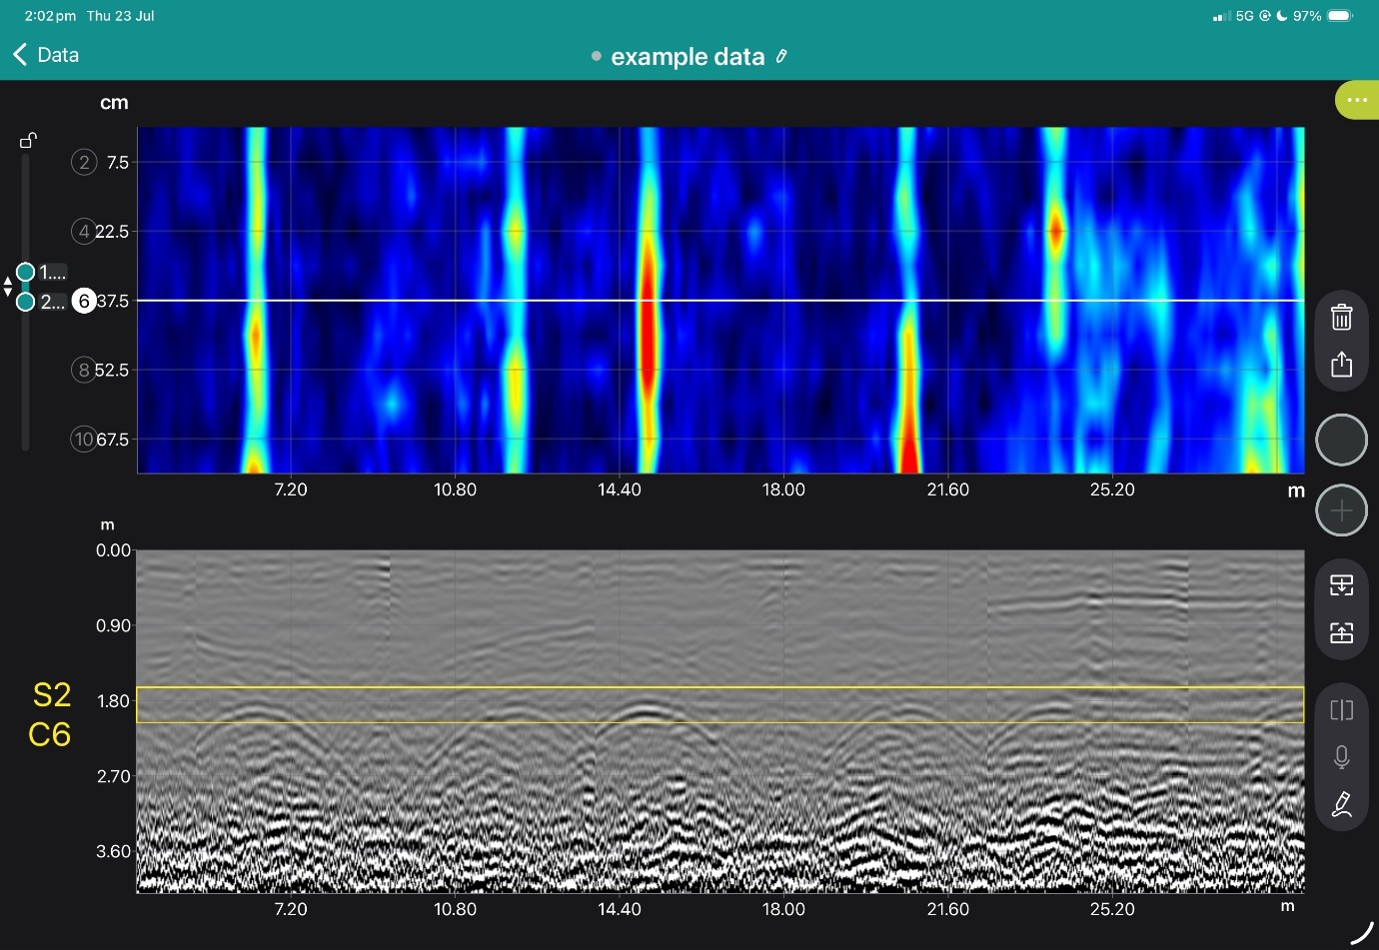
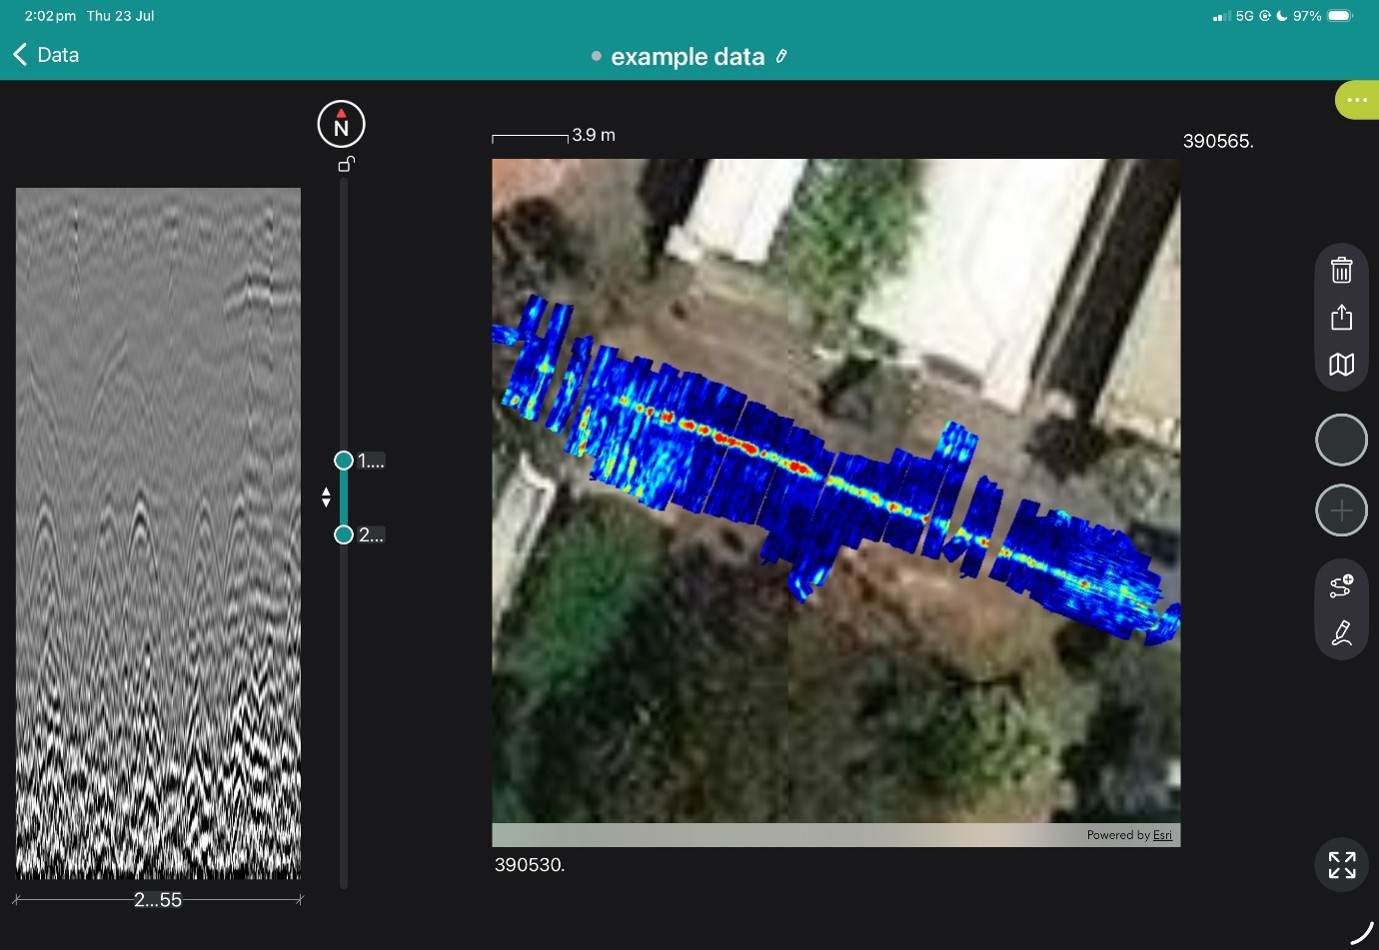
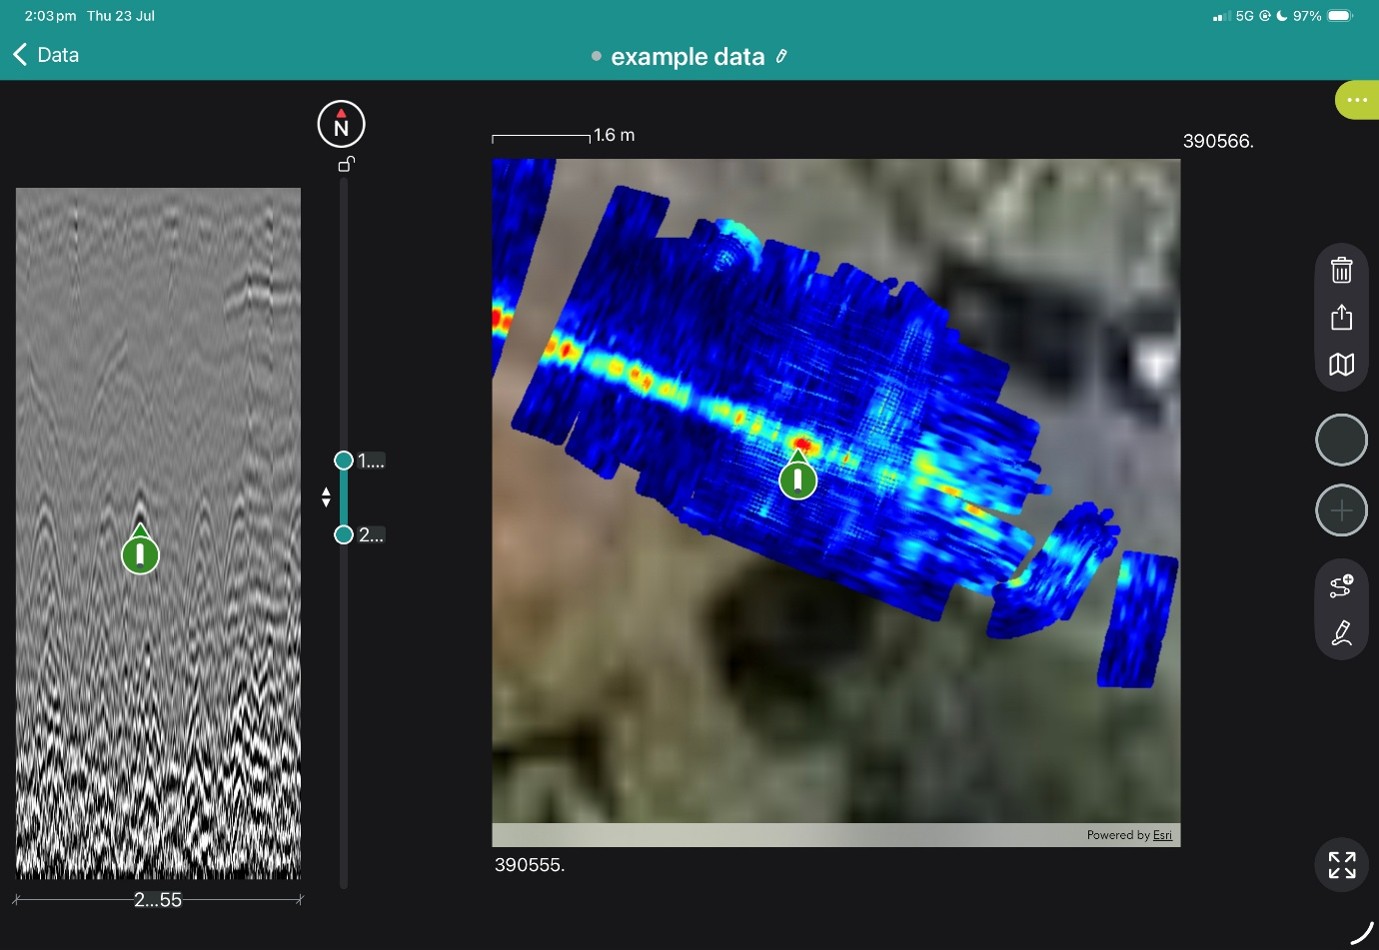
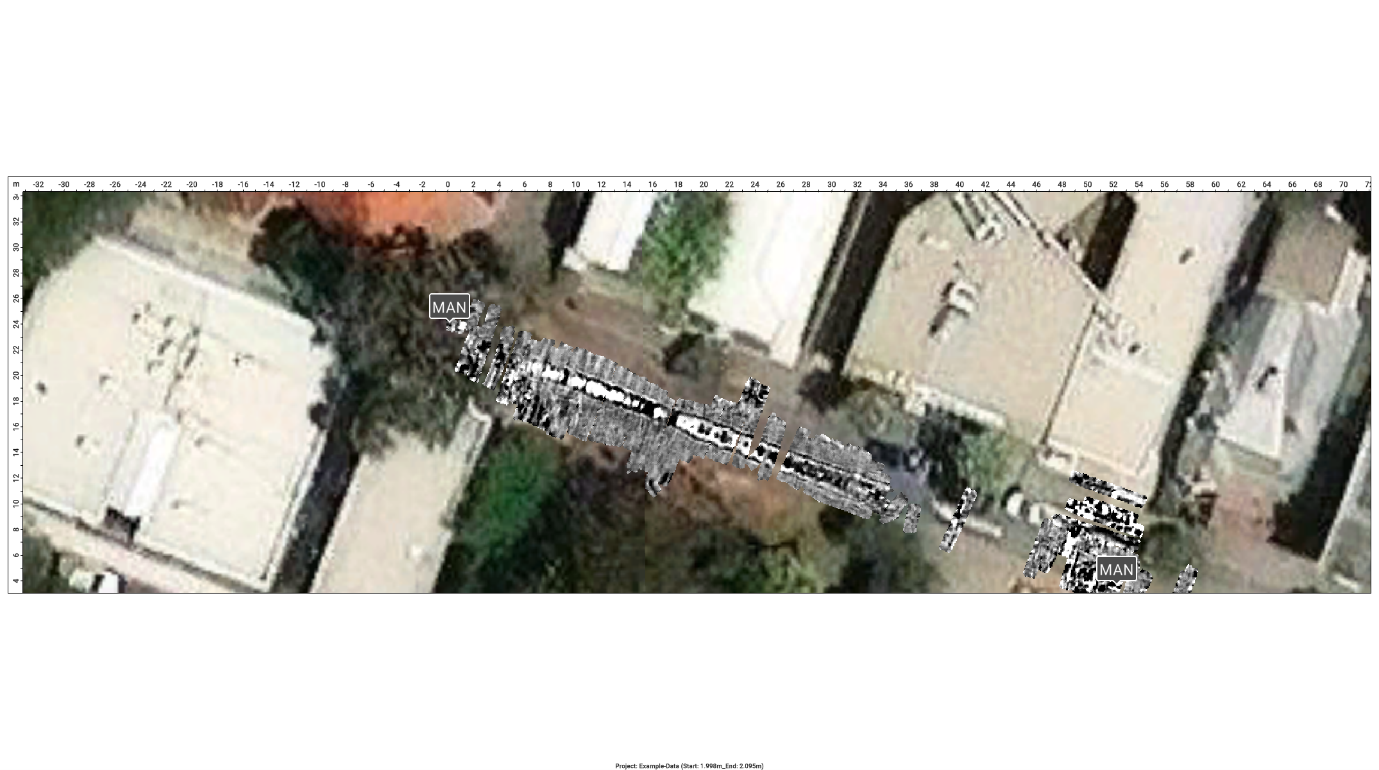
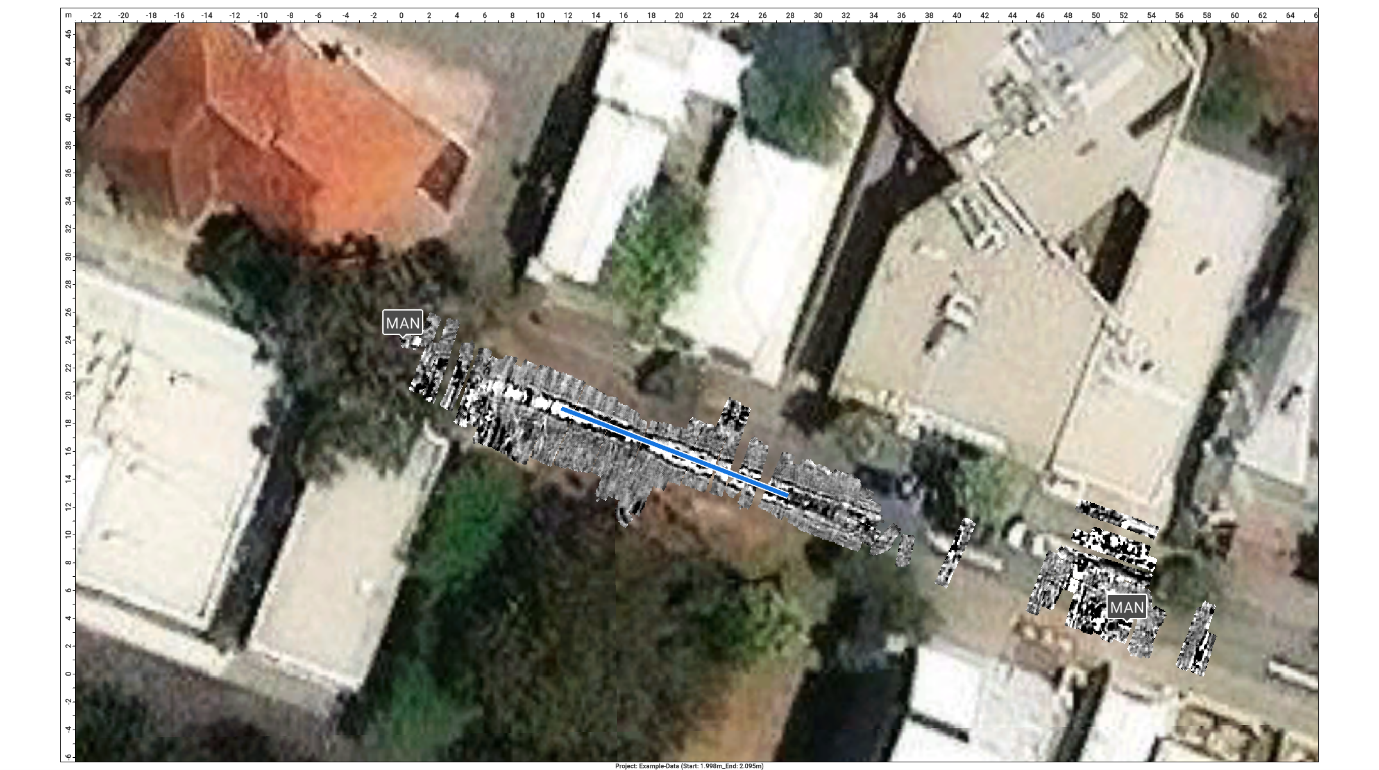
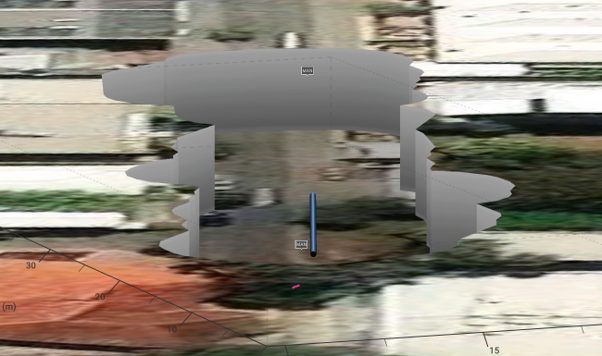
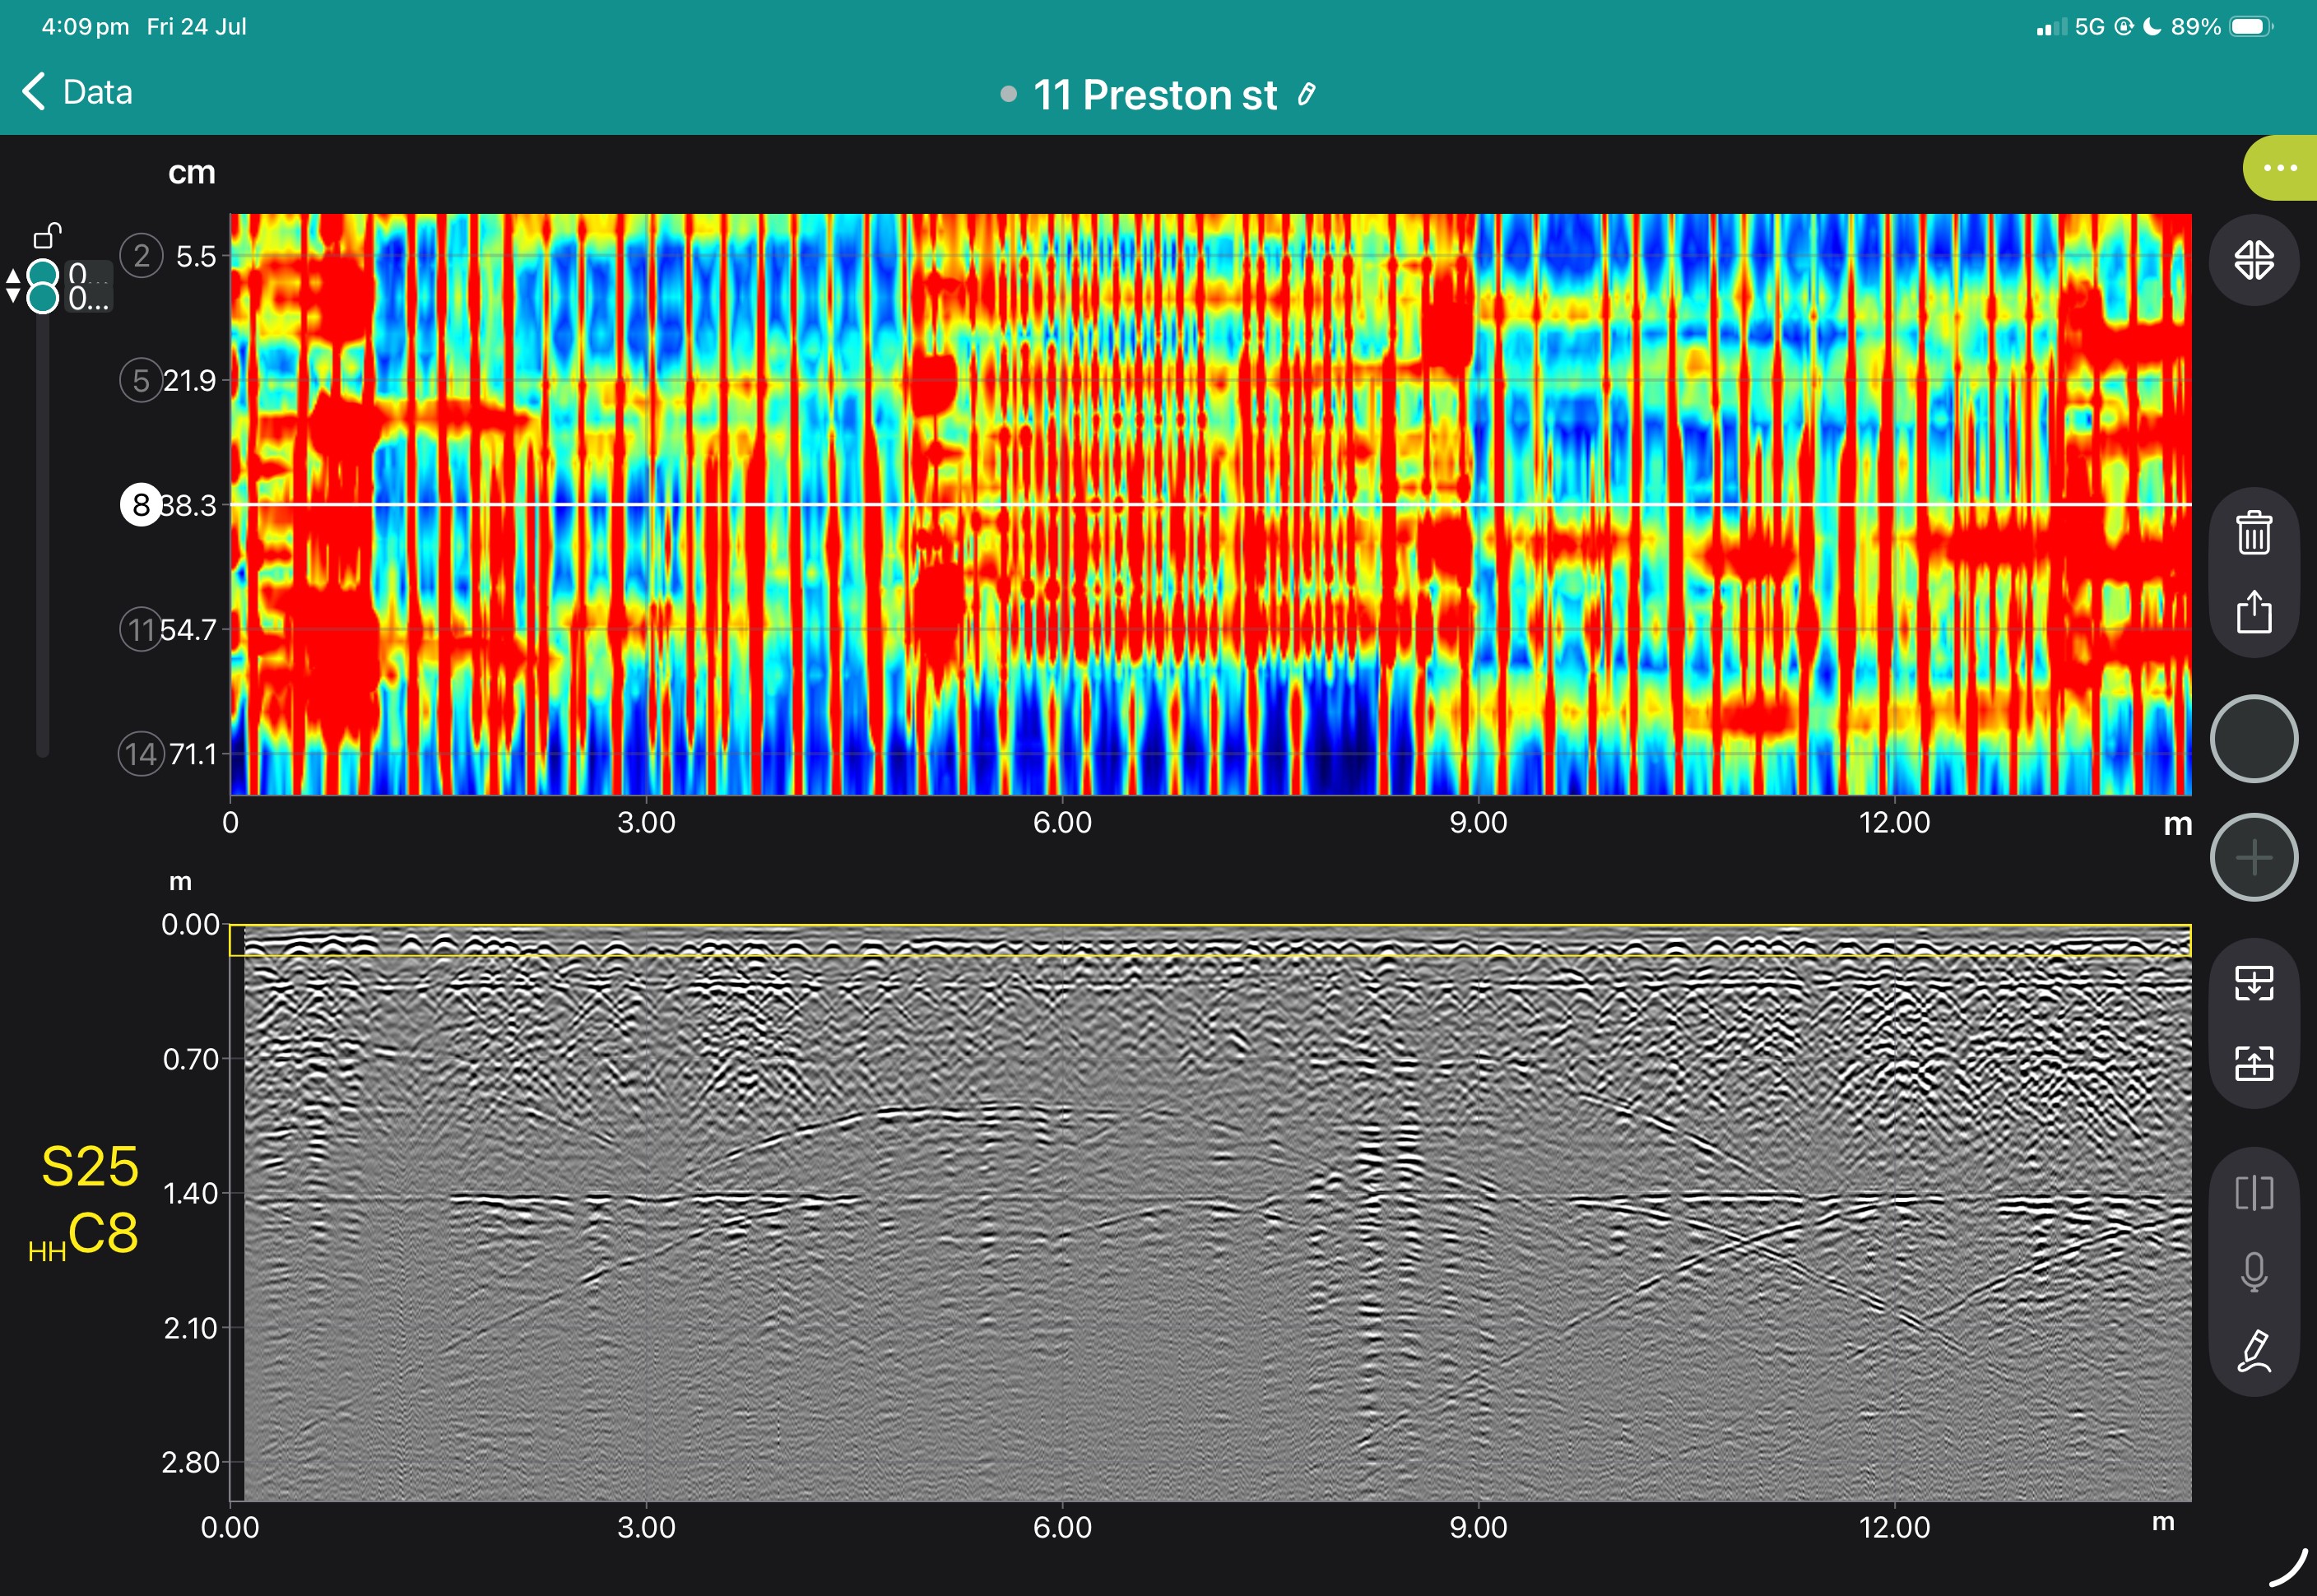
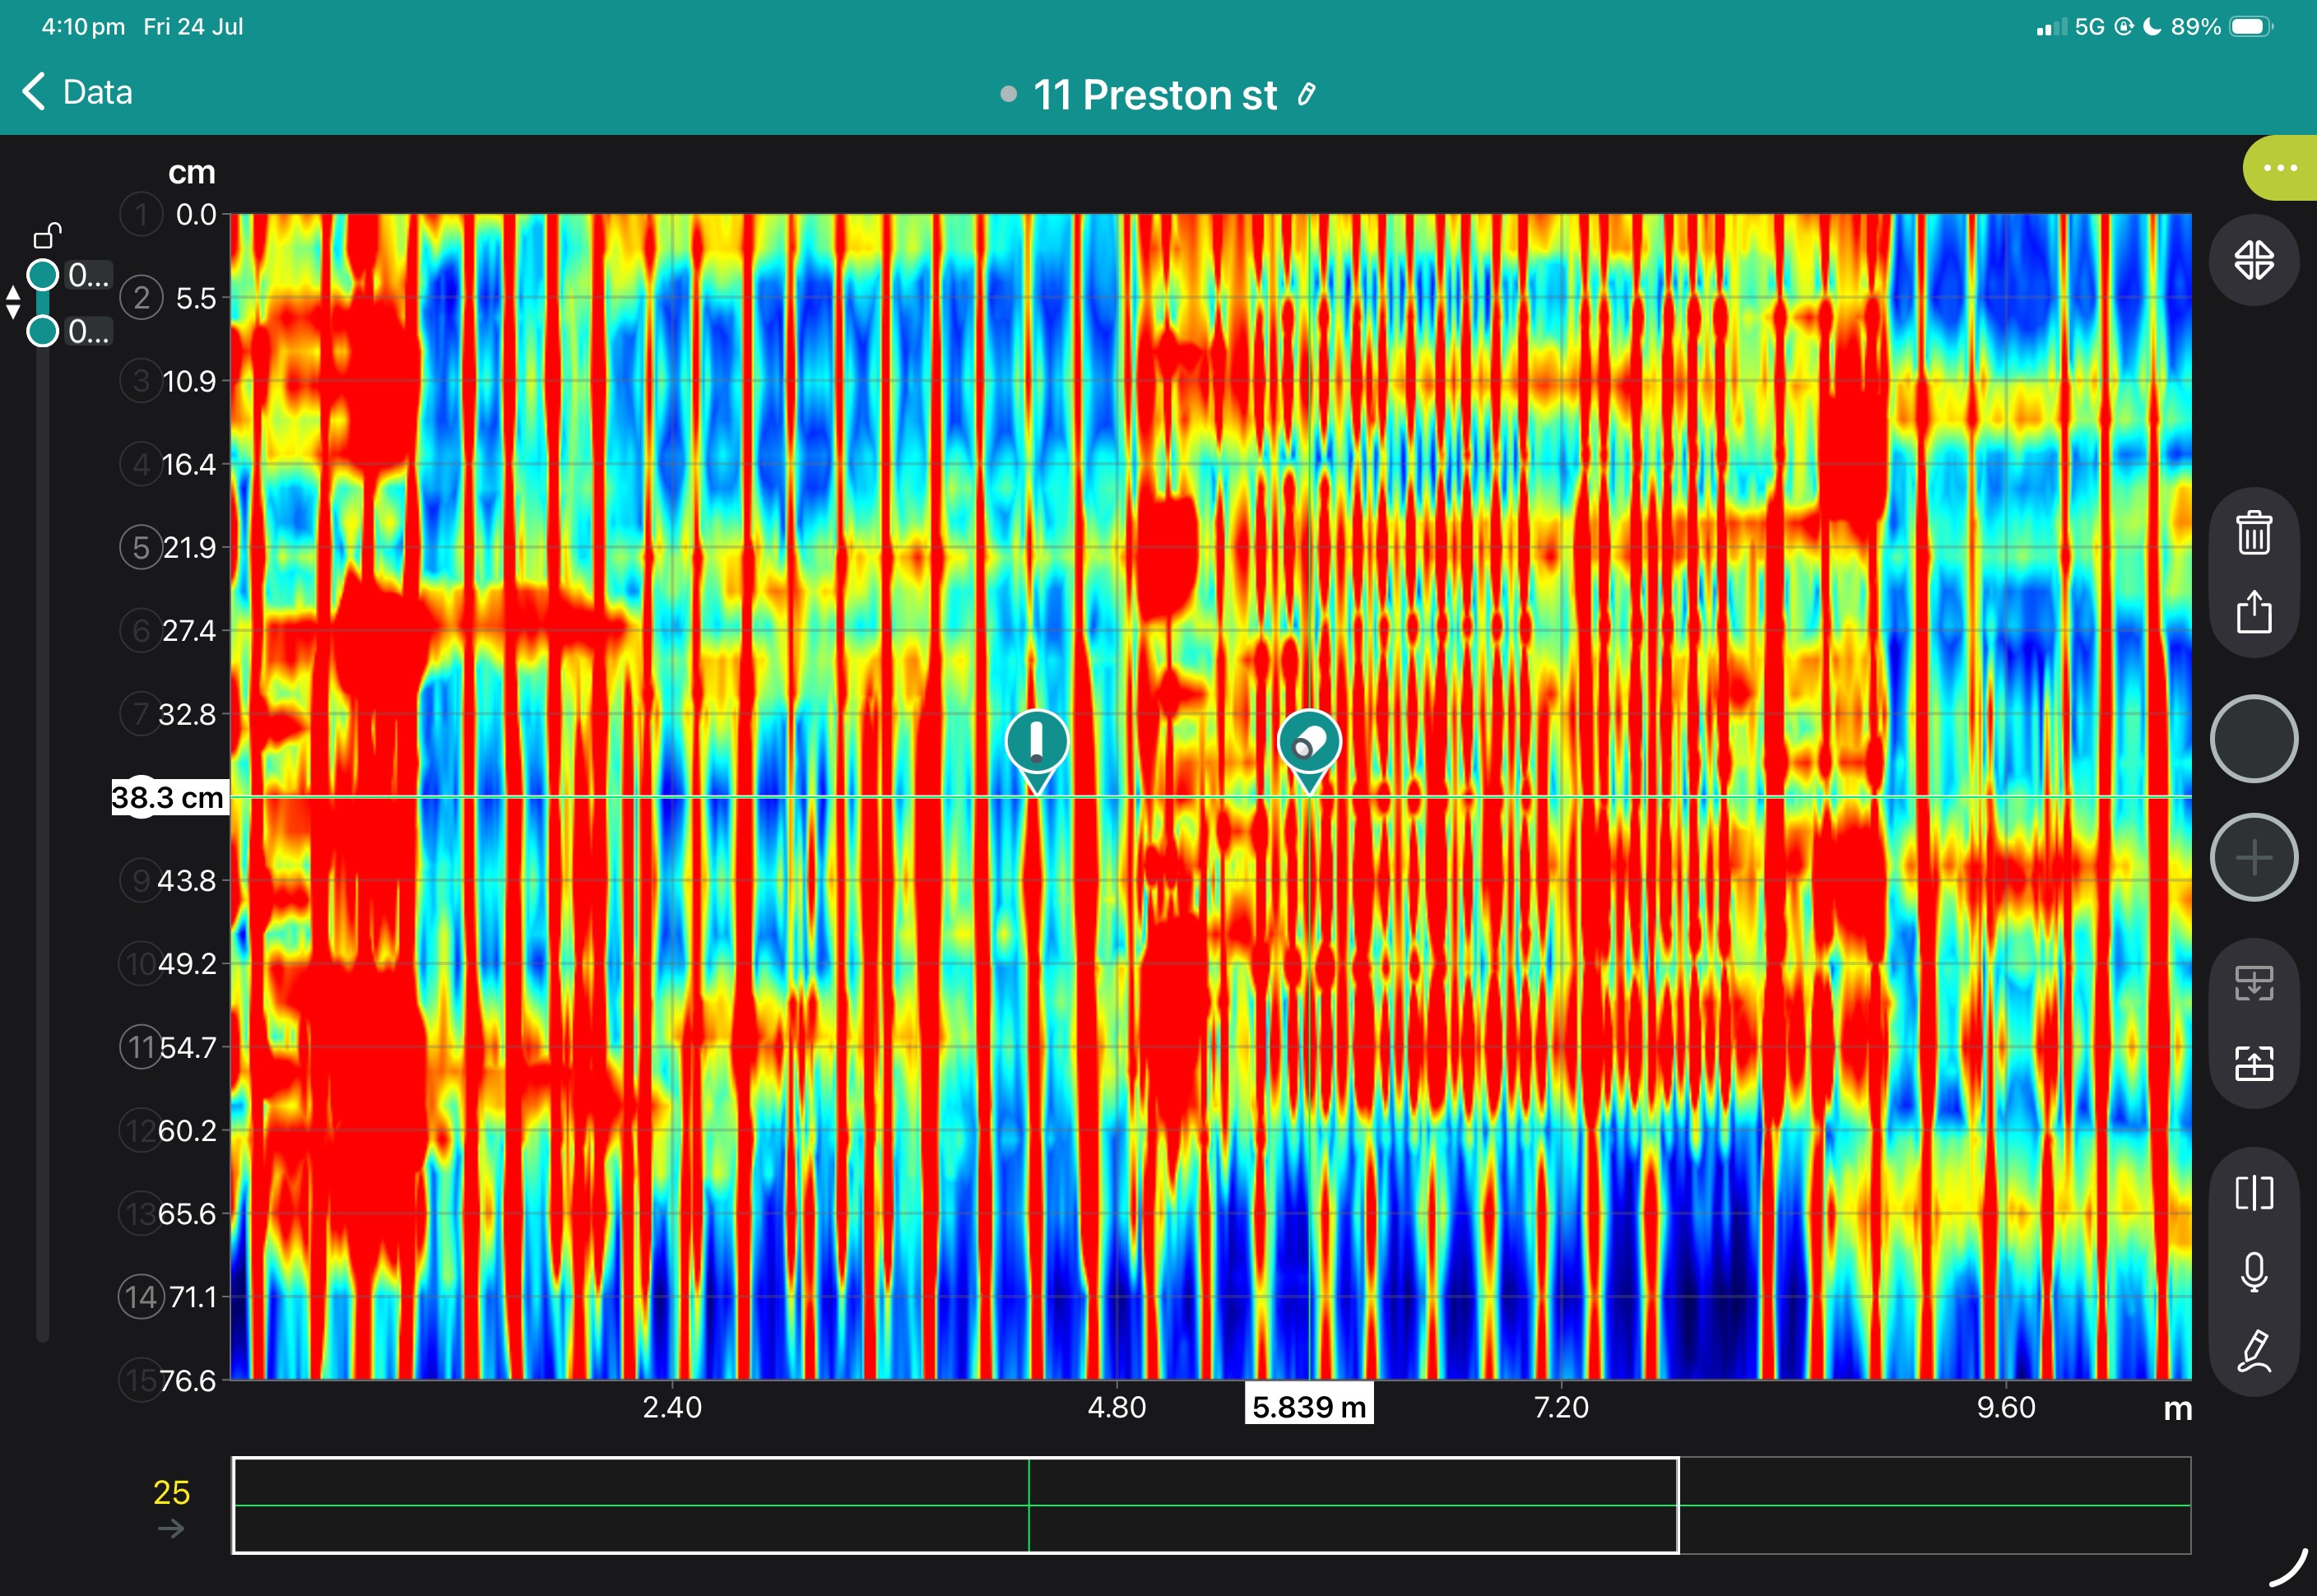
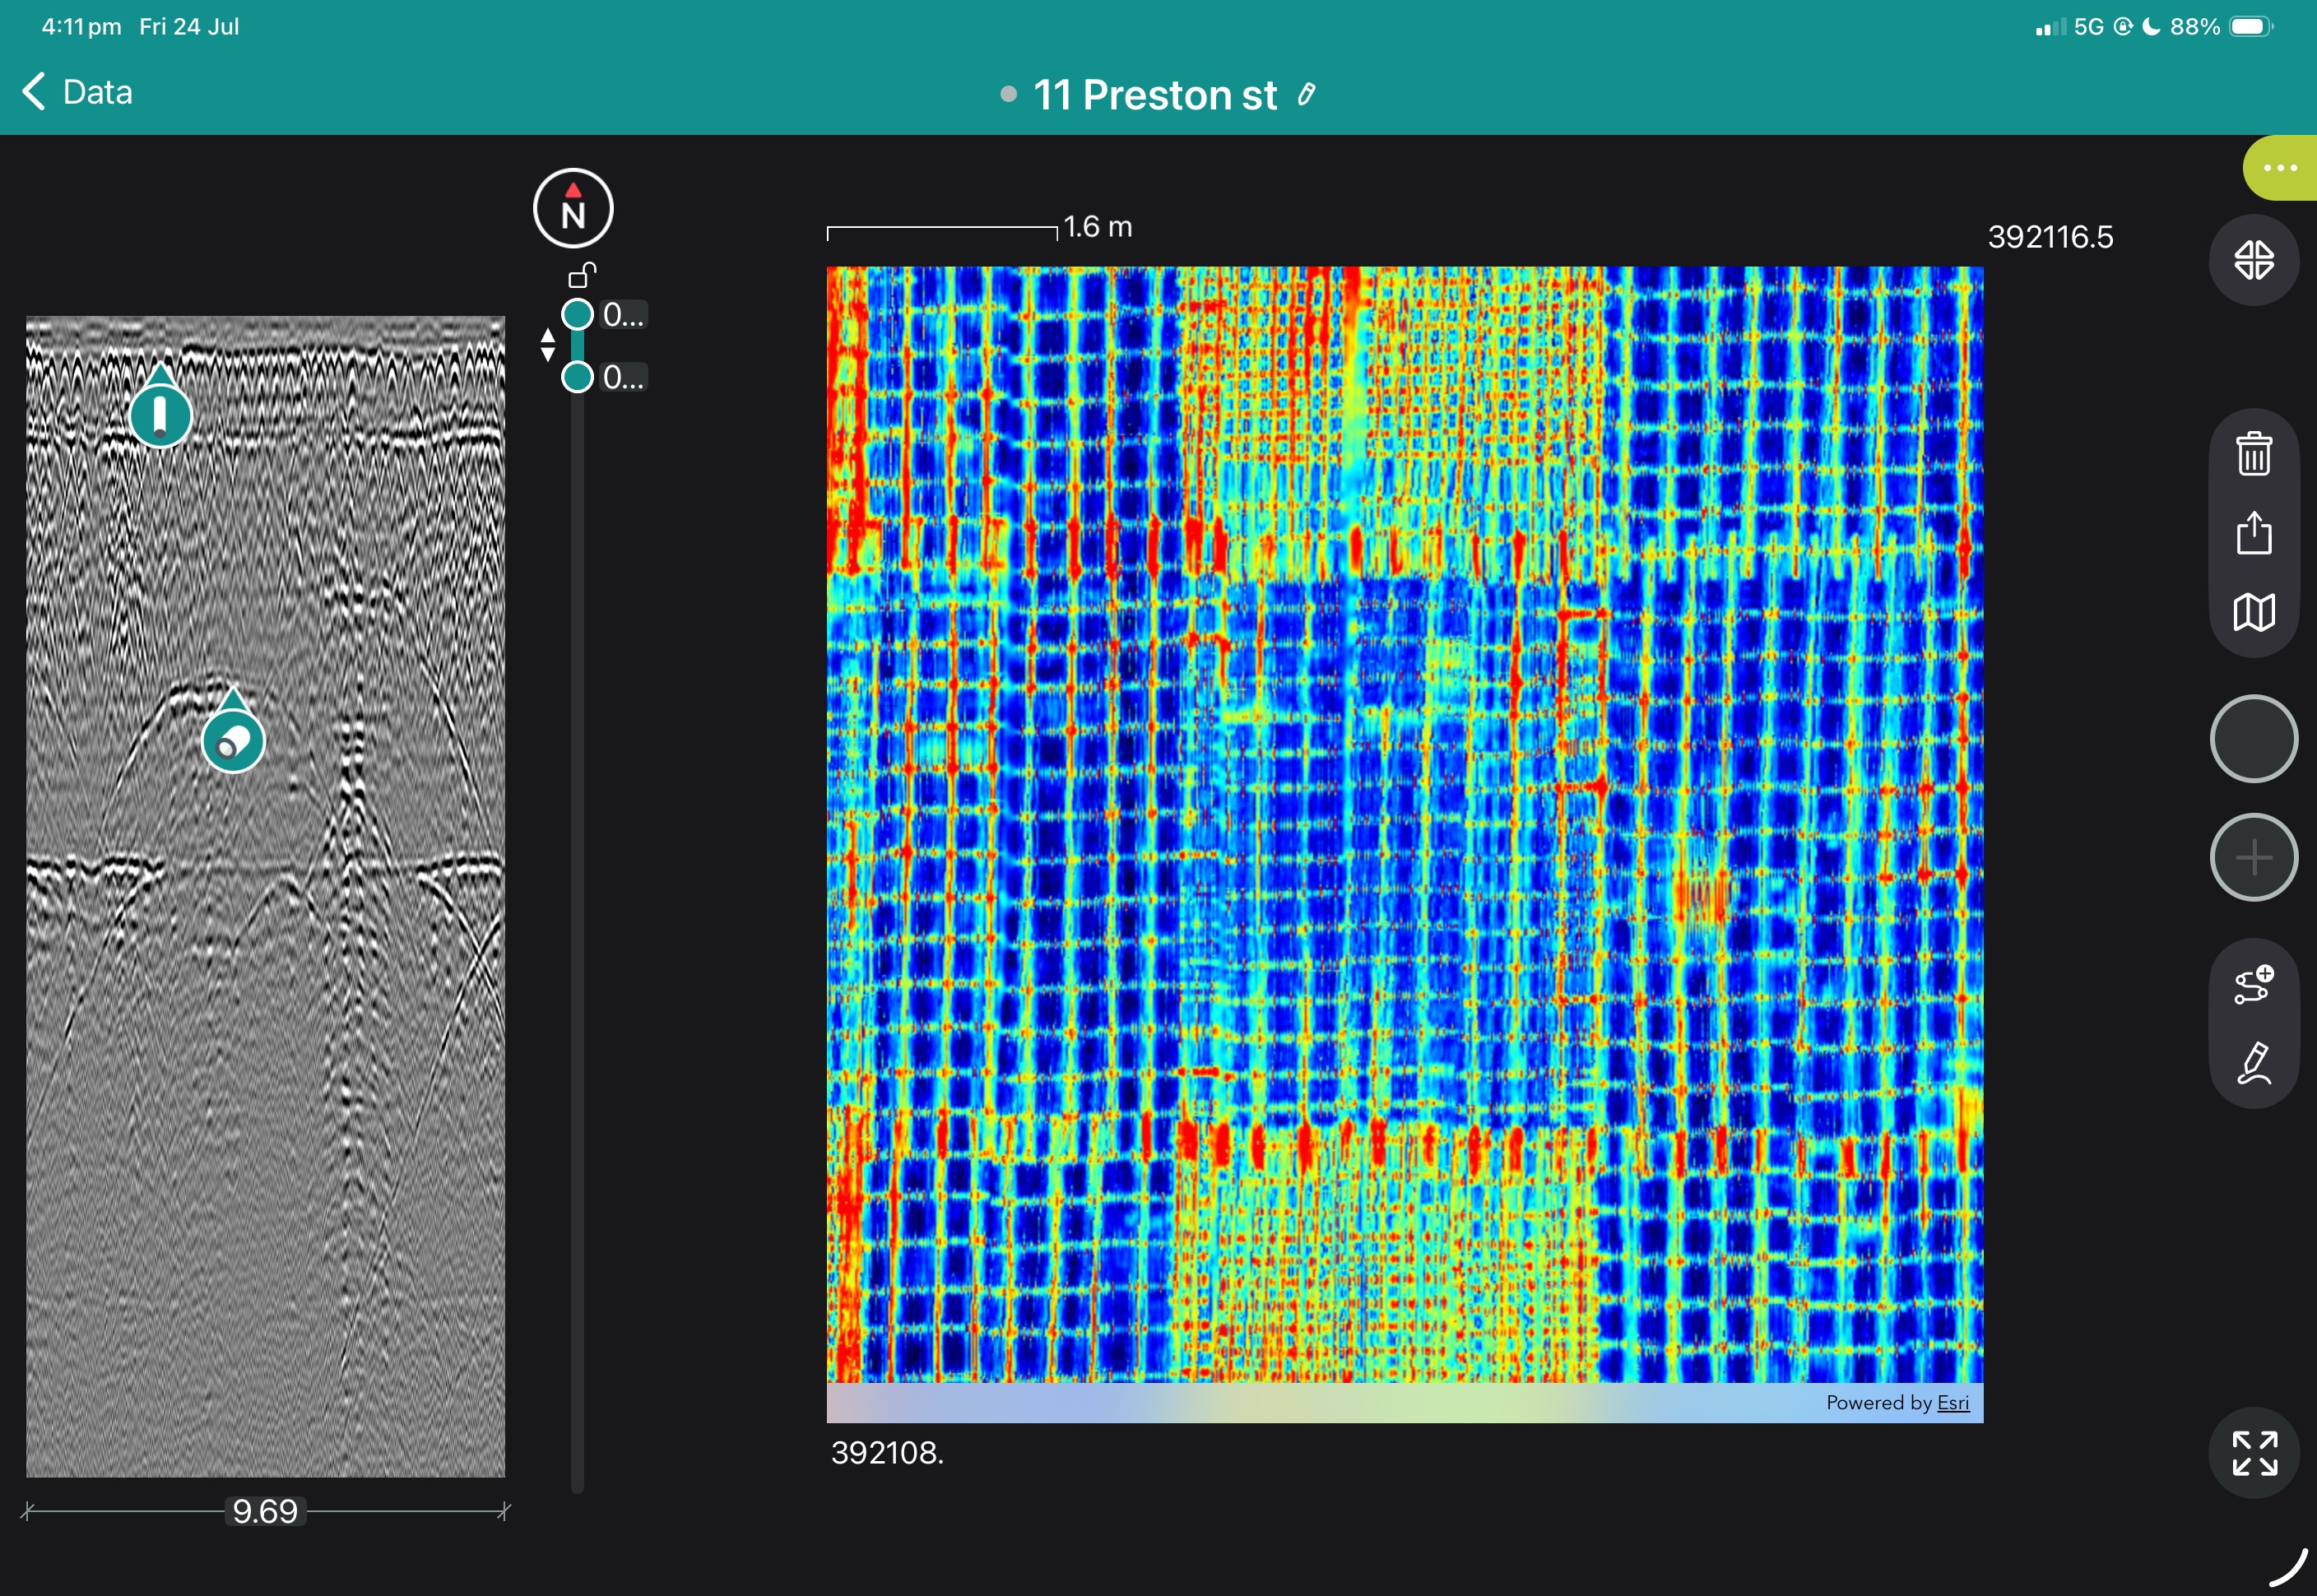
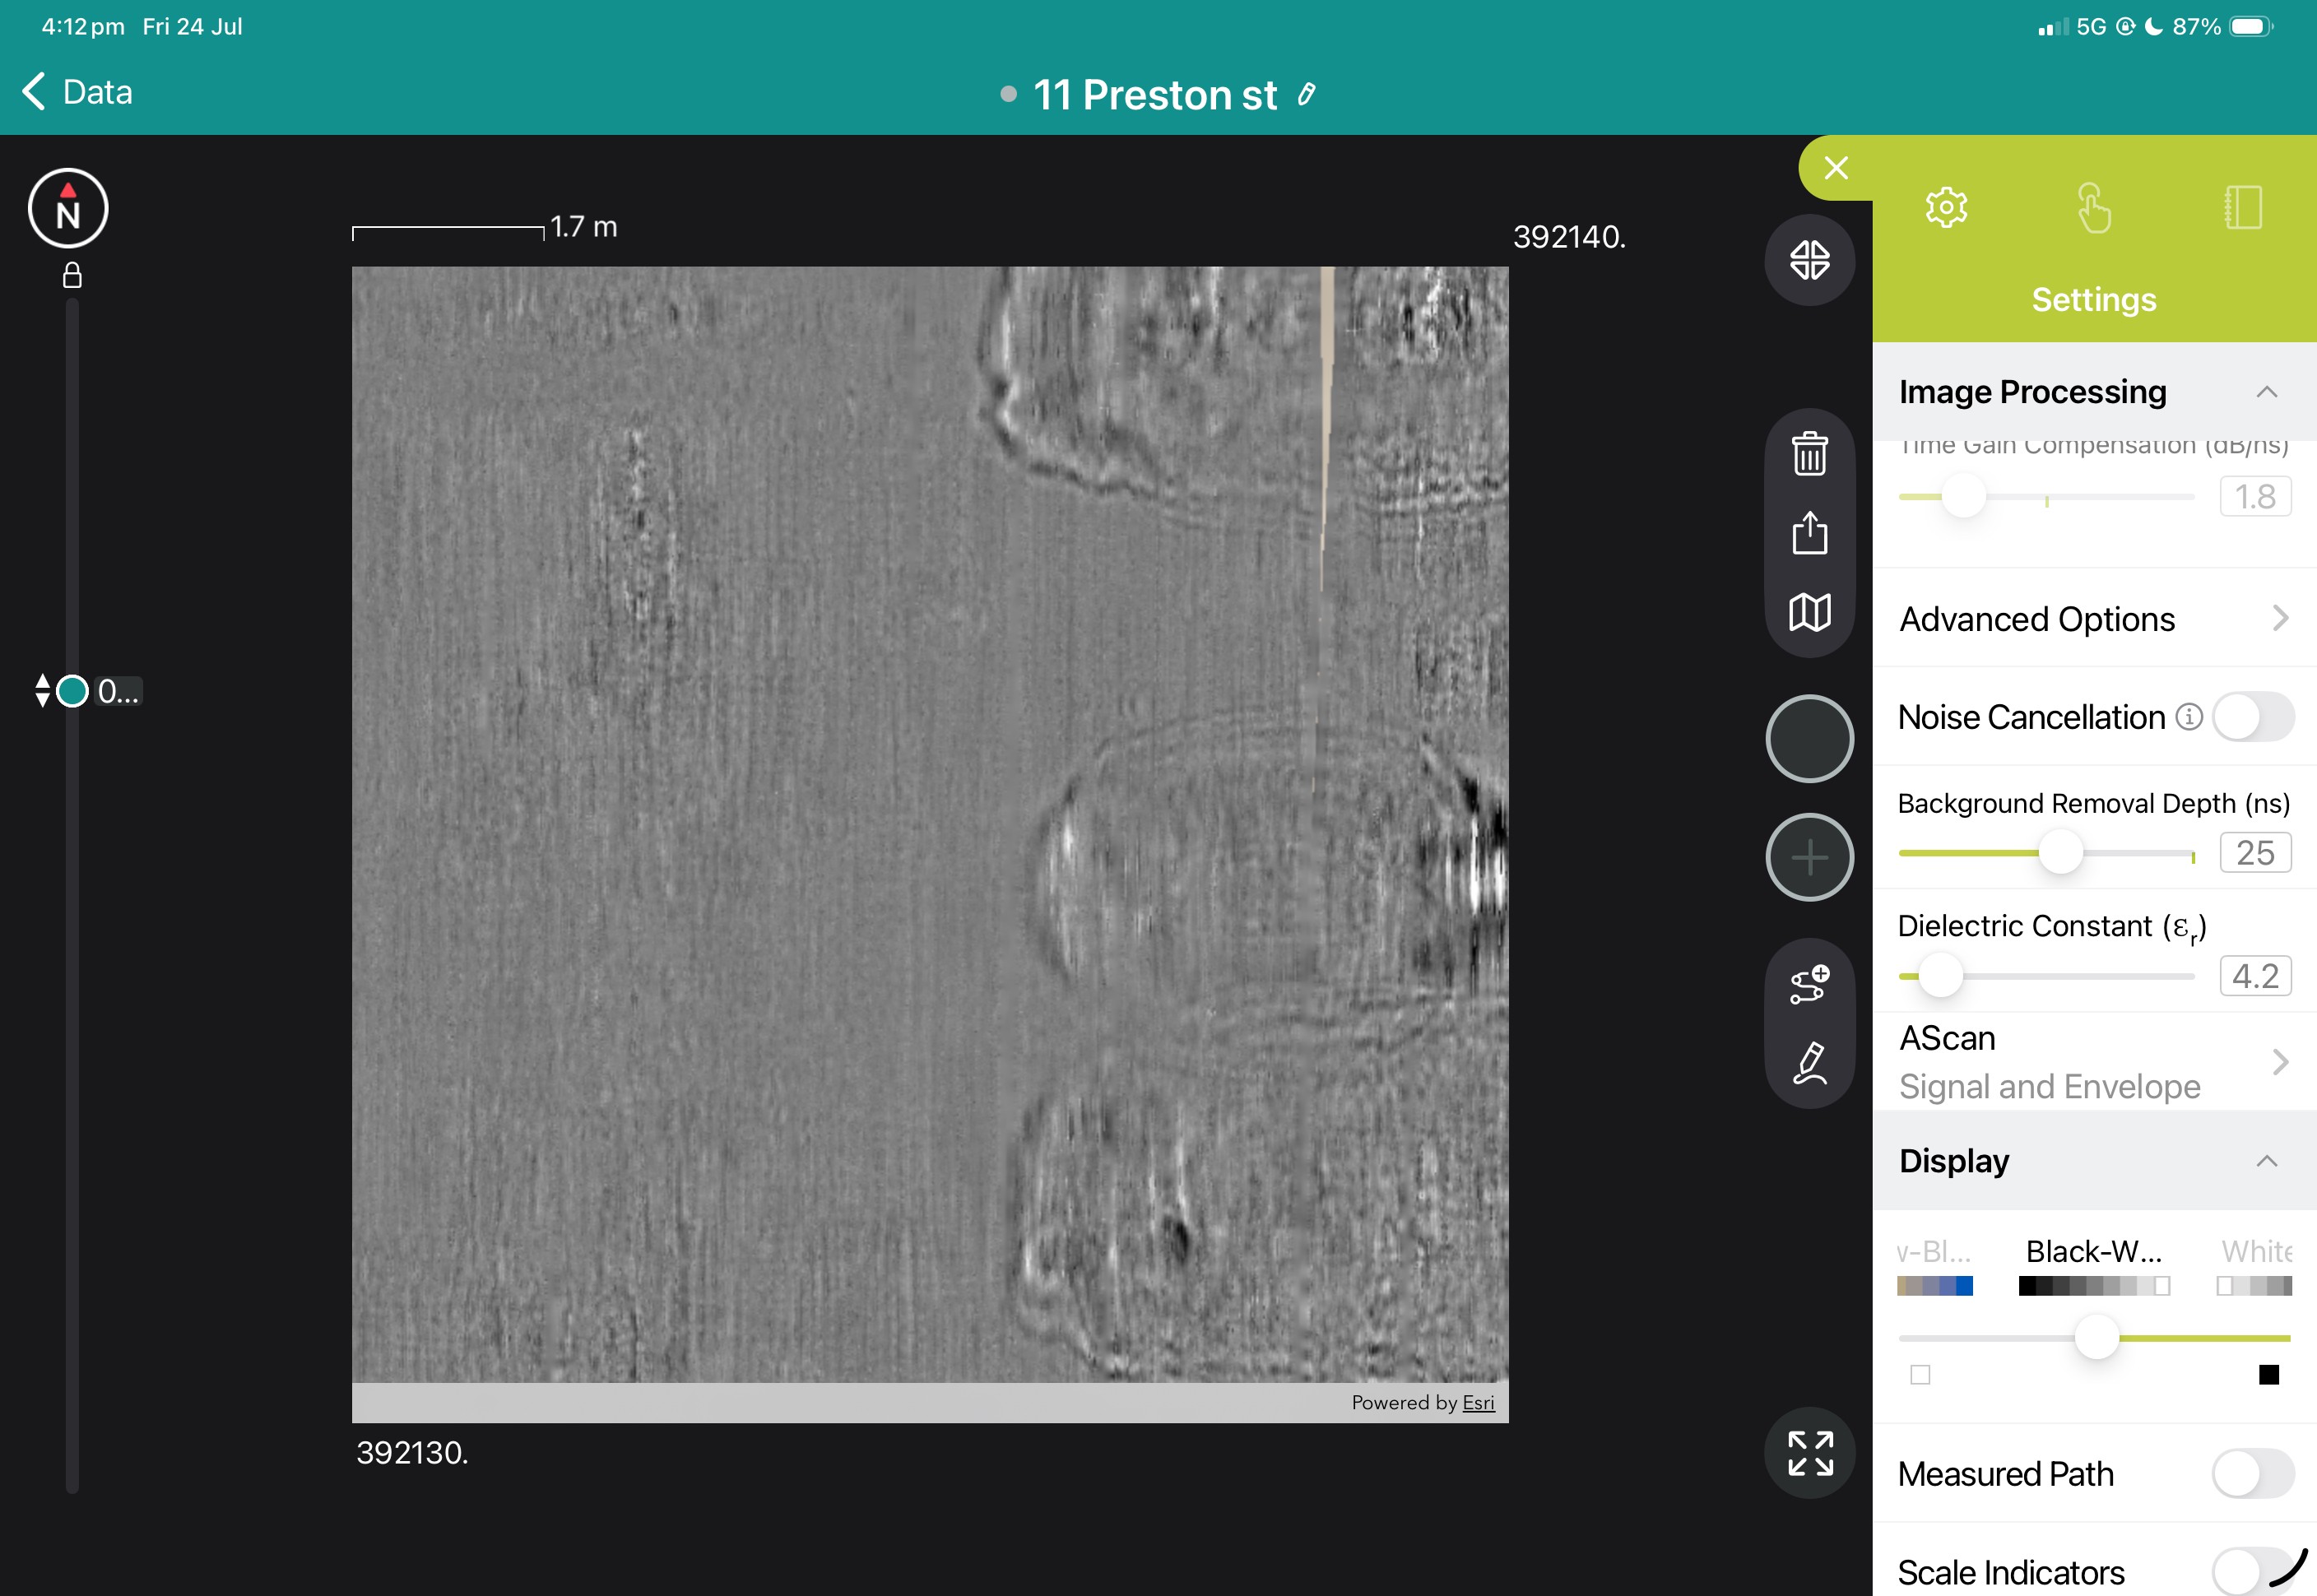
View the images below to see these in action.
Superline and B Scan from App
Freepath and b-scan from app
Geolocated tag on freepath in app
Freepath shown In GPR Insights without Hilbert Transformation
Geotagged linework added to a found sewer
3D view with a cutout showing the sewer
3d Sewer line with GPR data removed
Ideal for surface preparation as required by ISO 8502-4, BS 7079-B4, ASTM D3276, IMO PSPC, SSPC-PA7 and US Navy NSI 009-32.
Theory
The Positector DPM uses a dedicated air temperature/humidty sensors and thermocouple sensors for surface temperature.
The system measures and supplies live relative humidity, air temperature and surface temperature measurements, and calculates the dew point temperature. Advanced gauge models can also calculate and display wet bulb temperature.
How to select your probes
Built-in Probe
Includes built-in air temperature/humidity sensor and thermocouple surface temperature sensor
Separate Probe
Includes built-in air temperature/humidity sensor and K-type connector
Magnetic surface temperature sensor with armored cable and locking device to prevent accidental disconnection from the instrument during unattended operation
Includes magnetic tab to attach the gauge body onto steel structures
Easily converts to accept other optional K-type probes including:
Hand-held Surface Temperature Probe – for spot checking hard-to-reach surfaces
Self-adhering Surface Temperature Probe – sticks to solid materials including aluminium, wood, concrete, etc. Ideal for unattended monitoring.
Liquid Temperature Probe – general purpose probe with stainless steel shaft
Standard Gauge Features
Simple
Large, easy-to-read, graphics LCD
Enhanced one-handed menu navigation
No need to consult complex tables or use a slide rule calculator
Audio and visual alarm – indicates when climate conditions are unsuitable for painting
All readings are constantly updated and displayed simultaneously
RESET feature instantly restores factory settings
Dataset Storage Capacity (1 dataset = RH, Ta, Ts, Td, Ts–Td) Stored readings can be viewed or downloaded2,500 in one group
Auto Log Mode automatically records all 5 parameters at user selected time intervals. Runs unattended on batteries or continuously via USB.
Durable
Rugged, outdoor/indoor instrument
Solvent, acid, oil, water and dust resistant – weatherproof
Shock-absorbing, protective rubber holster with belt clip and wrist strap
Two (2) year warranty on body and probe
Accurate
Fast response precision sensors provide accurate, repeatable readings with high reliability and long term stability
SmartTrend™ Indicators identify rising, falling or stable readings
Certificate of Calibration showing traceability to NIST included
Conforms to national and international standards including ISO and ASTM
Versatile
PosiTector body accepts all PosiTector 6000, 200, DPM, UTG, RTR and SPG probes easily converting from a coating thickness gauge to a dew point meter, surface profile gauge or wall thickness gauge. View Video
Internal Memory stores datasets with the simple touch of a button
Auto Log Mode automatically records 5 parameters at user selected time intervals. Ideal for unattended operation.
Field calibratable
Celsius/Fahrenheit switchable
Selectable display languages
Hi Contrast backlit display for bright or dark environments
Flip display enables right-side-up viewing
Uses alkaline or rechargeable batteries (built-in charger)
Powerful
Hold function freezes the display allowing measurements to be manually recorded
USB port for fast, simple connection to a PC and to supply continuous power. USB cable included
Screen Capture - record and save image into USB flash memory for record keeping and review
Software updates via web keep your gauge current
PosiSoft solutions for viewing, analysing & reporting data:
PosiSoft Desktop v 4 - desktop software (PC/Mac) for downloading, viewing, printing and storing measurement data. Available as a free download.
PosiSoft.net account - a free web-based application offering secure storage of thickness readings
PosiSoft USB Drive - stored readings and graphs can be accessed using universal PC/ Mac web browsers or file explorers. No software required
Every stored measurement is date and time stamped
Additional Features on Advanced Models
Wet bulb temperature can be displayed(does not store in memory)
User defined limits for all parameters with visible and audible warnings
Trend Charts graph readings in real-time. View Video
Batch Annotation - Create meaningful batch names and enter notes directly on the instrument using a familiar on-screen QWERTY keyboard.
Real time graphing, picture prompting and batch notes
Systems Include
All gauges come complete with humidity, air and surface temperature sensors, protective rubber holster with belt clip and wrist strap, 3 AAA batteries, instructions, nylon carrying case with shoulder strap, protective lens shield, Certificate of Calibration traceable to NIST, USB cable, two (2) year warranty.
SIZE: 178 x 64 x 31 mm (7 x 2.5 x 1.2 in.)
WEIGHT: 185 g (6.5 oz.) without batteries
CONFORMS TO: ISO 8502-4, BS 7079-B4, and ASTM D3276
Why the GS9000 matters for SUE businesses
Increase area covered per field day
Reduce the number of manually positioned survey lines
Improve coverage in congested corridors
Review coverage before leaving site
Produce higher-value mapped deliverables
Combine GPR and GNSS in one workflow
Retain raw data for later reinterpretation
Expand from locating into mapping and subsurface modelling
High-resolution multichannel GPR for structures, bridges and pavements
The GX1 transforms the GS9000 into a high-resolution structural assessment system for concrete slabs, bridge decks and pavements. Its dense, dual-polarisation array captures detailed 3D data across wide areas, supporting reinforcement and cover mapping, moisture and deterioration assessment, and analysis of asphalt and pavement layers. Live visualisation helps confirm survey coverage on site, while post-processing tools produce clear, report-ready condition maps.
Bridge-deck reinforcement and condition mapping
Concrete-cover mapping
Reinforcement layout and spacing
Moisture-related and deterioration mapping
Asphalt and pavement-layer thickness
Road and runway investigations
Detection of embedded features
Large-area concrete-slab investigations
Comparative and repeat surveys
The structural assessment workflow
1. Define the inspection area
Import the structure, bridge, pavement or survey background.
2. Collect closely spaced profiles
Capture 35 longitudinal and 15 cross-polarised channels with dense spacing.
3. Review coverage in the field
Use live radargrams and time slices to confirm that the required area has been captured.
4. Process the dataset
Apply velocity, gain, background removal, migration, filtering and topographic correction as appropriate.
5. Generate diagnostic maps
Create depth slices, reinforcement maps, layer information or application-specific condition maps.
6. Integrate with the engineering assessment
Export figures, mapped anomalies and raw data for inclusion in the engineer’s final interpretation and report.
Structural outputs and engineering value
Field information
Live radargrams
Coverage map
Time-slice preview
Field annotations
Processed Diagnostic Information
2D and 3D views
Depth slices
Reinforcement patterns
Cover trends
Layer-thickness information
Comparative amplitude or condition maps
Engineering deliverables
Georeferenced maps
Marked investigation areas
Selected radar profiles
Exported images and datasets
CAD/GIS overlays
Report-ready figures
View some of these features at work below, and our case study if you'd like to see more of what the GS9000 can do.
%20vector%20logo.svg)