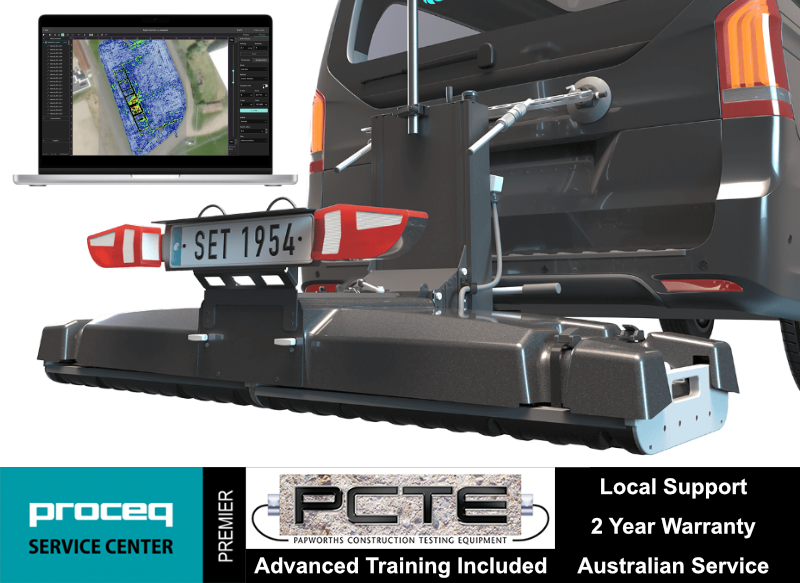
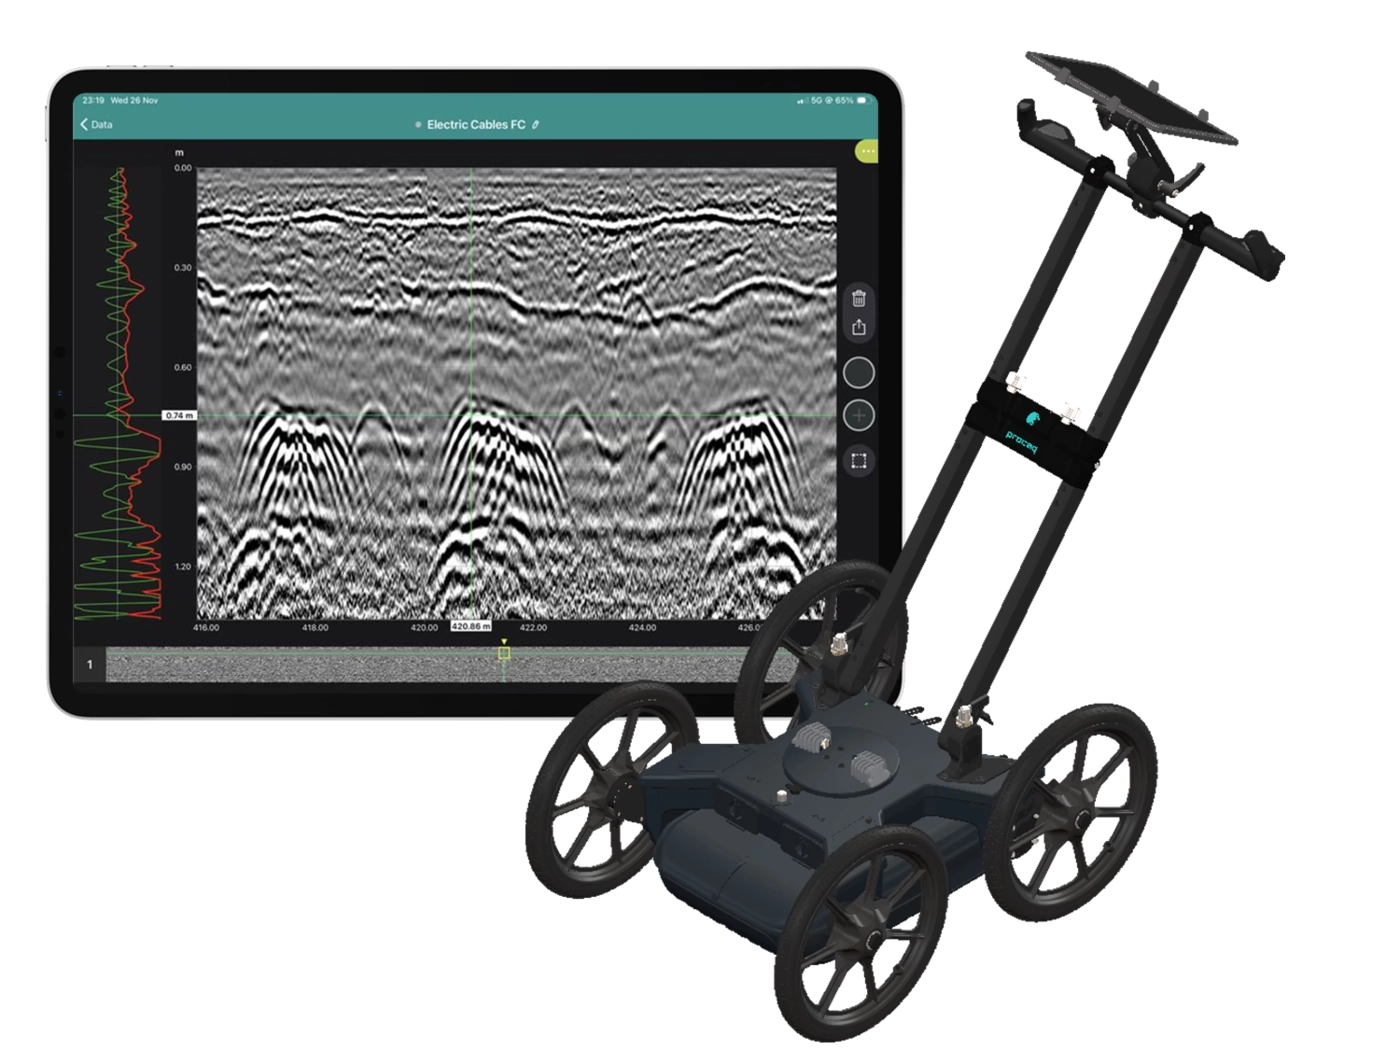
Collect high-density, georeferenced GPR data across wide areas and view the subsurface in 3D as you scan. Choose the GX2 array for SUE and utility mapping, or the GX1 array for structural, bridge and pavement investigations.
Why use the GS9000 instead of a conventional single-channel GPR?
Cover more ground
Collect multiple parallel profiles in one pass instead of uilding a grid line by line.
See results during acquisition
View georeferenced radargrams and time-slice information in the field rather than waiting until the data is returned to the office.
Produce repeatable mapped data
Combine wheel-positioned GPR data with GNSS, project coordinates and survey linework.
Use one platform for two very different applications
Exchange GX1 and GX2 arrays without purchasing two complete cart platforms.
High-density 3D GPR mapping for SUE and utility investigations
The GX2 transforms the GS9000 into a high-density subsurface utility mapping system. Its 11-channel, low-frequency GPR array captures an 83 cm-wide swath in each pass, helping operators detect and map buried pipes, ducts, cables, voids and other subsurface features. Live georeferenced data lets SUE teams review coverage on site and produce accurate CAD, GIS and project-coordinate deliverables.
Utility corridor mapping
Detection of pipes, ducts and cables
Mapping non-conductive services that may not respond to electromagnetic locating
Congested service investigations
Road-crossing and easement surveys
Potential void and cavity investigation
Pre-excavation and design-stage surveys
Utility mapping to project or local coordinates
The SUE field workflow
1. Plan the survey
Load satellite imagery, CAD information, project coordinates or survey control.
2. Collect dense multichannel data
Survey an approximately 0.82 m-wide swath with 11 channels in each pass.
3. Review data live
Examine radargrams, georeferenced time slices and marked features while still on site.
4. Interpret and digitise
Add points, linework, tags, photographs and field observations.
5. Process and deliver
Merge survey areas, apply processing and export mapped information for the customer’s CAD, GIS or reporting workflow.
SUE Outputs and Deliverables
Georeferenced time-slice maps
Radar profiles
Utility alignments and interpreted linework
Depth estimates
Survey trajectory
Points of interest
Field photographs and annotations
CAD, SHP and KML outputs
SEG-Y raw-data export
Project-coordinate and local-grid outputs
PDF or shareable project reports
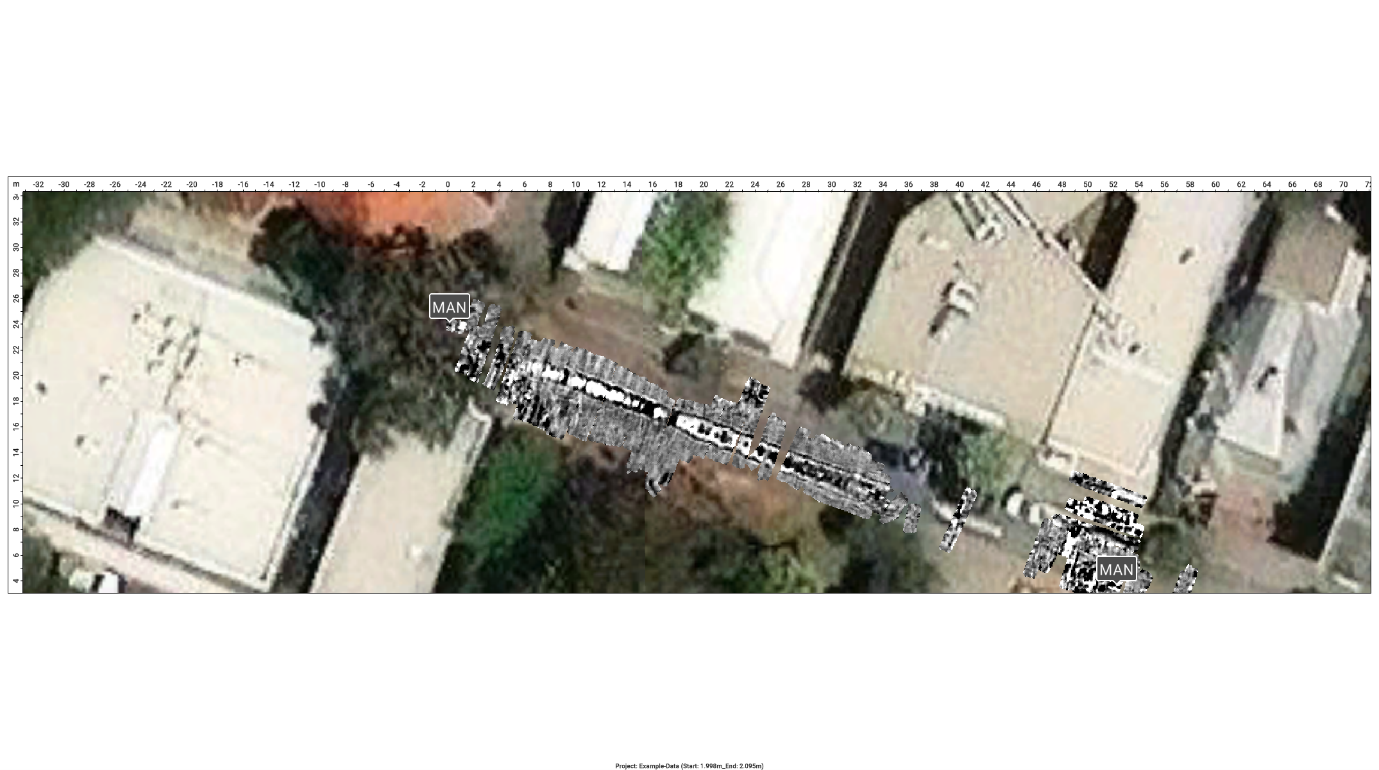
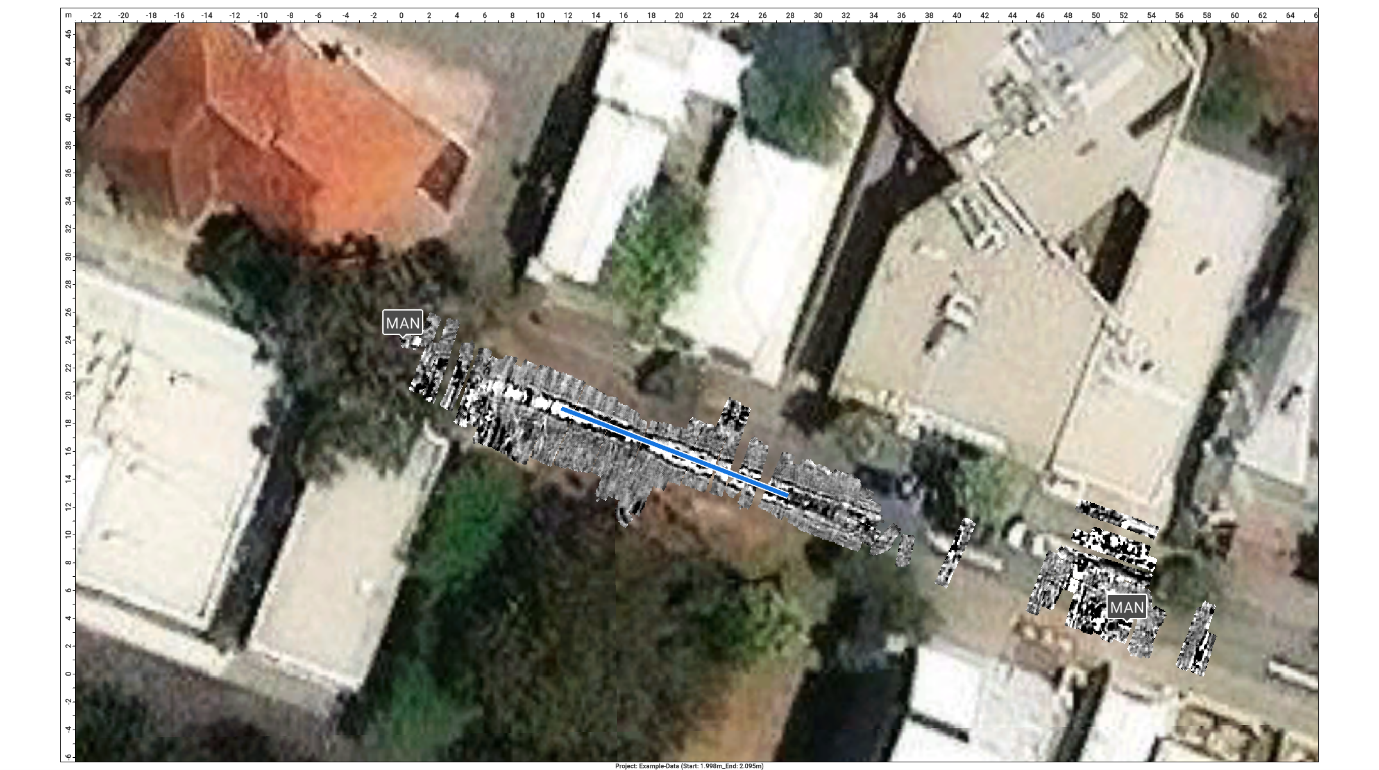
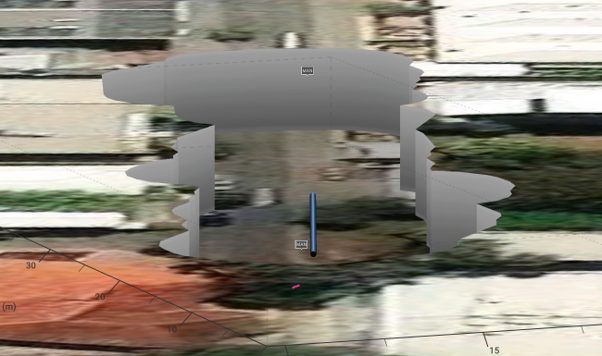
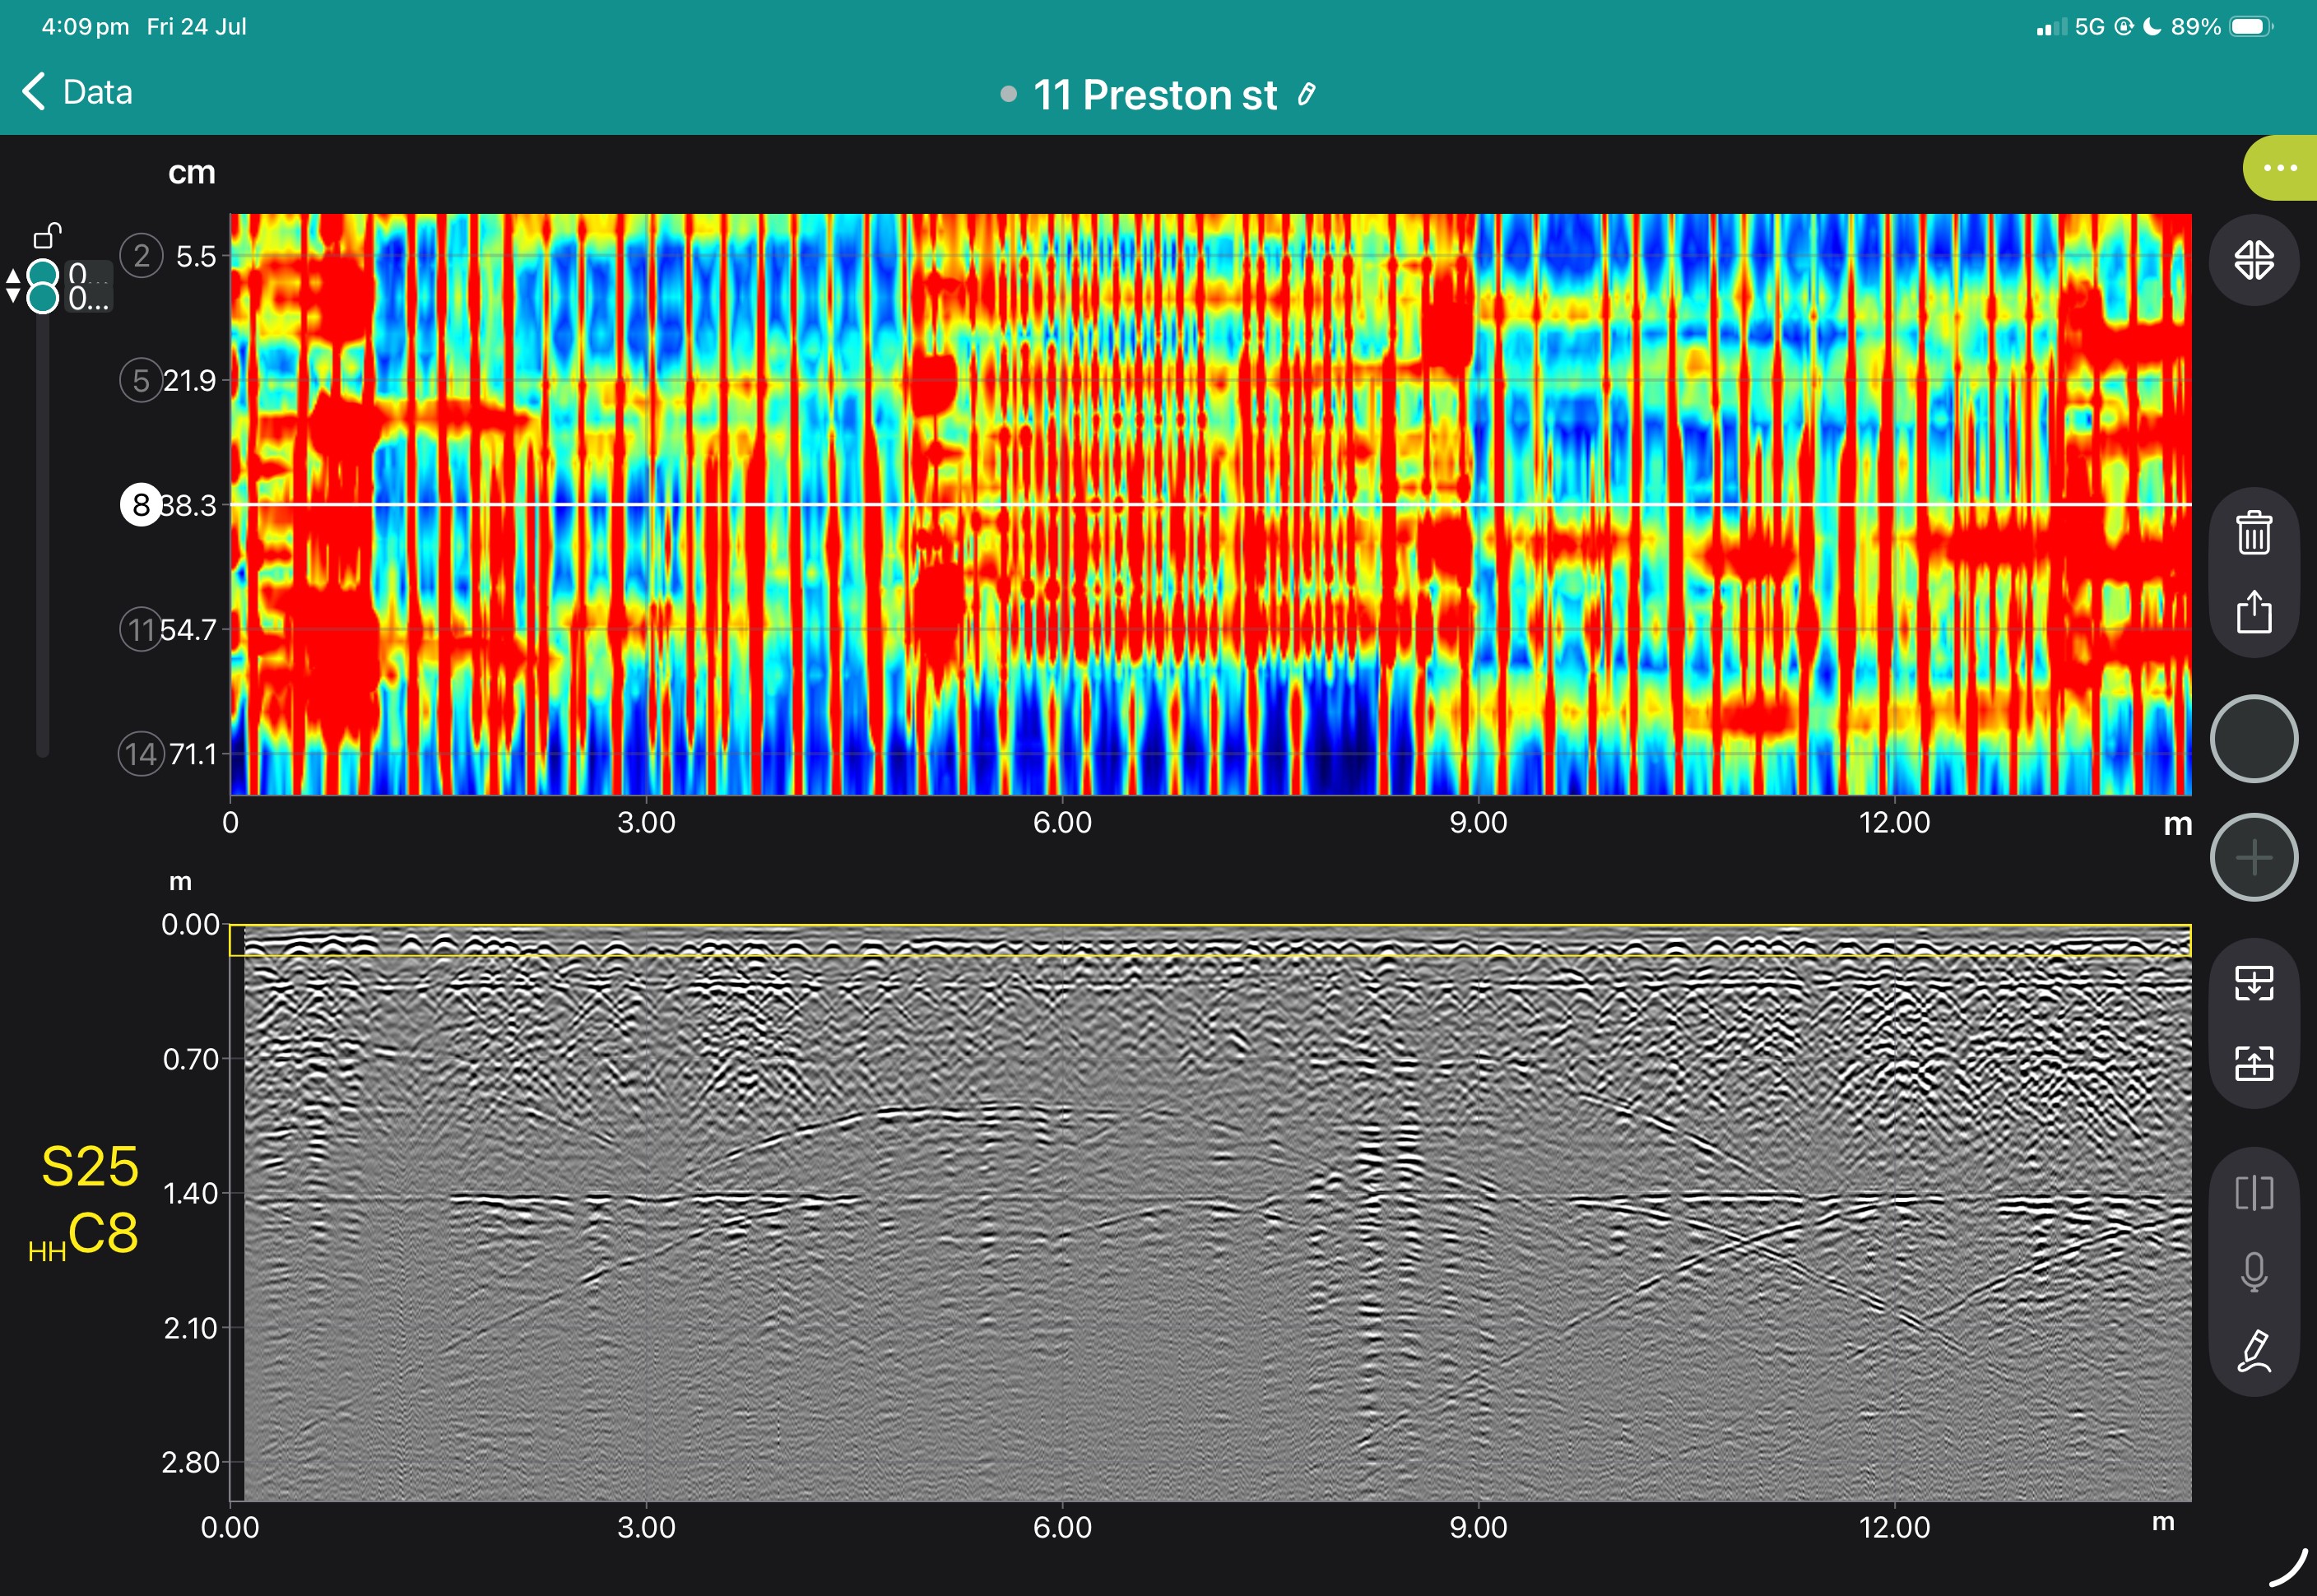
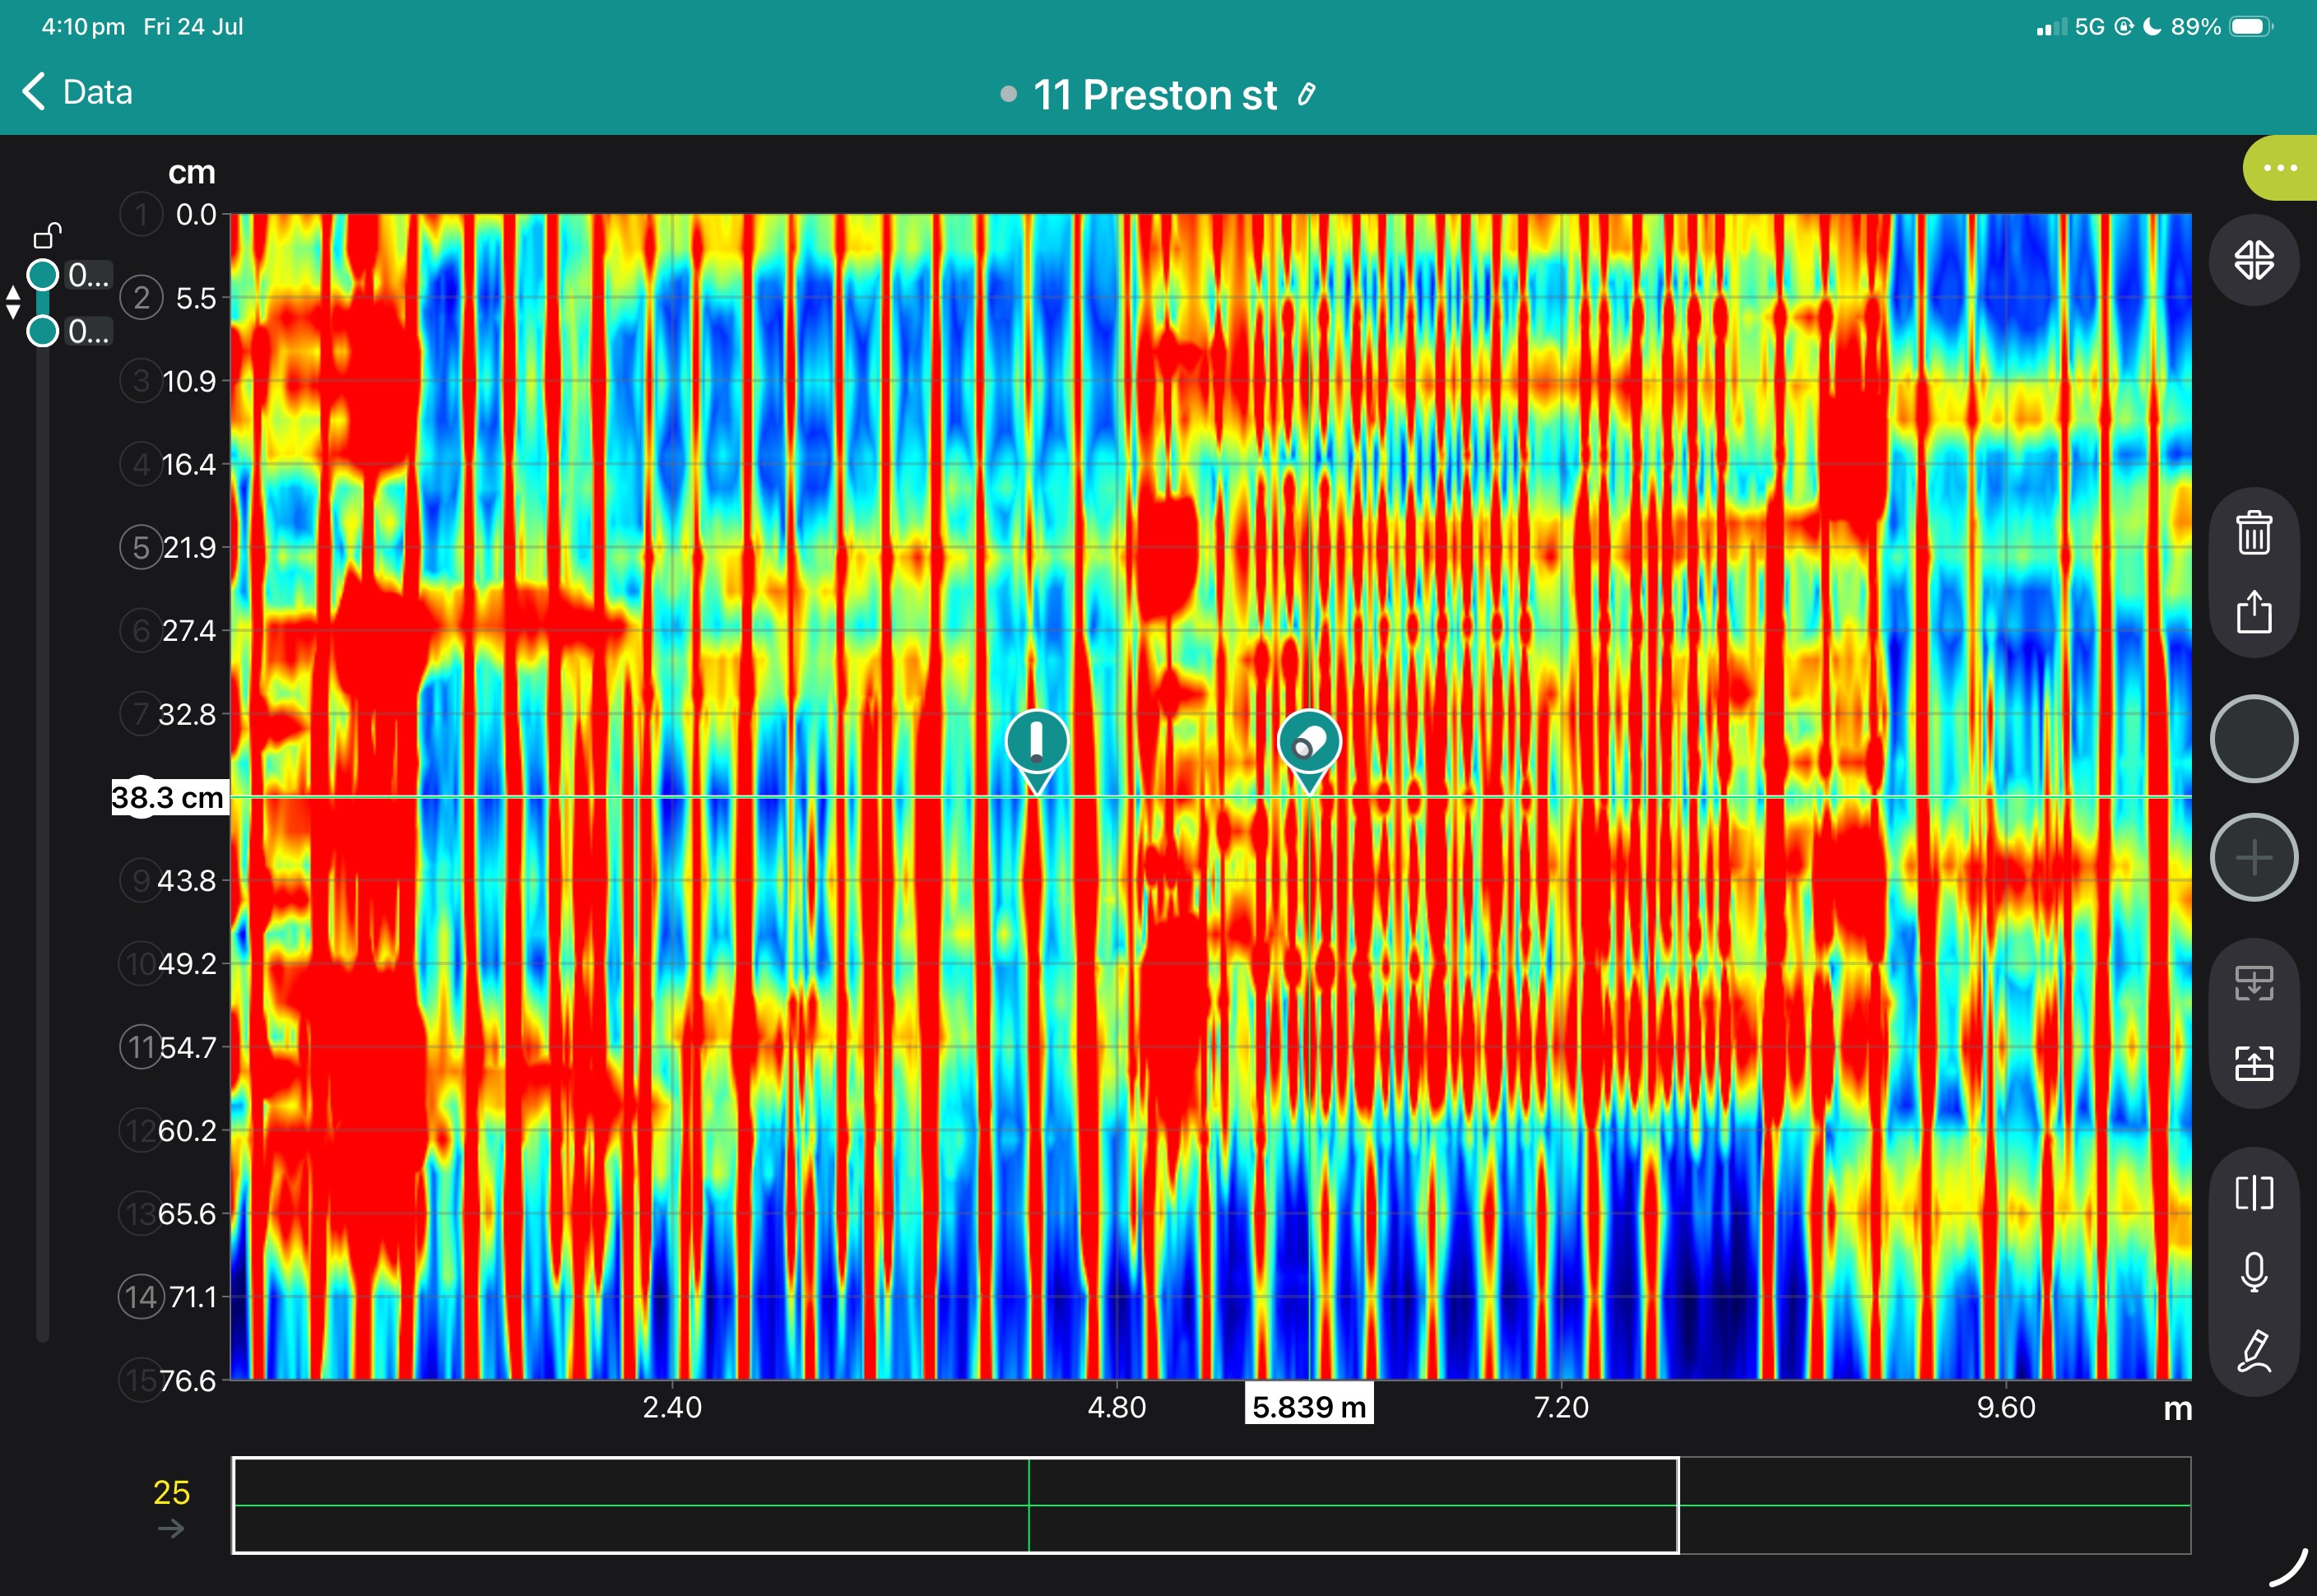
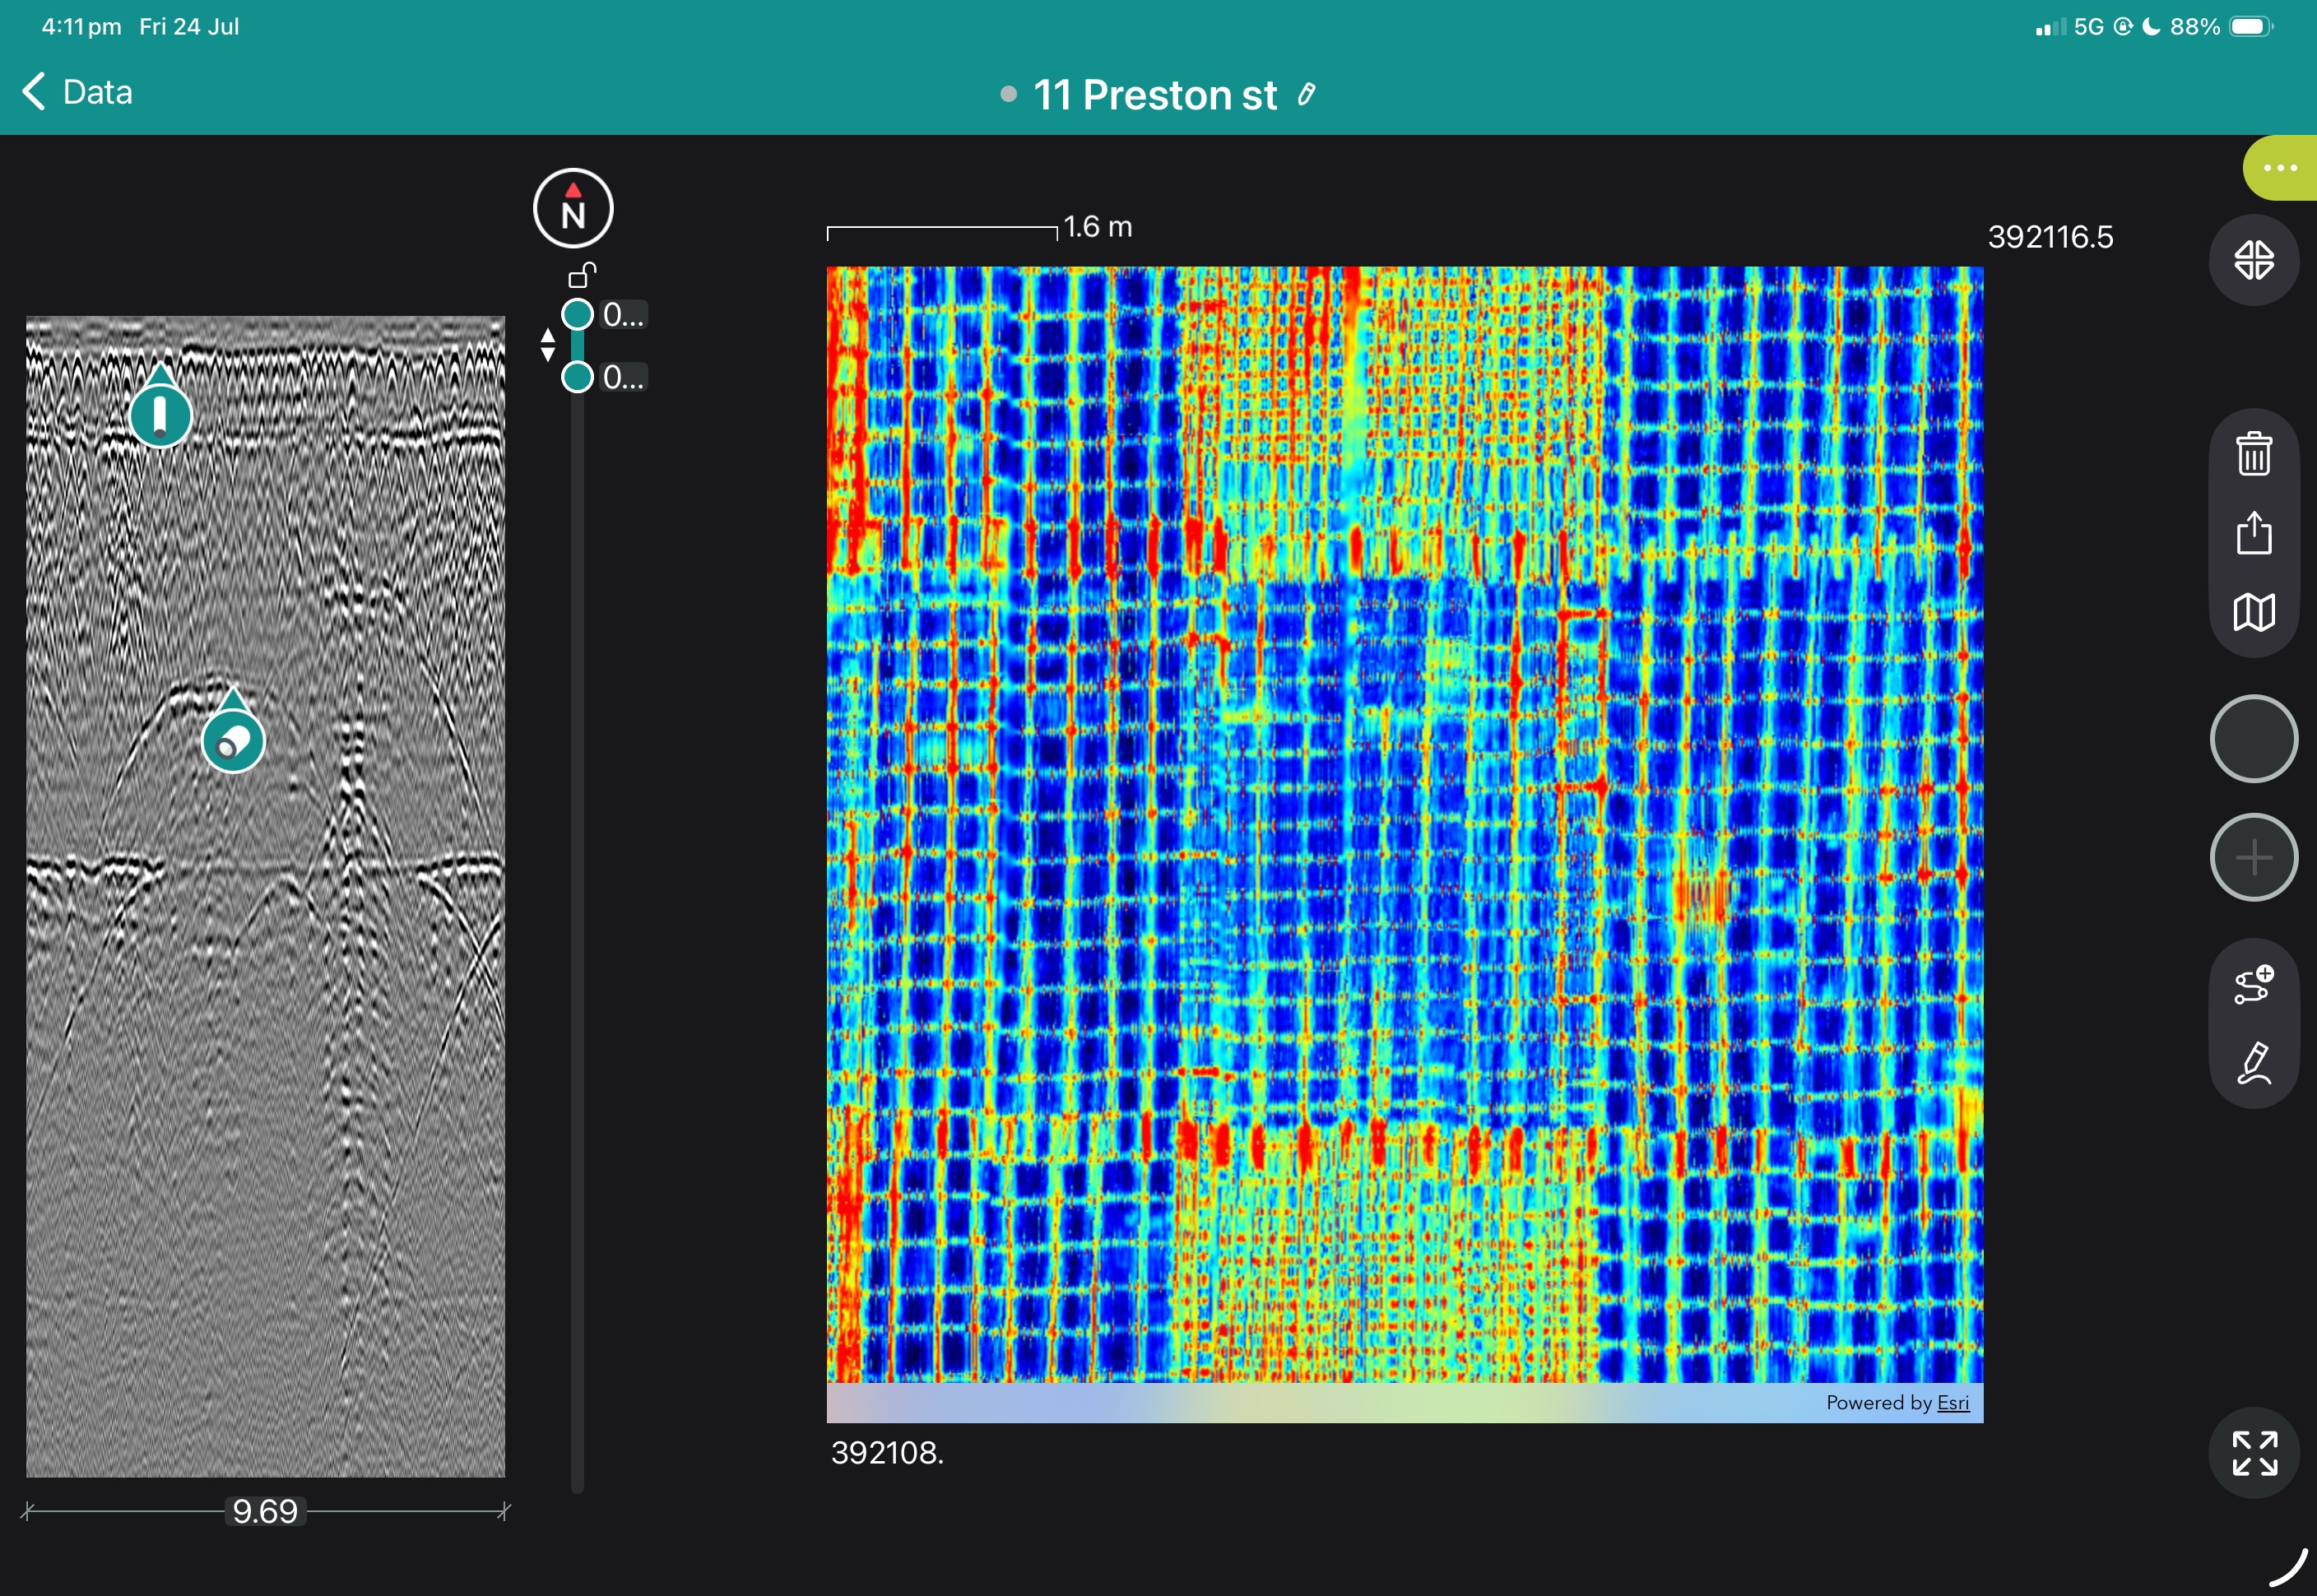
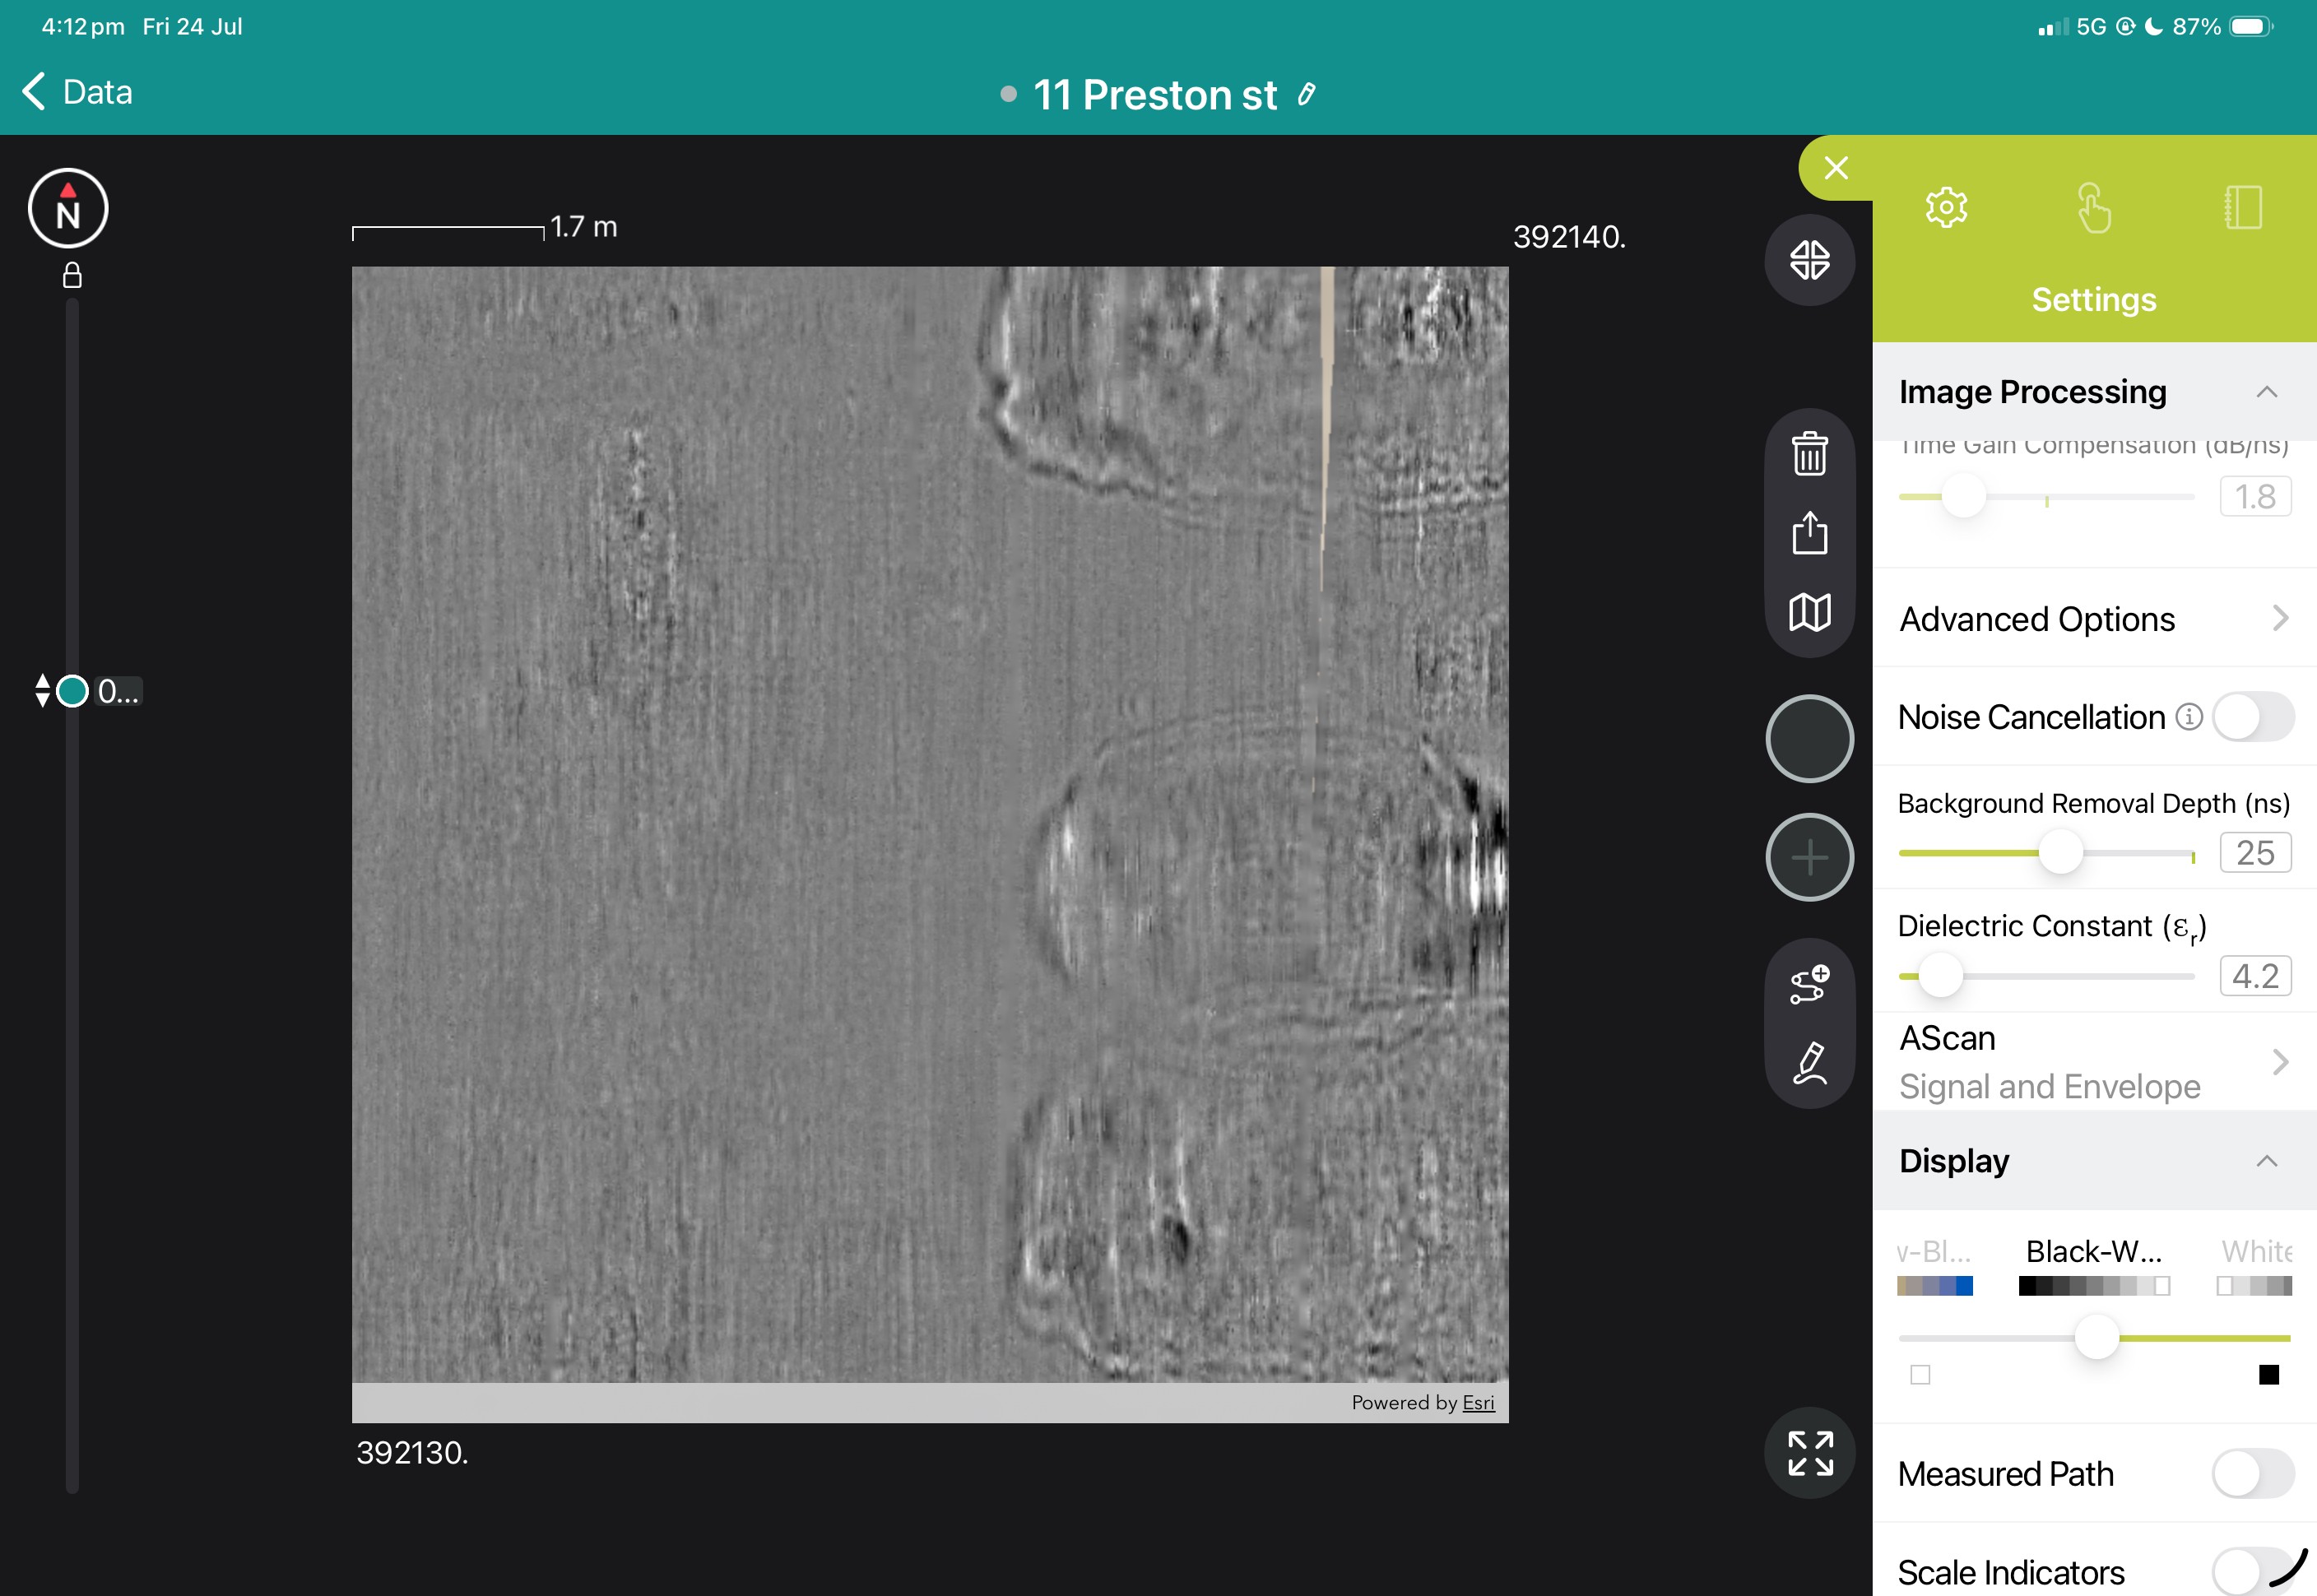
View the images below to see these in action.
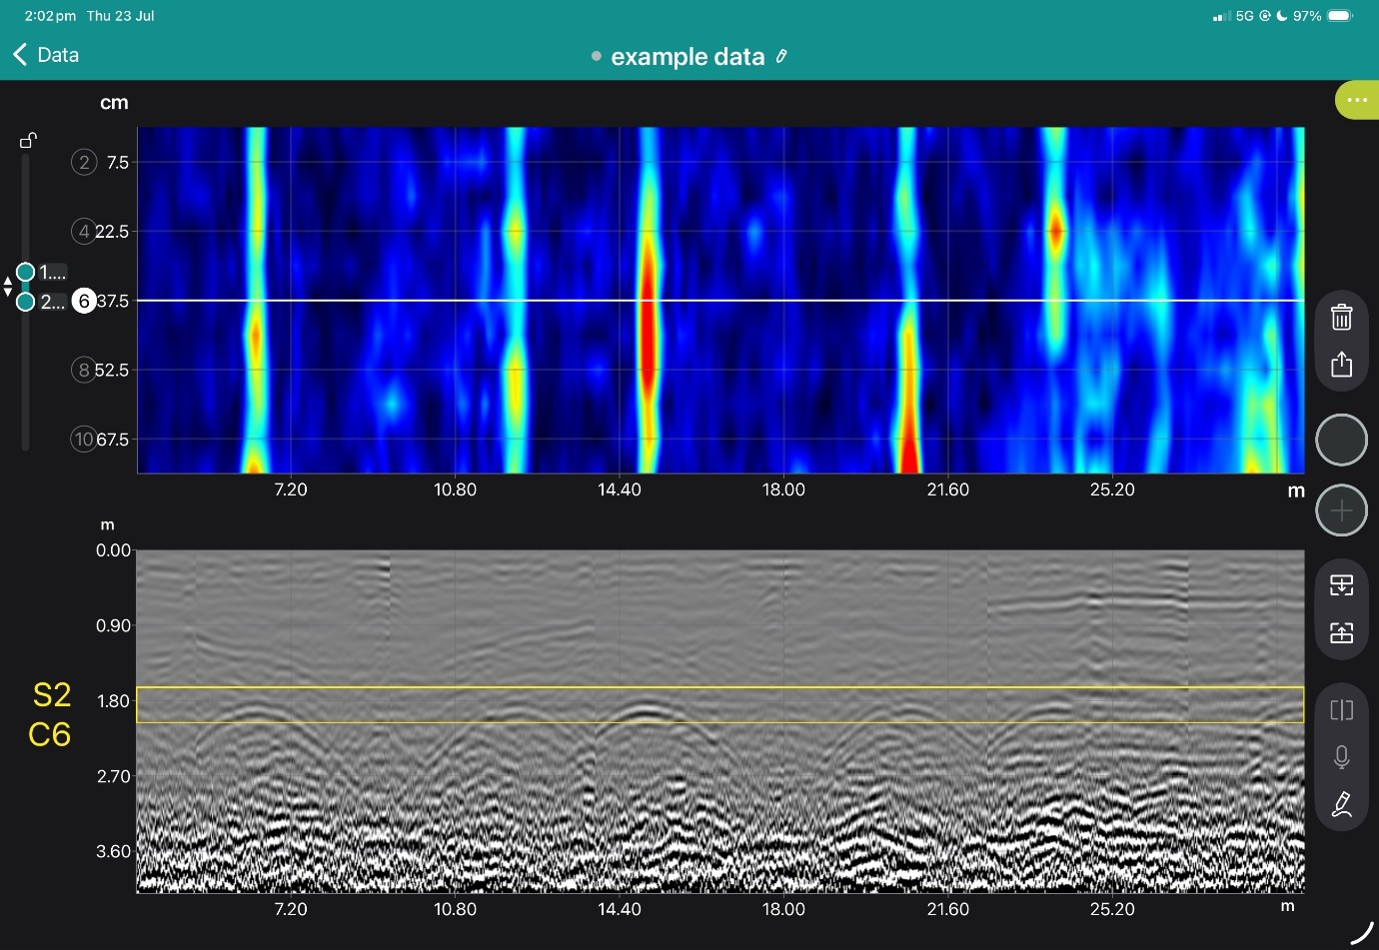
Superline and B Scan from App
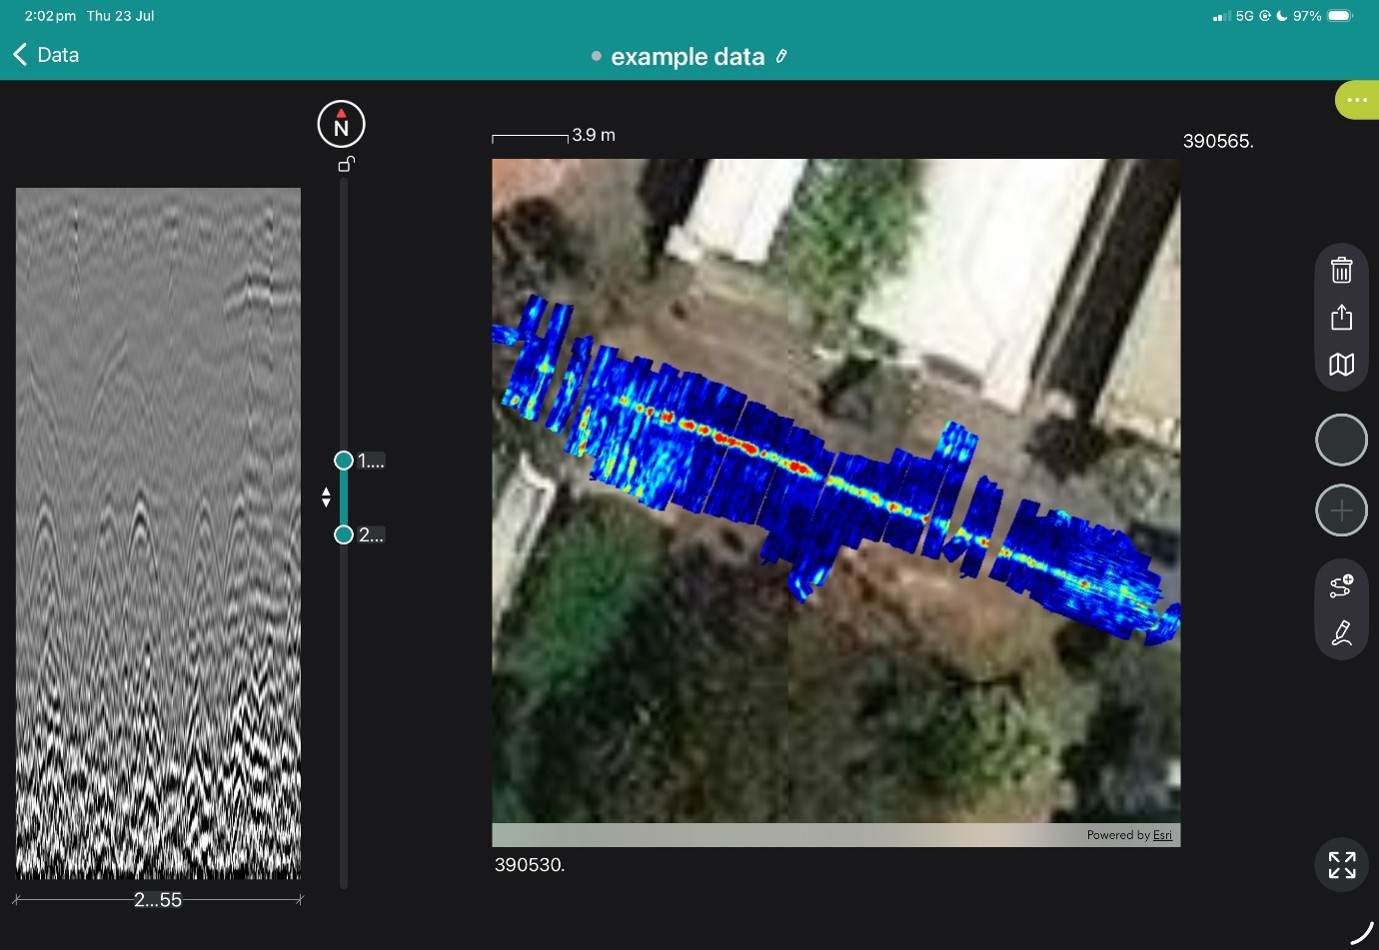
Freepath and b-scan from app
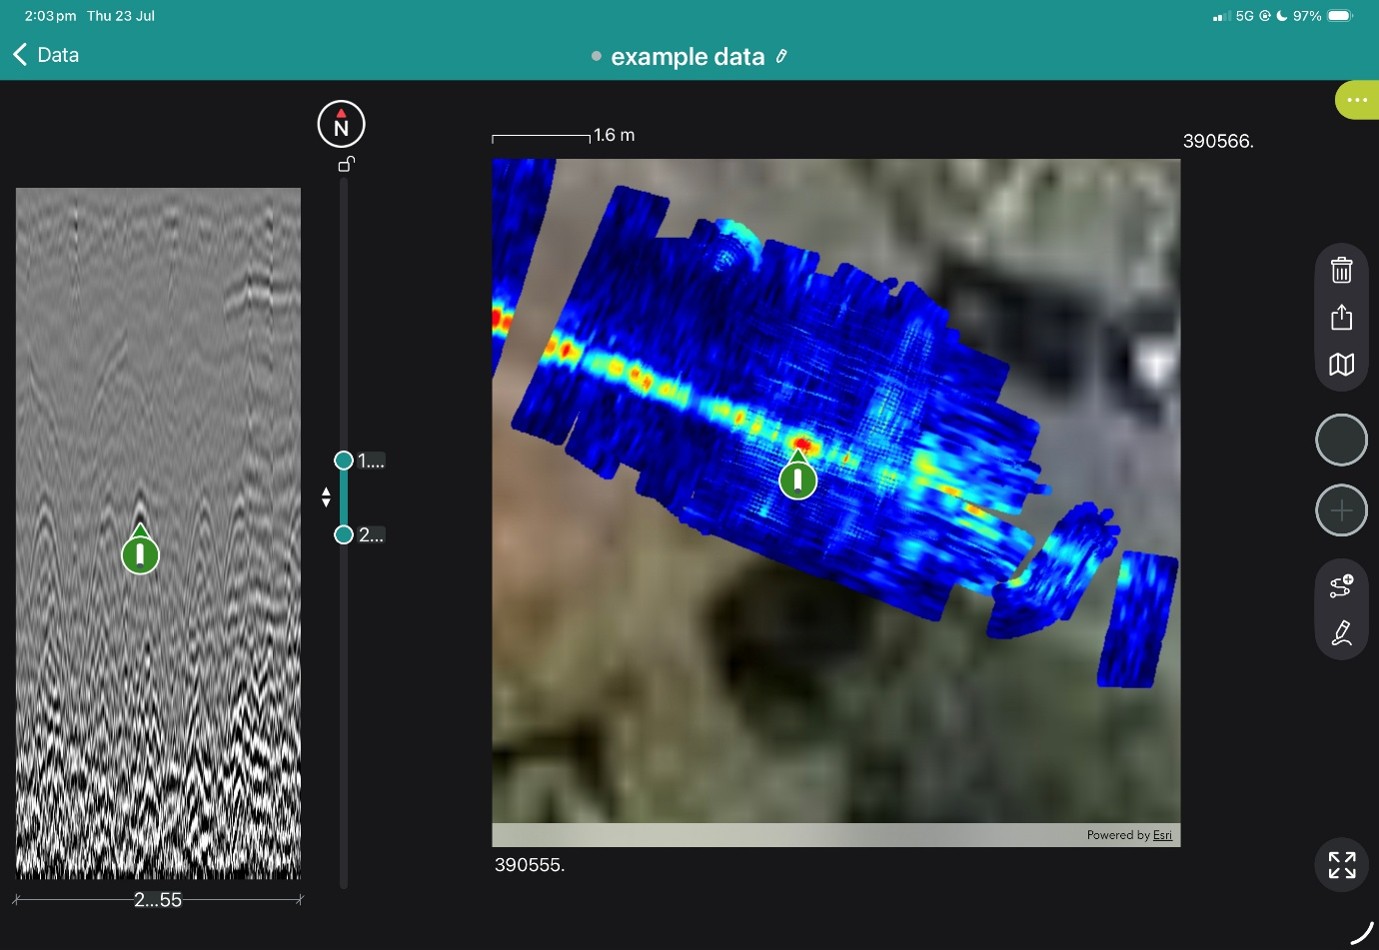
Geolocated tag on freepath in app
Freepath shown In GPR Insights without Hilbert Transformation
Geotagged linework added to a found sewer
3D view with a cutout showing the sewer
3d Sewer line with GPR data removed
Coating failures often begin with minor flaws, a Holiday Detector is able to locate flaws that cannot be seen by eye, including thin and missing coating.
Pulsed DC models are suitable for use over low conductivity, dirty or damp surfaces, even concrete.
The PosiTest HHD is flexible, with an included standard fan brush electrode. Also available are optional flat wire electrodes, conductive rubber flat and rolling spring to surround columns and pipes.
Adaptors are available for all common brands of electrode, and the unit can be converted into a wand configuration if voltages required are <15 kV
Conforms to AS 3894.1 and international standards.
Features
Detects holidays, pinholes and other discontinuities using pulsed DC
Strobe light and loud audible alarm when a holiday is detected.
Voltage calculator feature — choose one of 11 international standards, and input the coating thickness to automatically calculate the required test voltage
Easy-to-use with bright, multicolour LCD
Press and hold Safety Trigger helps prevent accidental high voltage generation
Two year warranty
Theory
A holiday detector is a non-destructive instrument for detecting discontinuities in a coating system including holidays, pinholes, and cracks. Other names include porosity detector, continuity tester, and holiday tester.
A high-voltage holiday test is performed by moving a charged electrode over the coated surface. When a holiday is encountered, current flows from the electrode into the substrate. The current returns to the detector through the ground (earth) wire, completing the circuit and triggering audible and visible alarms. An integrated peak reading voltmeter measures and displays the output voltages on the display while in use.
There are two types of pinhole detectors: low voltage (wet sponge) and high voltage (spark tester). Low voltage detectors, like the PosiTest LPD, are typically used on coating systems less than 500 µm (20 mils) thick. High voltage spark testers, like the PosiTest HHD operate at voltages up to 35,000V and are typically used on coatings more than 500 µm (20 mils) thick.
Test Kit and Accessories
The HHD kit is supplied in a complete kit with:
PosiTest HHD, 7.6 m (25') ground (earth) cable with ground clip
Li-ion battery pack with built-in charge state indicator
Smart charger with universal AC voltage input
Stainless steel fan brush, 50 cm (20" ) extension rod with thumb screw
Shoulder strap, Instruction Manual, Durable Pelican Storm case
Long Form Certificate of Calibration traceable to NIST
Two year warranty
A range of accessories are available for the HHD, including adaptors for electrodes, extension rods and handheld wand tools:
Electrodes
Rolling Spring steel pipe electrodes — assorted sizes available: 10 to 60 cm (4 – 24”) Rolling springs include two pre-installed spring couplers
Flat Wire Brush stainless steel — assorted sizes available: 5 to 120 cm (2 – 48”)
Replacement Fan Brush stainless steel — 5 cm (2”)
Conductive Rubber Paddle 10 cm (4”) handheld paddle
HHD Verifier
The PosiTest HHD Verifier is a calibrated voltmeter (crest meter, jeep meter) ideal for verifying the operating voltage of both Pulse and Continuous DC holiday detectors in the range from 500 to 35,000 Volts.
Ideal for field/laboratory verification of the PosiTest HHD High voltage Holiday Detector
Accessories
Handheld Wand with 1.5 m insulated cable converts the detector to a wand-type instrument (not for voltages >15 kV)
Extension Rods choose between 13 cm (5”) and 50 cm (20”) rods
Spring Connectors connect the PosiTest HHD to DeFelsko or SPY rolling spring
electrodes.
Spring Couplers thread onto rolling springs and attach to the Spring Connector
HHD Adaptors connect to spring and brush electrodes from other manufacturers — choose between PCWI and T&R adaptors (adaptor not required for SPY electrodes)
Why the GS9000 matters for SUE businesses
Increase area covered per field day
Reduce the number of manually positioned survey lines
Improve coverage in congested corridors
Review coverage before leaving site
Produce higher-value mapped deliverables
Combine GPR and GNSS in one workflow
Retain raw data for later reinterpretation
Expand from locating into mapping and subsurface modelling
High-resolution multichannel GPR for structures, bridges and pavements
The GX1 transforms the GS9000 into a high-resolution structural assessment system for concrete slabs, bridge decks and pavements. Its dense, dual-polarisation array captures detailed 3D data across wide areas, supporting reinforcement and cover mapping, moisture and deterioration assessment, and analysis of asphalt and pavement layers. Live visualisation helps confirm survey coverage on site, while post-processing tools produce clear, report-ready condition maps.
Bridge-deck reinforcement and condition mapping
Concrete-cover mapping
Reinforcement layout and spacing
Moisture-related and deterioration mapping
Asphalt and pavement-layer thickness
Road and runway investigations
Detection of embedded features
Large-area concrete-slab investigations
Comparative and repeat surveys
The structural assessment workflow
1. Define the inspection area
Import the structure, bridge, pavement or survey background.
2. Collect closely spaced profiles
Capture 35 longitudinal and 15 cross-polarised channels with dense spacing.
3. Review coverage in the field
Use live radargrams and time slices to confirm that the required area has been captured.
4. Process the dataset
Apply velocity, gain, background removal, migration, filtering and topographic correction as appropriate.
5. Generate diagnostic maps
Create depth slices, reinforcement maps, layer information or application-specific condition maps.
6. Integrate with the engineering assessment
Export figures, mapped anomalies and raw data for inclusion in the engineer’s final interpretation and report.
Structural outputs and engineering value
Field information
Live radargrams
Coverage map
Time-slice preview
Field annotations
Processed Diagnostic Information
2D and 3D views
Depth slices
Reinforcement patterns
Cover trends
Layer-thickness information
Comparative amplitude or condition maps
Engineering deliverables
Georeferenced maps
Marked investigation areas
Selected radar profiles
Exported images and datasets
CAD/GIS overlays
Report-ready figures
View some of these features at work below, and our case study if you'd like to see more of what the GS9000 can do.
%20vector%20logo.svg)