Phone: 02 9453 9999 or Email: sales-operations@pcte.com.au

Measurement of the transmission or reflection of compression wave (p-wave / sound) and shear wave (s-wave) energy in concrete is commonly referred to as ultrasonic testing.
Single channel systems most commonly use two transducers, piezoelectric units that can both produce P-Wave or S-Wave energy and detect the arrival of this energy, analogous to a speaker and microphone combined. UPV measurements use a sending and receiving transducer to measure time of transmission through concrete, calculating transmission speed.
Ultrasonic Pulse Echo Array units will use many transducers, most commonly configured as a 2D shear wave array, allowing a 2D slice along the length of the array to be imaged. Transducers engage in sequence, with all other transducers recording the signal arrival.
The signal arrival can be processed into signal intensity map, with strongest response from the interface between concrete and air such as voiding and the back end of the concrete element.
The most common work for UPE Arrays is to locate voiding and poor consolidation in bulk concrete. It may also be used to locate embedded rebar, especially where steel fibre reinforcing prevents location with a cover meter or concrete GPR.
Less commonly UPE arrays are used to measure the thickness of concrete from one face or to measure Shear Wave Velocity in structures of a known thickness.
Grouting defects in grout tubes in precast elements or post-tension tendons ducts may be detected using a combination of signal strength and phase analysis interpretation, detailed below.
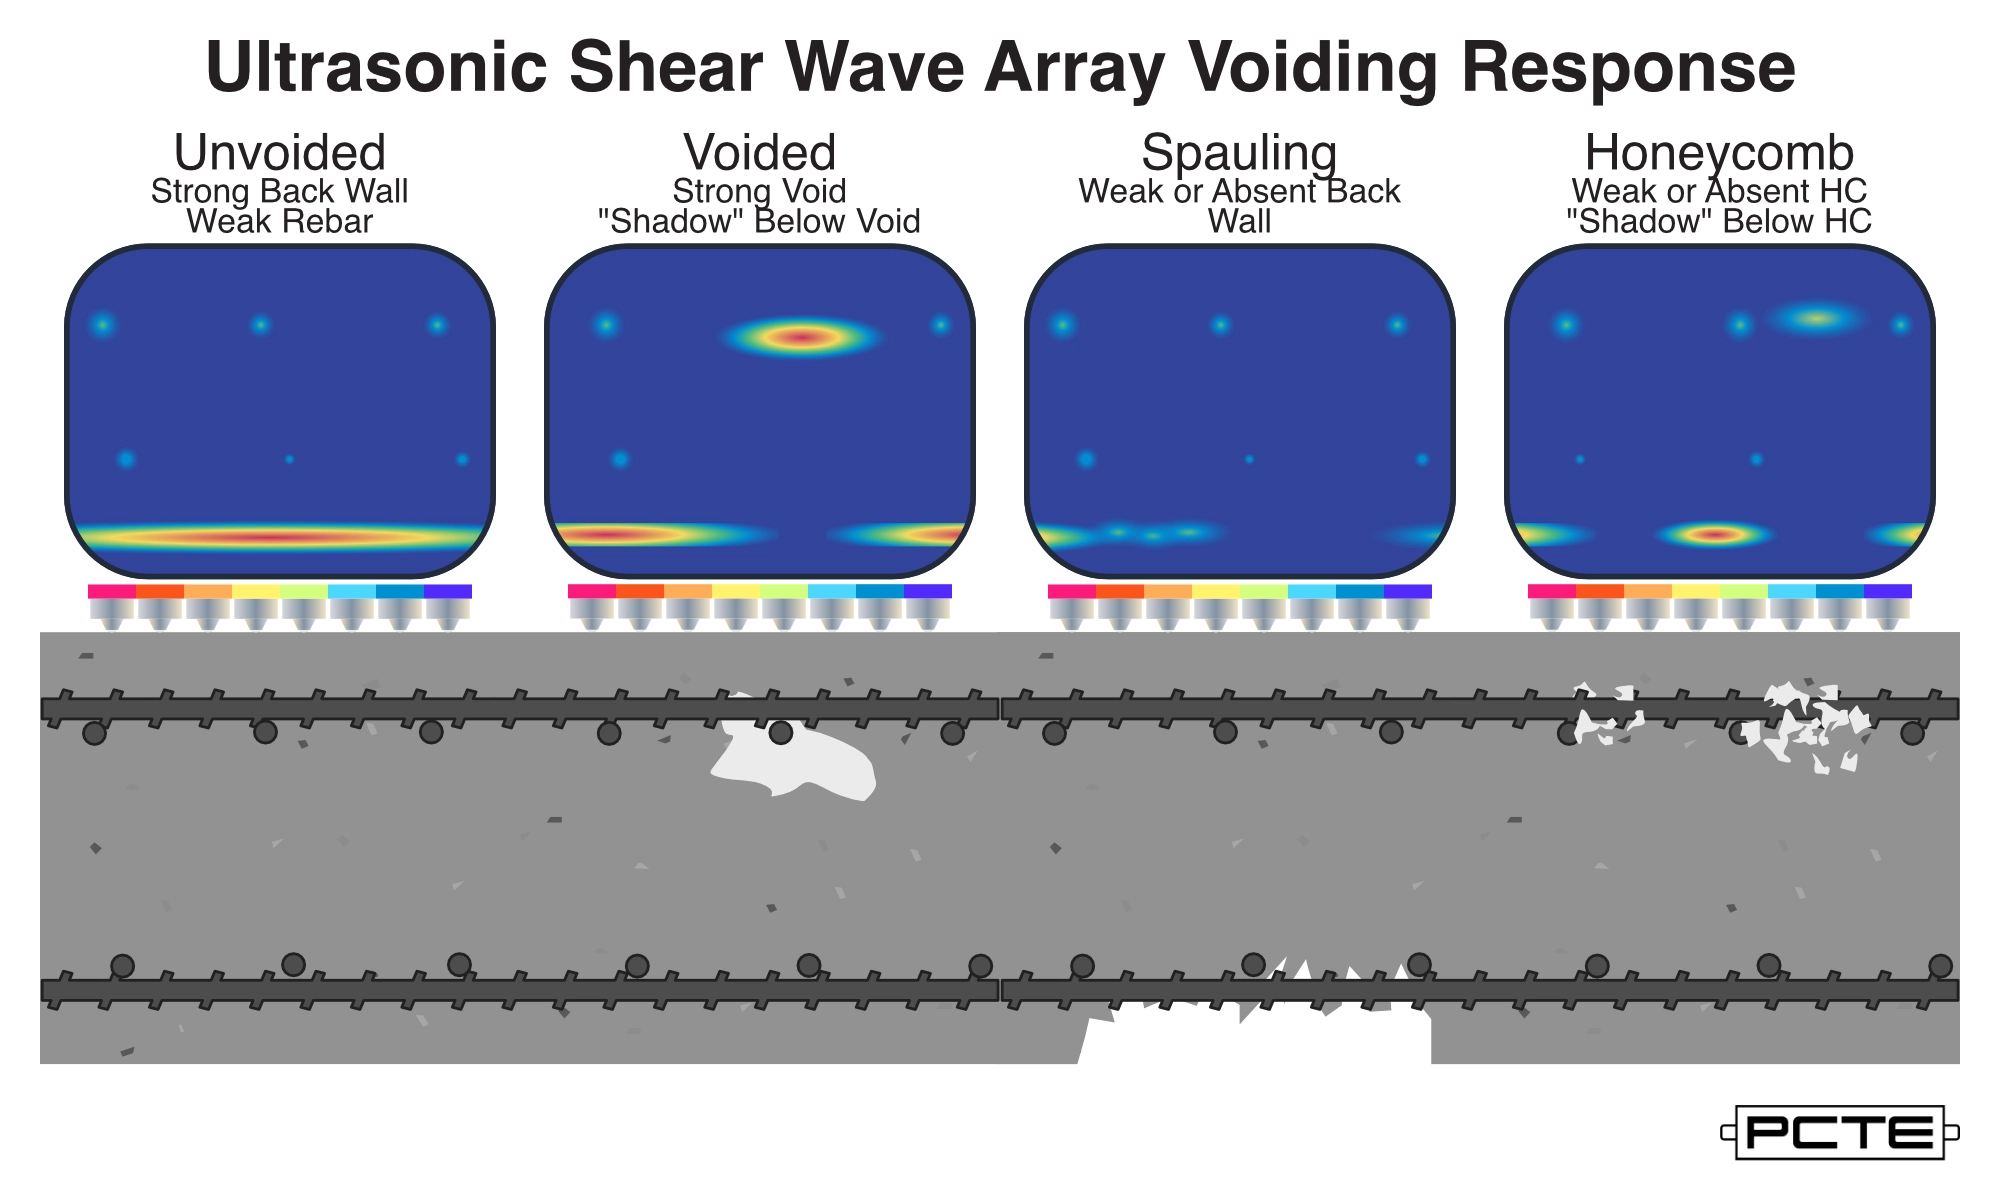
When concrete is un-voided UPE image data should show a clear reflection from the back side of the concrete element, which may be used to measure the concrete thickness. Tests may also show a weak response from the embedded rebar which may be used to locate rebar and measure approximate cover depth.
A clear UPE reflection of the back wall / back side in a concrete element is a vital pre-requisite for locating concrete voids. Many common defects may only provide a weak direct response but will also hide the thickness response from the test region.
Large voids will be detected by a strong signal response at their location, this response will block energy reaching the back wall producing a shadow effect where there is no signal response directly beneath the voiding response.
Delamination or spauling may show a weak signal response at the depth of the break, but it is common that the uneven surface produced will scatter energy reducing or eliminating any signal response in spauled regions. Typically no response at the break or for the concrete thickness.
Distributed voiding common when concrete consolidation is poor is often known as honeycomb voiding. These voids may provide a weak signal response or no direct response, but their presence will shadow the back wall of the concrete element.
Grouting defects in Post Tension Ducts and grout tubes may be detected by changes in the strength of the received signal and changes in its Phase, a property used in Signal Analysis processes.
Pundit Vision software may be used to post-process any UPE Array's data and to calculate phase response at the interface between the duct, back wall and any other detected targets.
The expected behaviour is that a response from a primarily metallic target such a fully grouted tendon in a duct will have roughly 180º difference in phase response to an air interface such as the reverse face of the element or a grouting defect.
In the phase colour wheels produced by Pundit Vision this can be seen as directly opposite phase response for each location.
Where defects exist their response will be stronger than an un-voided duct, with a phase response close to the response of an air interface.

As with any NDT post-processing it is important to review the real response from a testing region, comparing to the theoretical response and completing physical testing to expose random areas and expected defects for confirmation.
A full case study of this process is available in this video.
%20vector%20logo.svg)


