%20vector%20logo.svg)


Phone: 02 9453 9999 or Email: sales-operations@pcte.com.au

Consolidated power in a single device for structural imaging, object and defect detection with ultrasound pulse echo Real-time imaging, weight optimisation and AI assistance Large scale 2D, 3D, heat map and AR visualisation modes Superior image clarity with control of all transmission parameters
Overview | GX1 vs GX2 | SUE & Utilities | Structures & Pavements | Software & Outputs | Case Studies | Specifications | Support
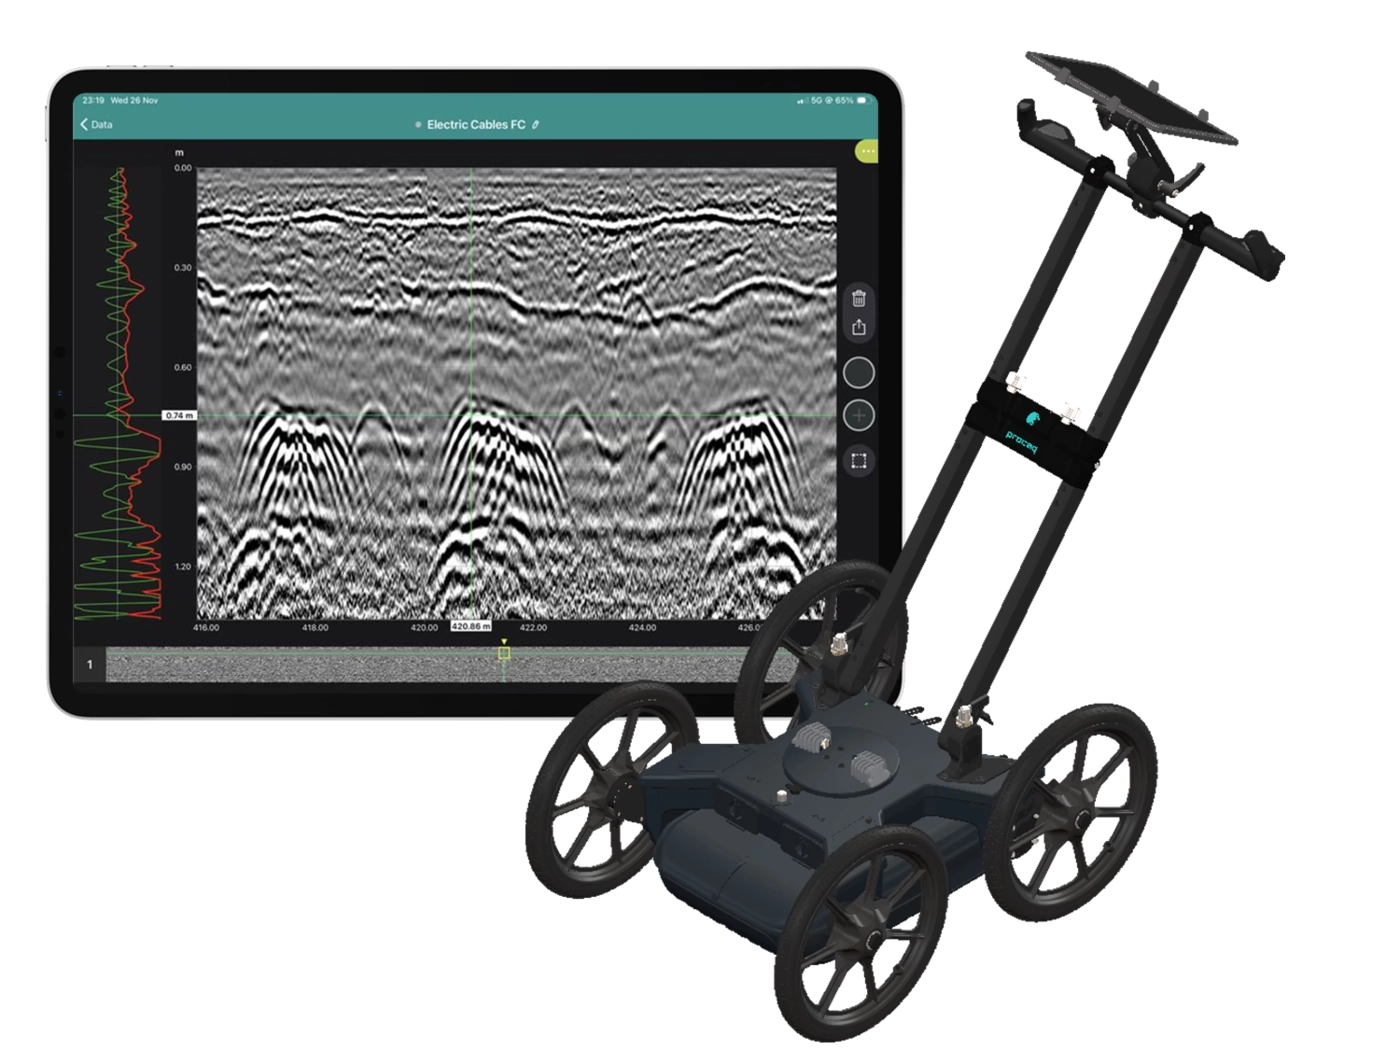
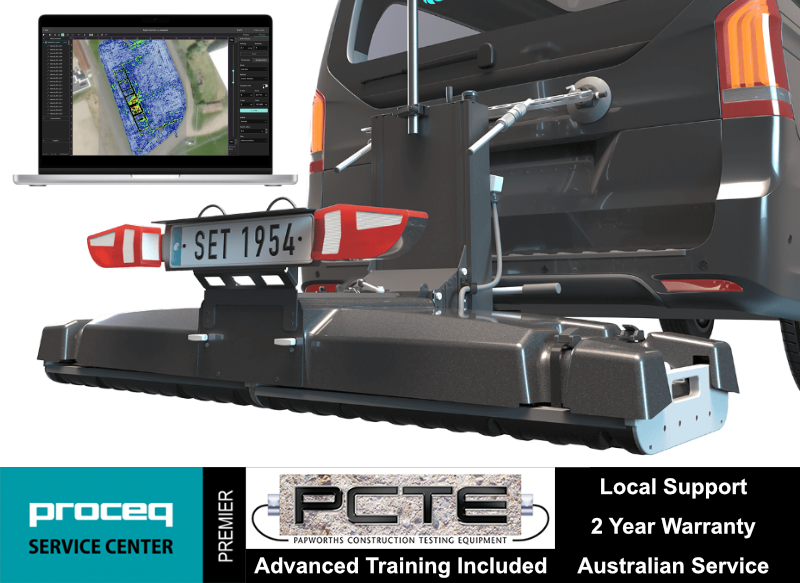
Collect high-density, georeferenced GPR data across wide areas and view the subsurface in 3D as you scan. Choose the GX2 array for SUE and utility mapping, or the GX1 array for structural, bridge and pavement investigations.
Best suited to:
Best suited to:
Recommended array: GX2
Recommended array: GX1
Cover more ground
Collect multiple parallel profiles in one pass instead of uilding a grid line by line.
See results during acquisition
View georeferenced radargrams and time-slice information in the field rather than waiting until the data is returned to the office.
Produce repeatable mapped data
Combine wheel-positioned GPR data with GNSS, project coordinates and survey linework.
Use one platform for two very different applications
Exchange GX1 and GX2 arrays without purchasing two complete cart platforms.
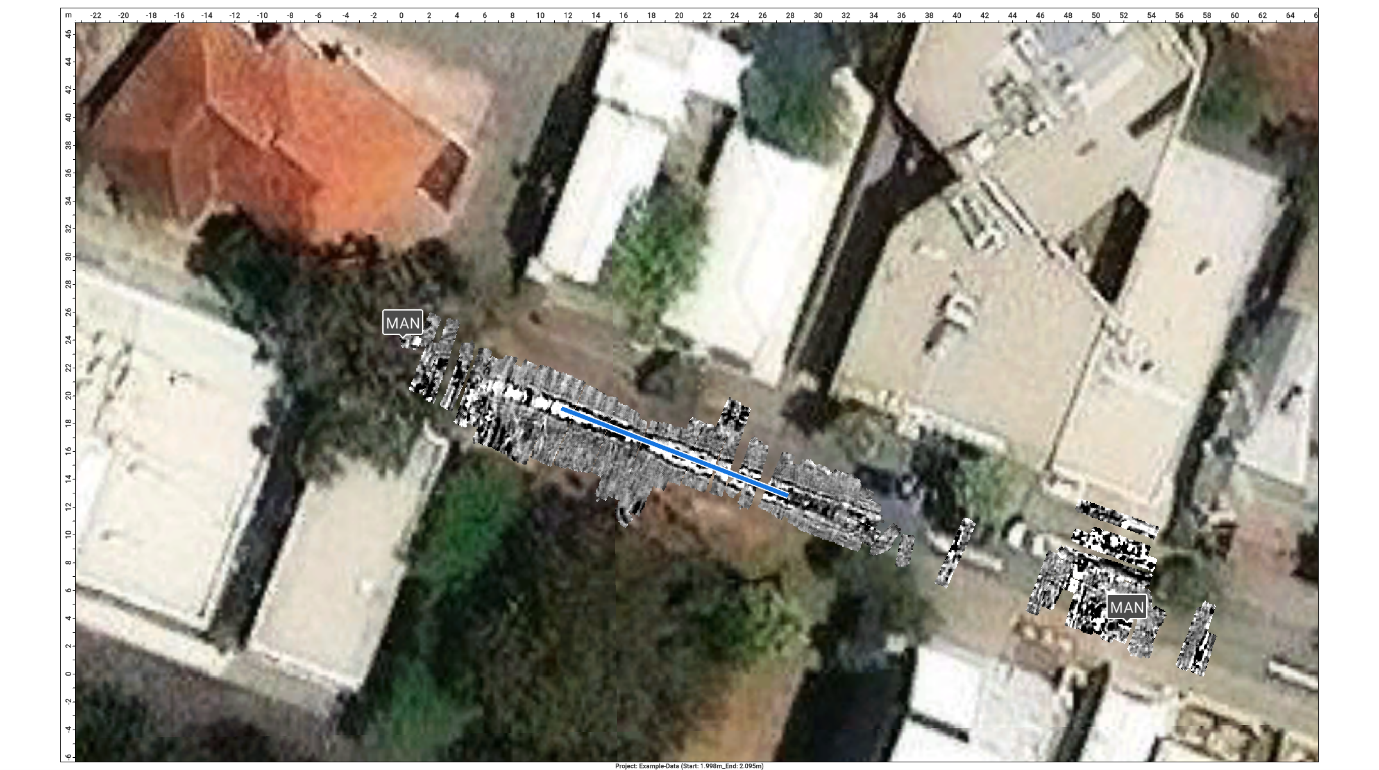
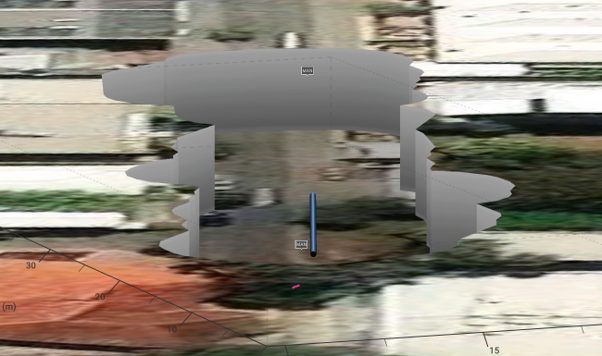
The GX2 transforms the GS9000 into a high-density subsurface utility mapping system. Its 11-channel, low-frequency GPR array captures an 83 cm-wide swath in each pass, helping operators detect and map buried pipes, ducts, cables, voids and other subsurface features. Live georeferenced data lets SUE teams review coverage on site and produce accurate CAD, GIS and project-coordinate deliverables.
1. Plan the survey
Load satellite imagery, CAD information, project coordinates or survey control.
2. Collect dense multichannel data
Survey an approximately 0.82 m-wide swath with 11 channels in each pass.
3. Review data live
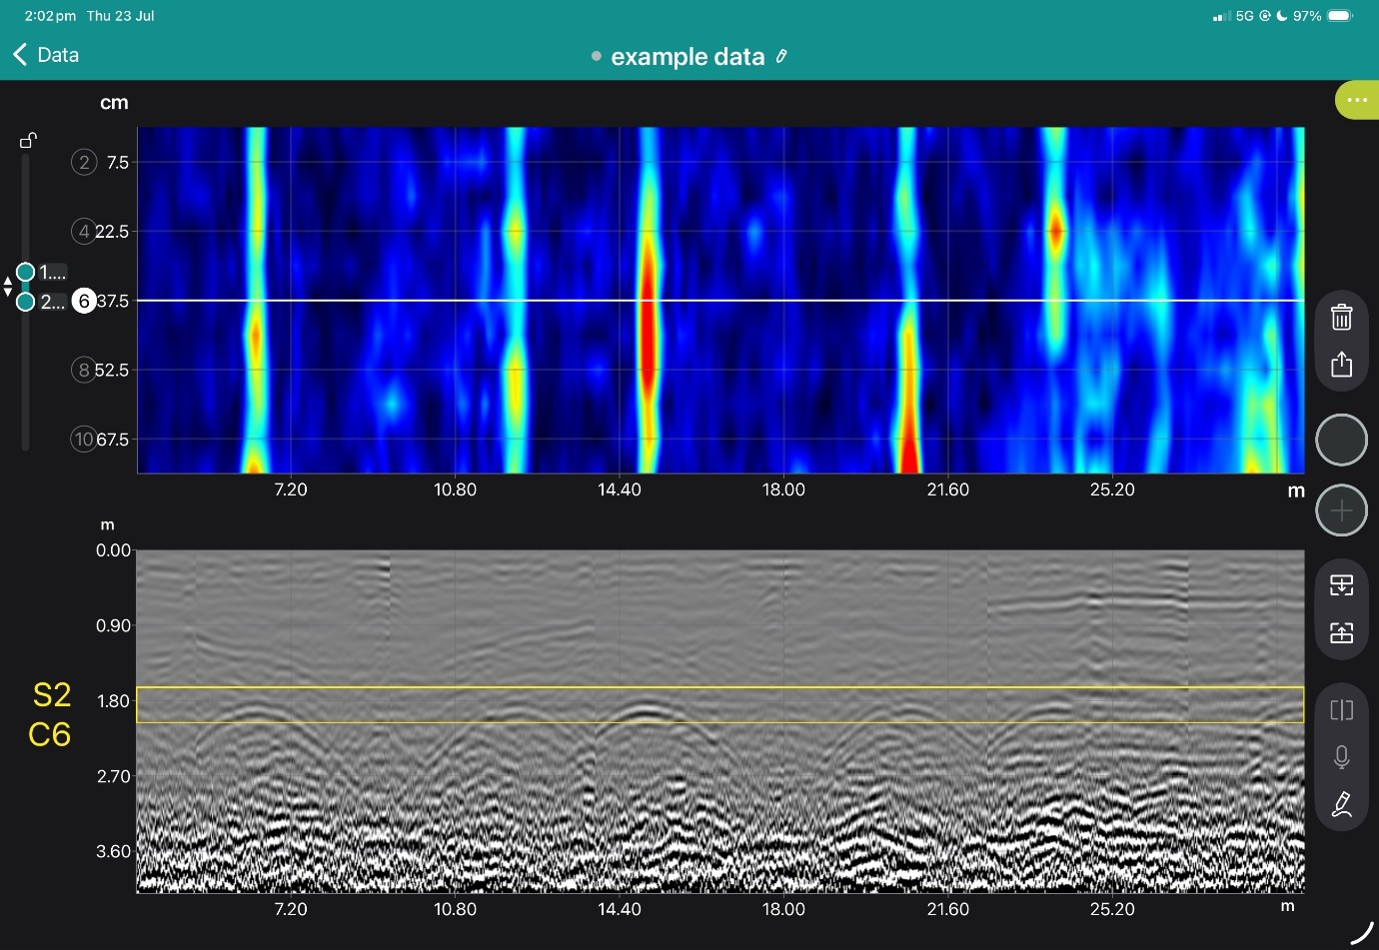
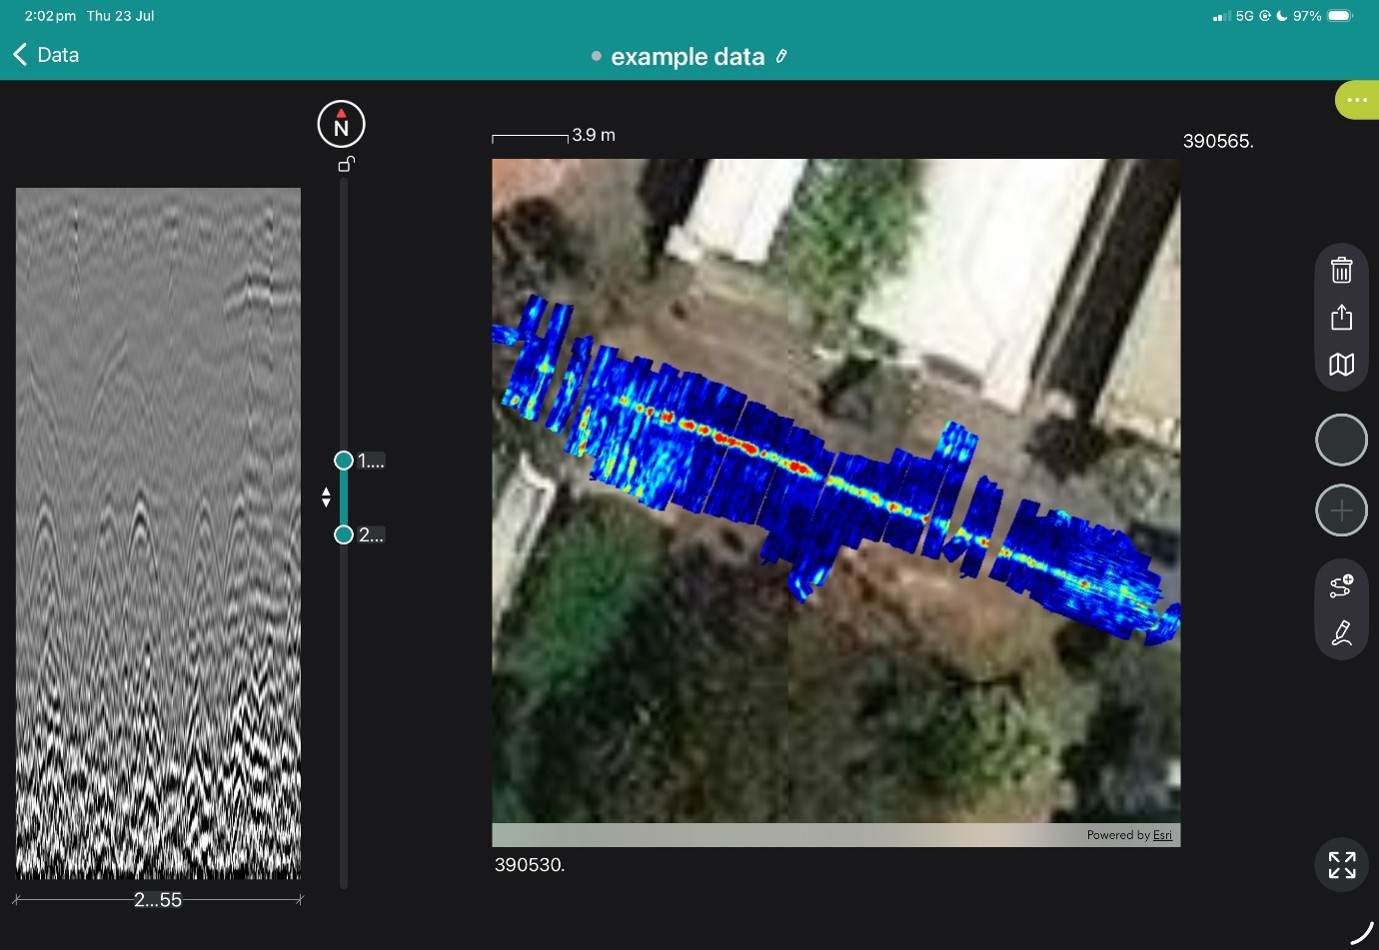
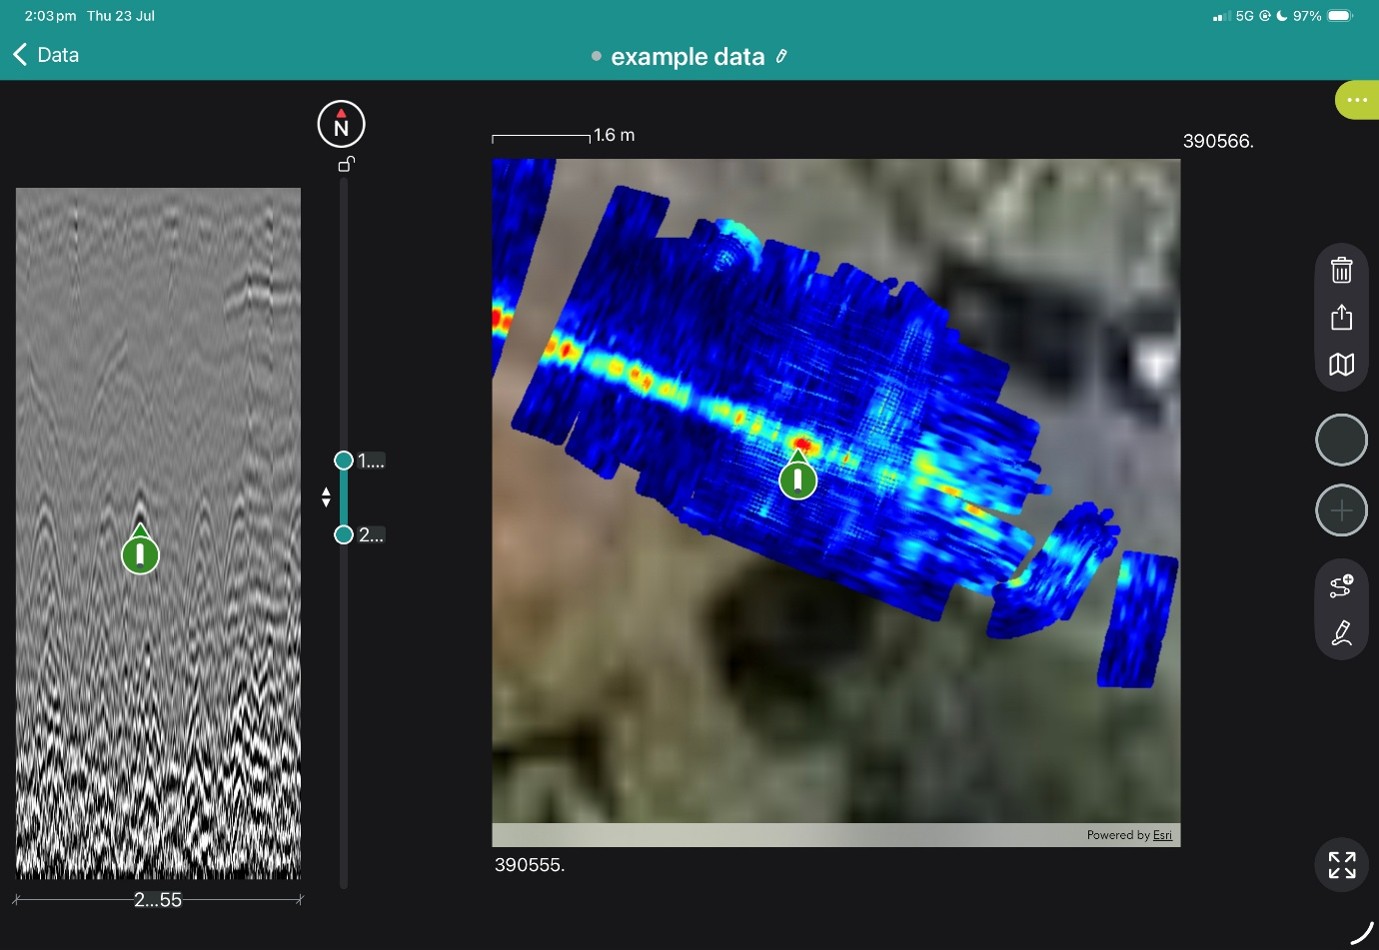
Examine radargrams, georeferenced time slices and marked features while still on site.
4. Interpret and digitise
Add points, linework, tags, photographs and field observations.
5. Process and deliver
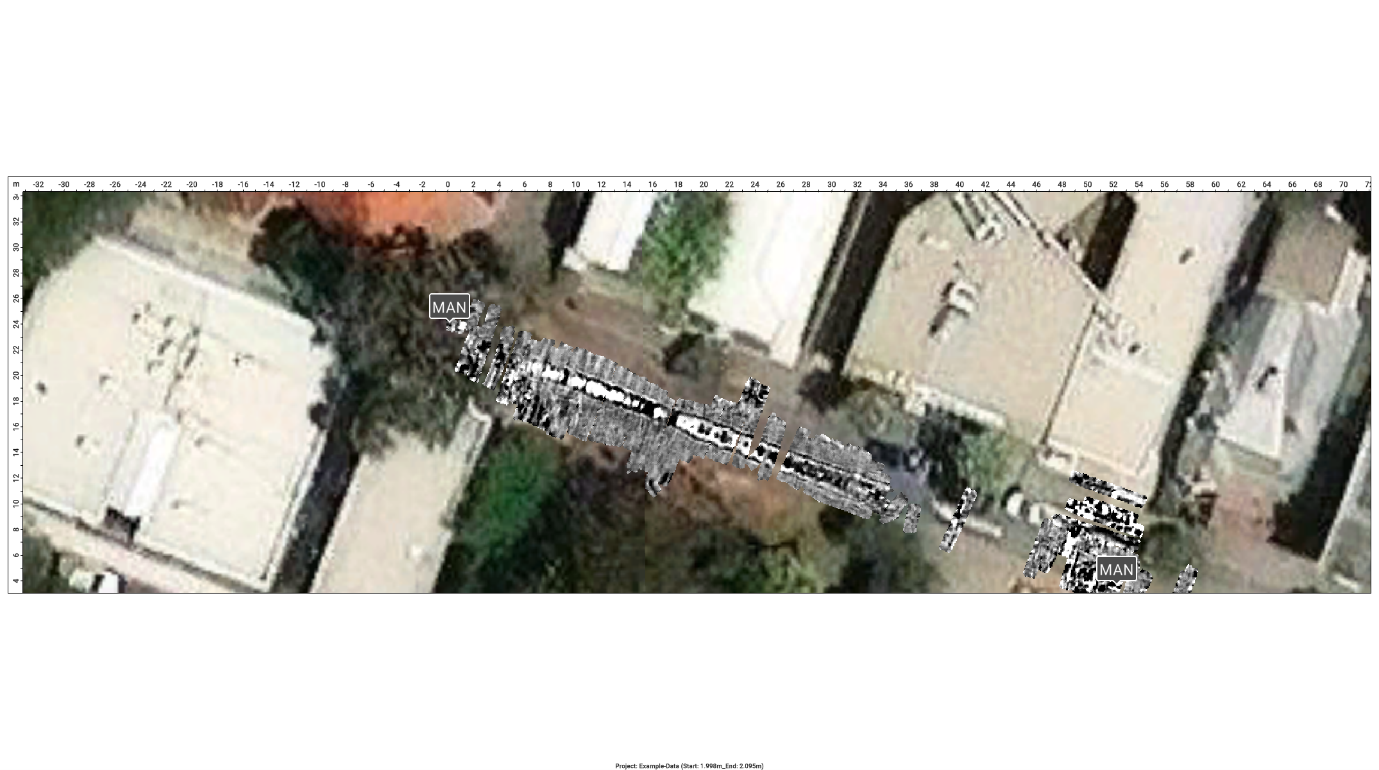
Merge survey areas, apply processing and export mapped information for the customer’s CAD, GIS or reporting workflow.
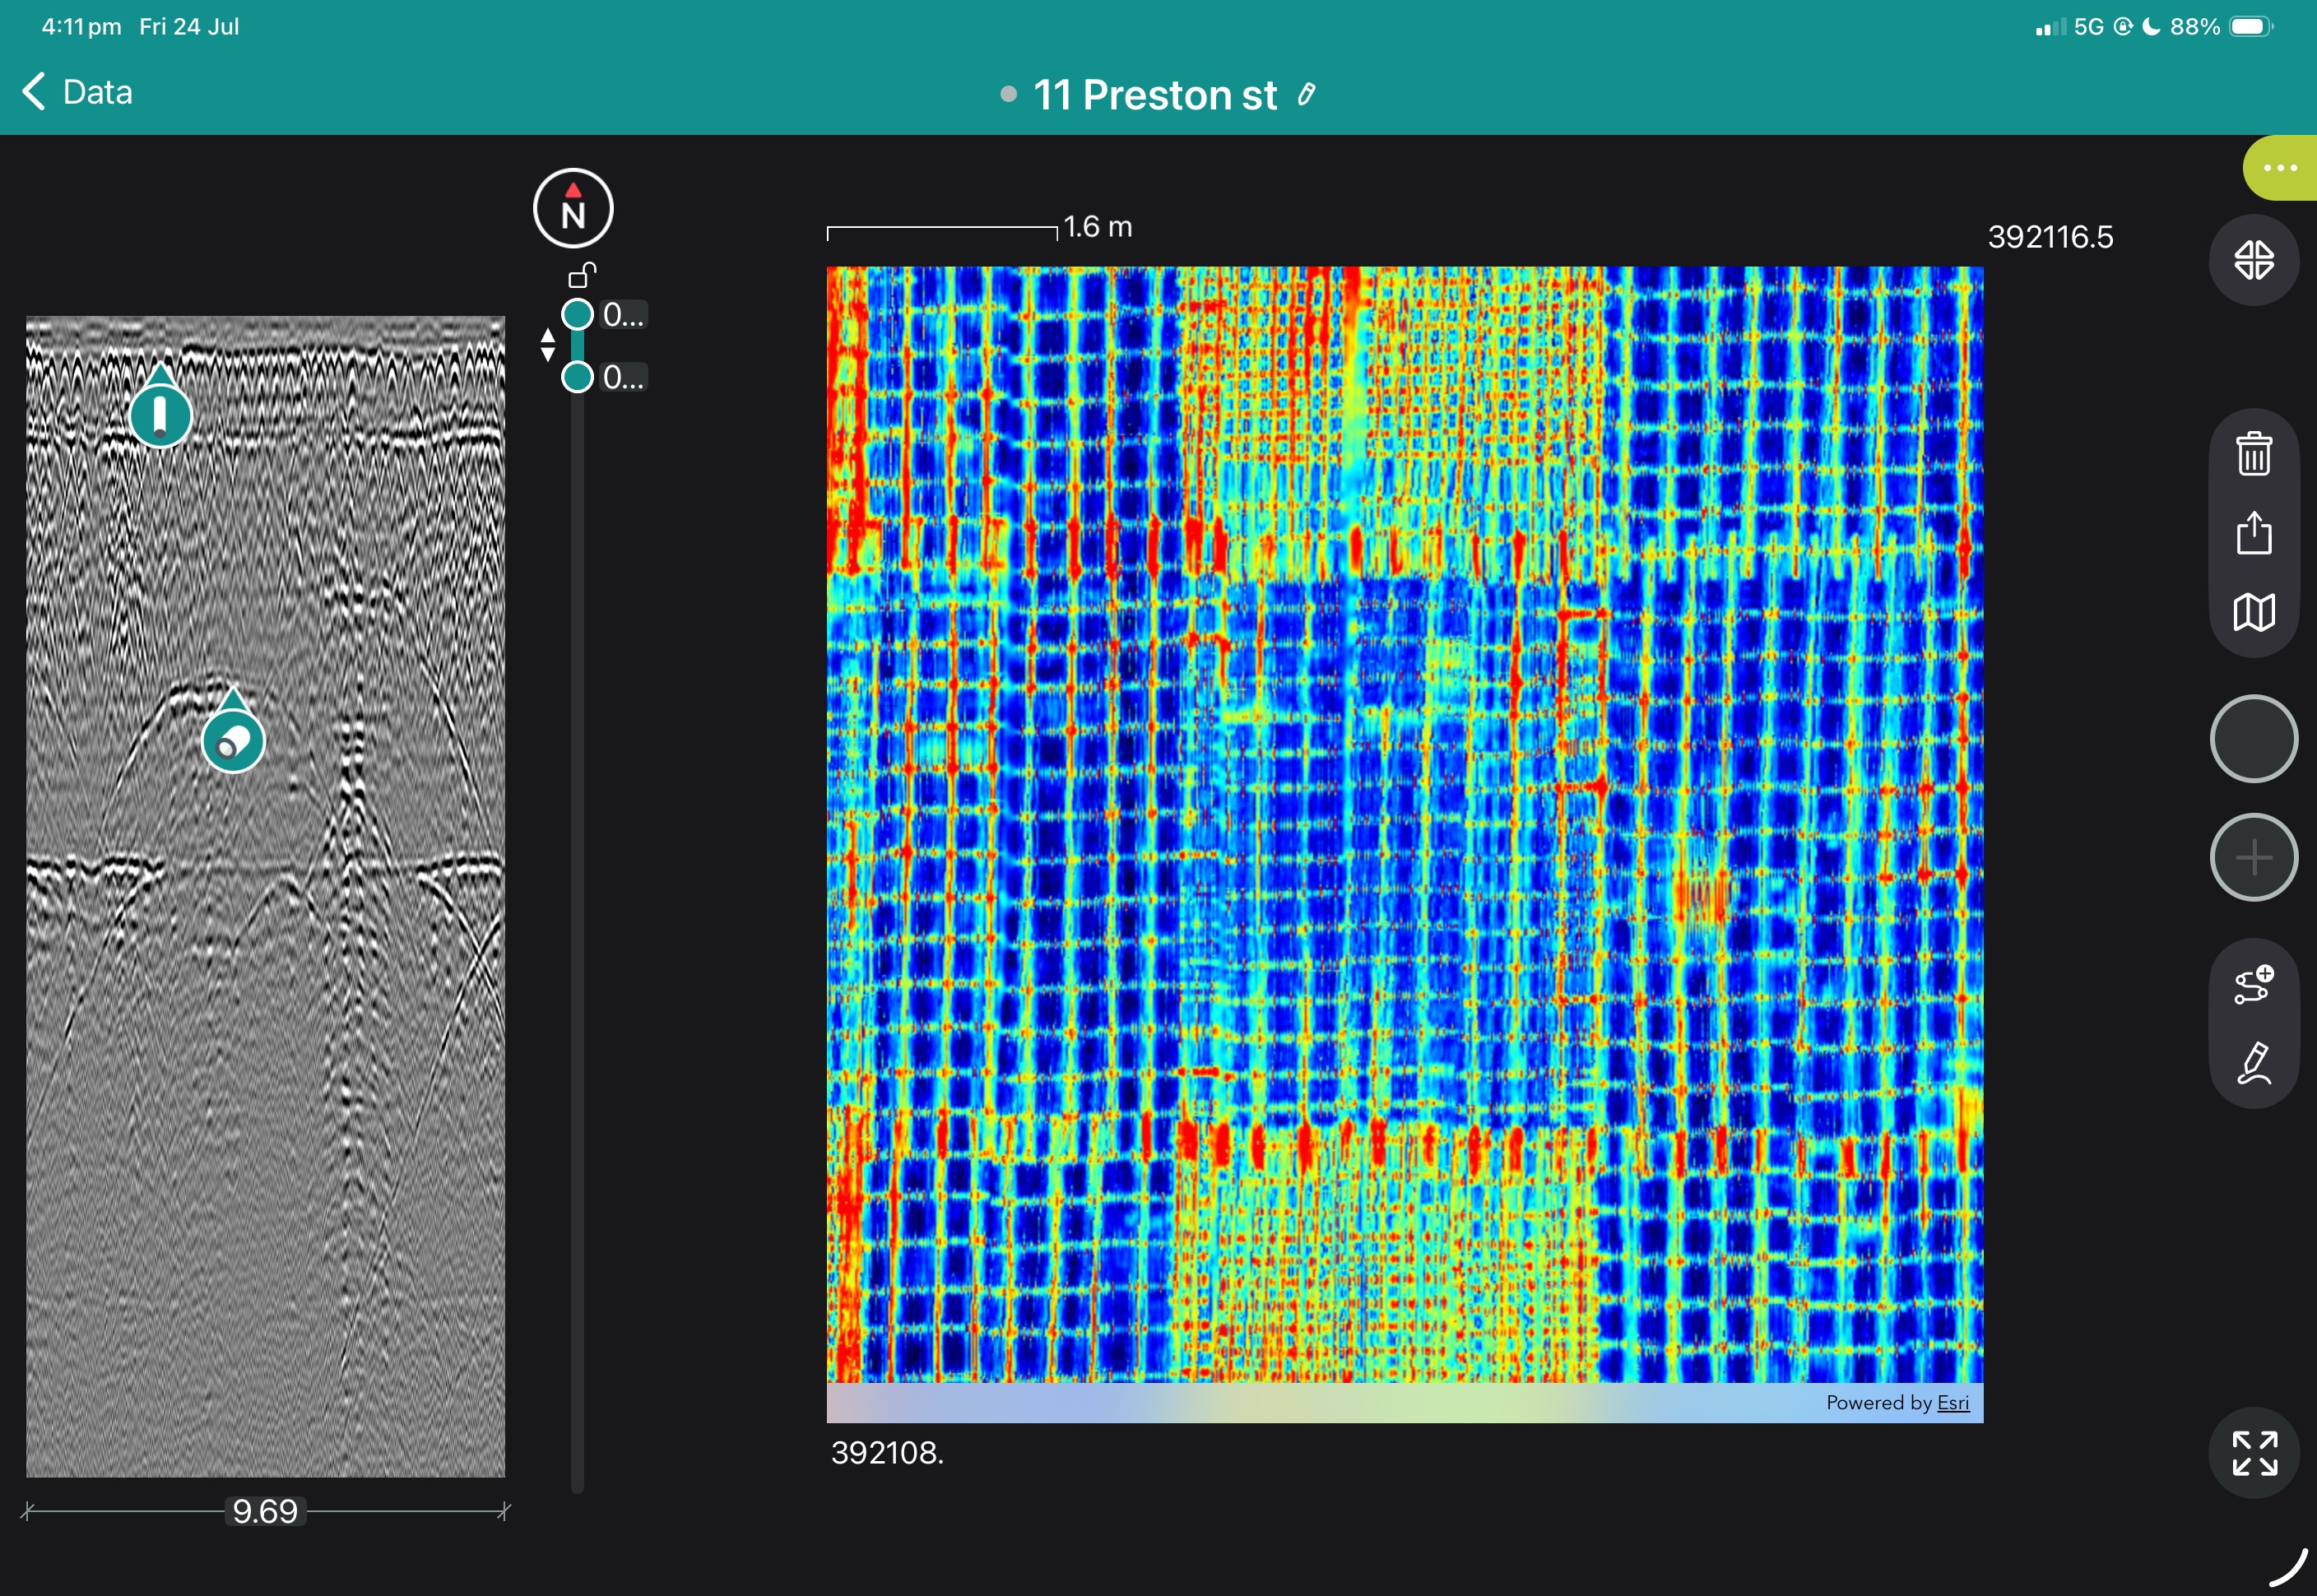
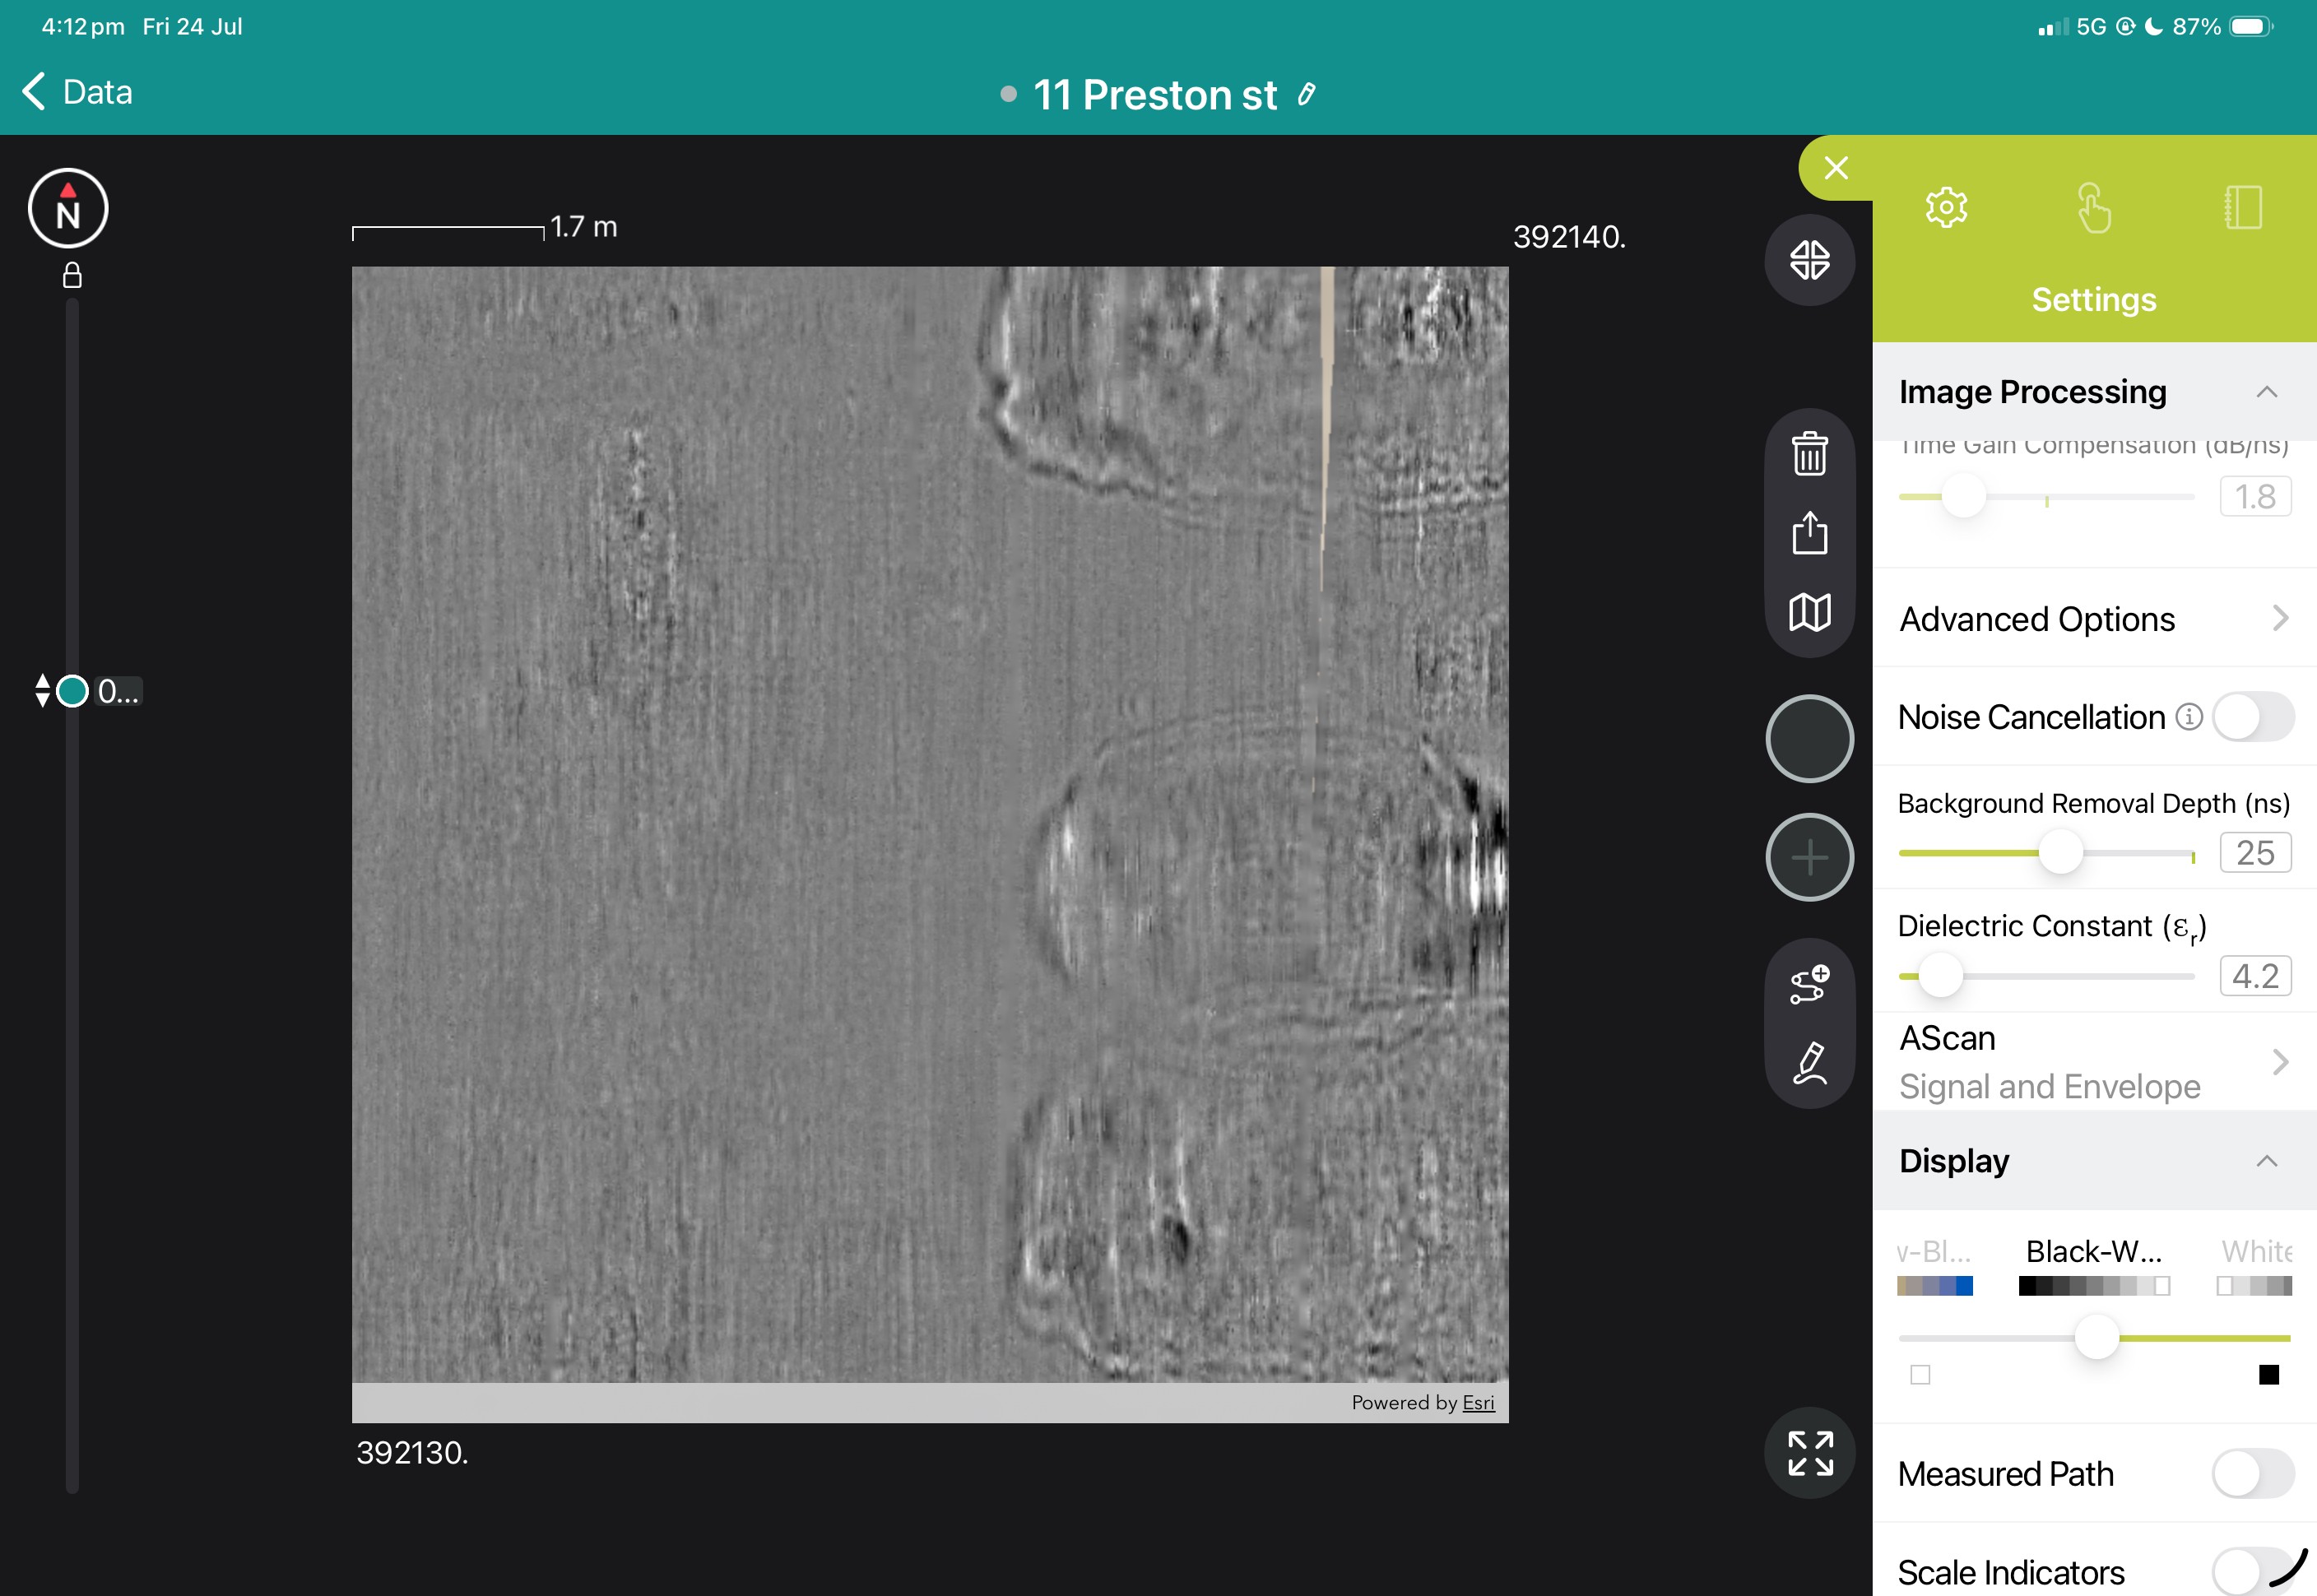
View the images below to see these in action.

It is a uniquely visual sonic test for use with concrete. It uses an array of Ultrasonic Transducers (24) to create images using tomography. It is the ideal test for applications where the user is looking to create highly intuitive images of the internal structure of the concrete.
Being an ultrasonic technique is highly sensitive to air voids (i.e. cracks, voids, honeycombing), whilst still providing images of metallic items in a lot of circumstances. It also has the capability of getting responses from voids within plastic or steel shielded regions of the concrete (ie PT ducts, sleeves and conduits).
An update of the PD8000 the Proceq Pundit PD8050 improves upon existing instruments by offering an expandable array with unique AI features, market-leading ease of use with 2D and 3D data collection and imaging all right in the fifth generation of Pundit Live iOS app. Penetration can reach as much as 2 m depth or more. Furthermore the software now includes modes to measure Shear Wave Ultrasonic Pulse Velocity and to convert to Compression Wave values.
With the PD8050 the user has access to real-time tomographic imaging, the fastest data collection of any array, with smart AI functions to recognise and assist user interpretation.
Video
Accurate stitching thanks to latest A.I. supported pattern recognition technologies
Fix the Proceq Live tape measure to the object you need to inspect. Scan wherever you want along the tape and get a perfectly stitched scan! Even if you realise you didn’t scan a spot, (shown as blank in the stitched scan) just go back and scan at that location and it will be placed correctly into the stitched scan.
The Proceq smart positioning system uses a sensitive, fast CMOS imaging sensor and pattern recognition technologies to detect the position in real-time.
This features saves a lot of time as other systems required marked grids. This can double the data collection time.
An "HD Focus" is especially useful on the first layer or second layer rebars, supporting a more precise horizontal positioning. The focus depth could be adjusted from 0 to 50 cm. Appropriate for very congested rebars with large diameters at a shallow surface level, offering a better view compared even to a GPR scan.
The operator can select between a shallow, intermediate or deep depth view. Their choice adjusts the energy emitted by the PD8050 and the frequency bandwidth used to create the image. Practically it makes it easier for a skilled operator to bring their targets into clear view on the PD8050's scan images.
Digital reporting, data sharing and back-up are possible directly from the Pundit Live app on iOS. The unique Logbook feature records the key parameters associated with each and every test including settings, time stamps, photos, site notes and geo-location.
Reports can be sent directly from the iPad on-site and all measurements are accessible through Proceq's web platform all over the world
The Pundit live array will detect the back wall reflection within a scan, marking it with a back wall tag indicated in the image with a circles and lines background. They may be used to determine the boundaries of meaningful information for interpretation by an operator.
Operators can add additional tags and adjust the position of the AI tags if required.
With the 8 channel PD8050 measurement head, one channel transmits the ultrasonic signal and the echoes are received by the other seven channels. Each channel transmits in turn. A complete measurement consists of 28 A-scans.
These are used to compute and display a B-scan in real-time using the Synthetic Aperture Focusing Technique (SAFT). Coupling two transducers result in a 16 channel aperture processing a total of 240 A-scans per measurement cycle. Stripe scans modes allow for depth-slice / C scan images and 3D reproduction.
The Pundit live array supports data export from all measurement modes. Raw data is provided in a .csv format and is suitable for use in third party 3D or data analysis software for research or imaging during projects.
Scanning and Operation
The PD8050's iOS App allows immediate imaging of UPE data. This image can be shown in a conventional B Scan or C Scan format, or processed into a full 3D iso-surface representation onsite.
The operator places the AI positioning tape perpendicular to the PD8000 array and then moves it forward in a strip, collecting 3D data in the area underneath the array's motion. It may be shown as a Time-slice/Depth-Slice view, or as a 3D iso-surface.
The operator places the AI positioning tape parallel to the PD8000 array, moving it sideways along the structure producing one long Line Scan. The data may only be shown as a Line scan view.
Line scan view is available with Line Scan or Stripe Scan data, when stripe scan data is collected any of the individual measurements in the stripe may be reviewed. In this view manual and AI tags may be used to mark features and back walls.
Exports will include the image of the view as shown on the iPad display, and a .csv / Excel file with a list and details of the tags placed on the scan. The image above has been trimmed for space below 0.45 m depth, it shows a V-shaped back wall test block with honeycomb concrete visible in the tag 20 positions.
Depth-slice view
Depth-slice view shows a cross-section slice parallel to the surface scanned. The operator may choose the depth range included in each slice. The image above highlights depth-slices whose depth range are level with an embedded conduit, a shallow back wall and a deeper back wall of a sample block.
3D Iso-surface View
3D iso-surface view allows the operator to present a 3D visualisation of the internal features and back wall reflections of the structure. They may adjust the maximum and minimum depths presented, along with the intensity of the signal presented in the 3D view.
Augmented Reality view
Augmented reality views allow the operator to overlay their scans on the real world, either as a 3d iso-surface or as a Depth-slice.
The Pundit Live app will record its geo-location during measurements and all the metadata relating to the array in use and the settings of the scan. The operator may add to this written or audio notes & images relating to the scan. Any later adjustments to scan settings are also recorded. Each scan file has its own dedicated record.
Technical Specifications
Book a SUE Workflow Demonstration
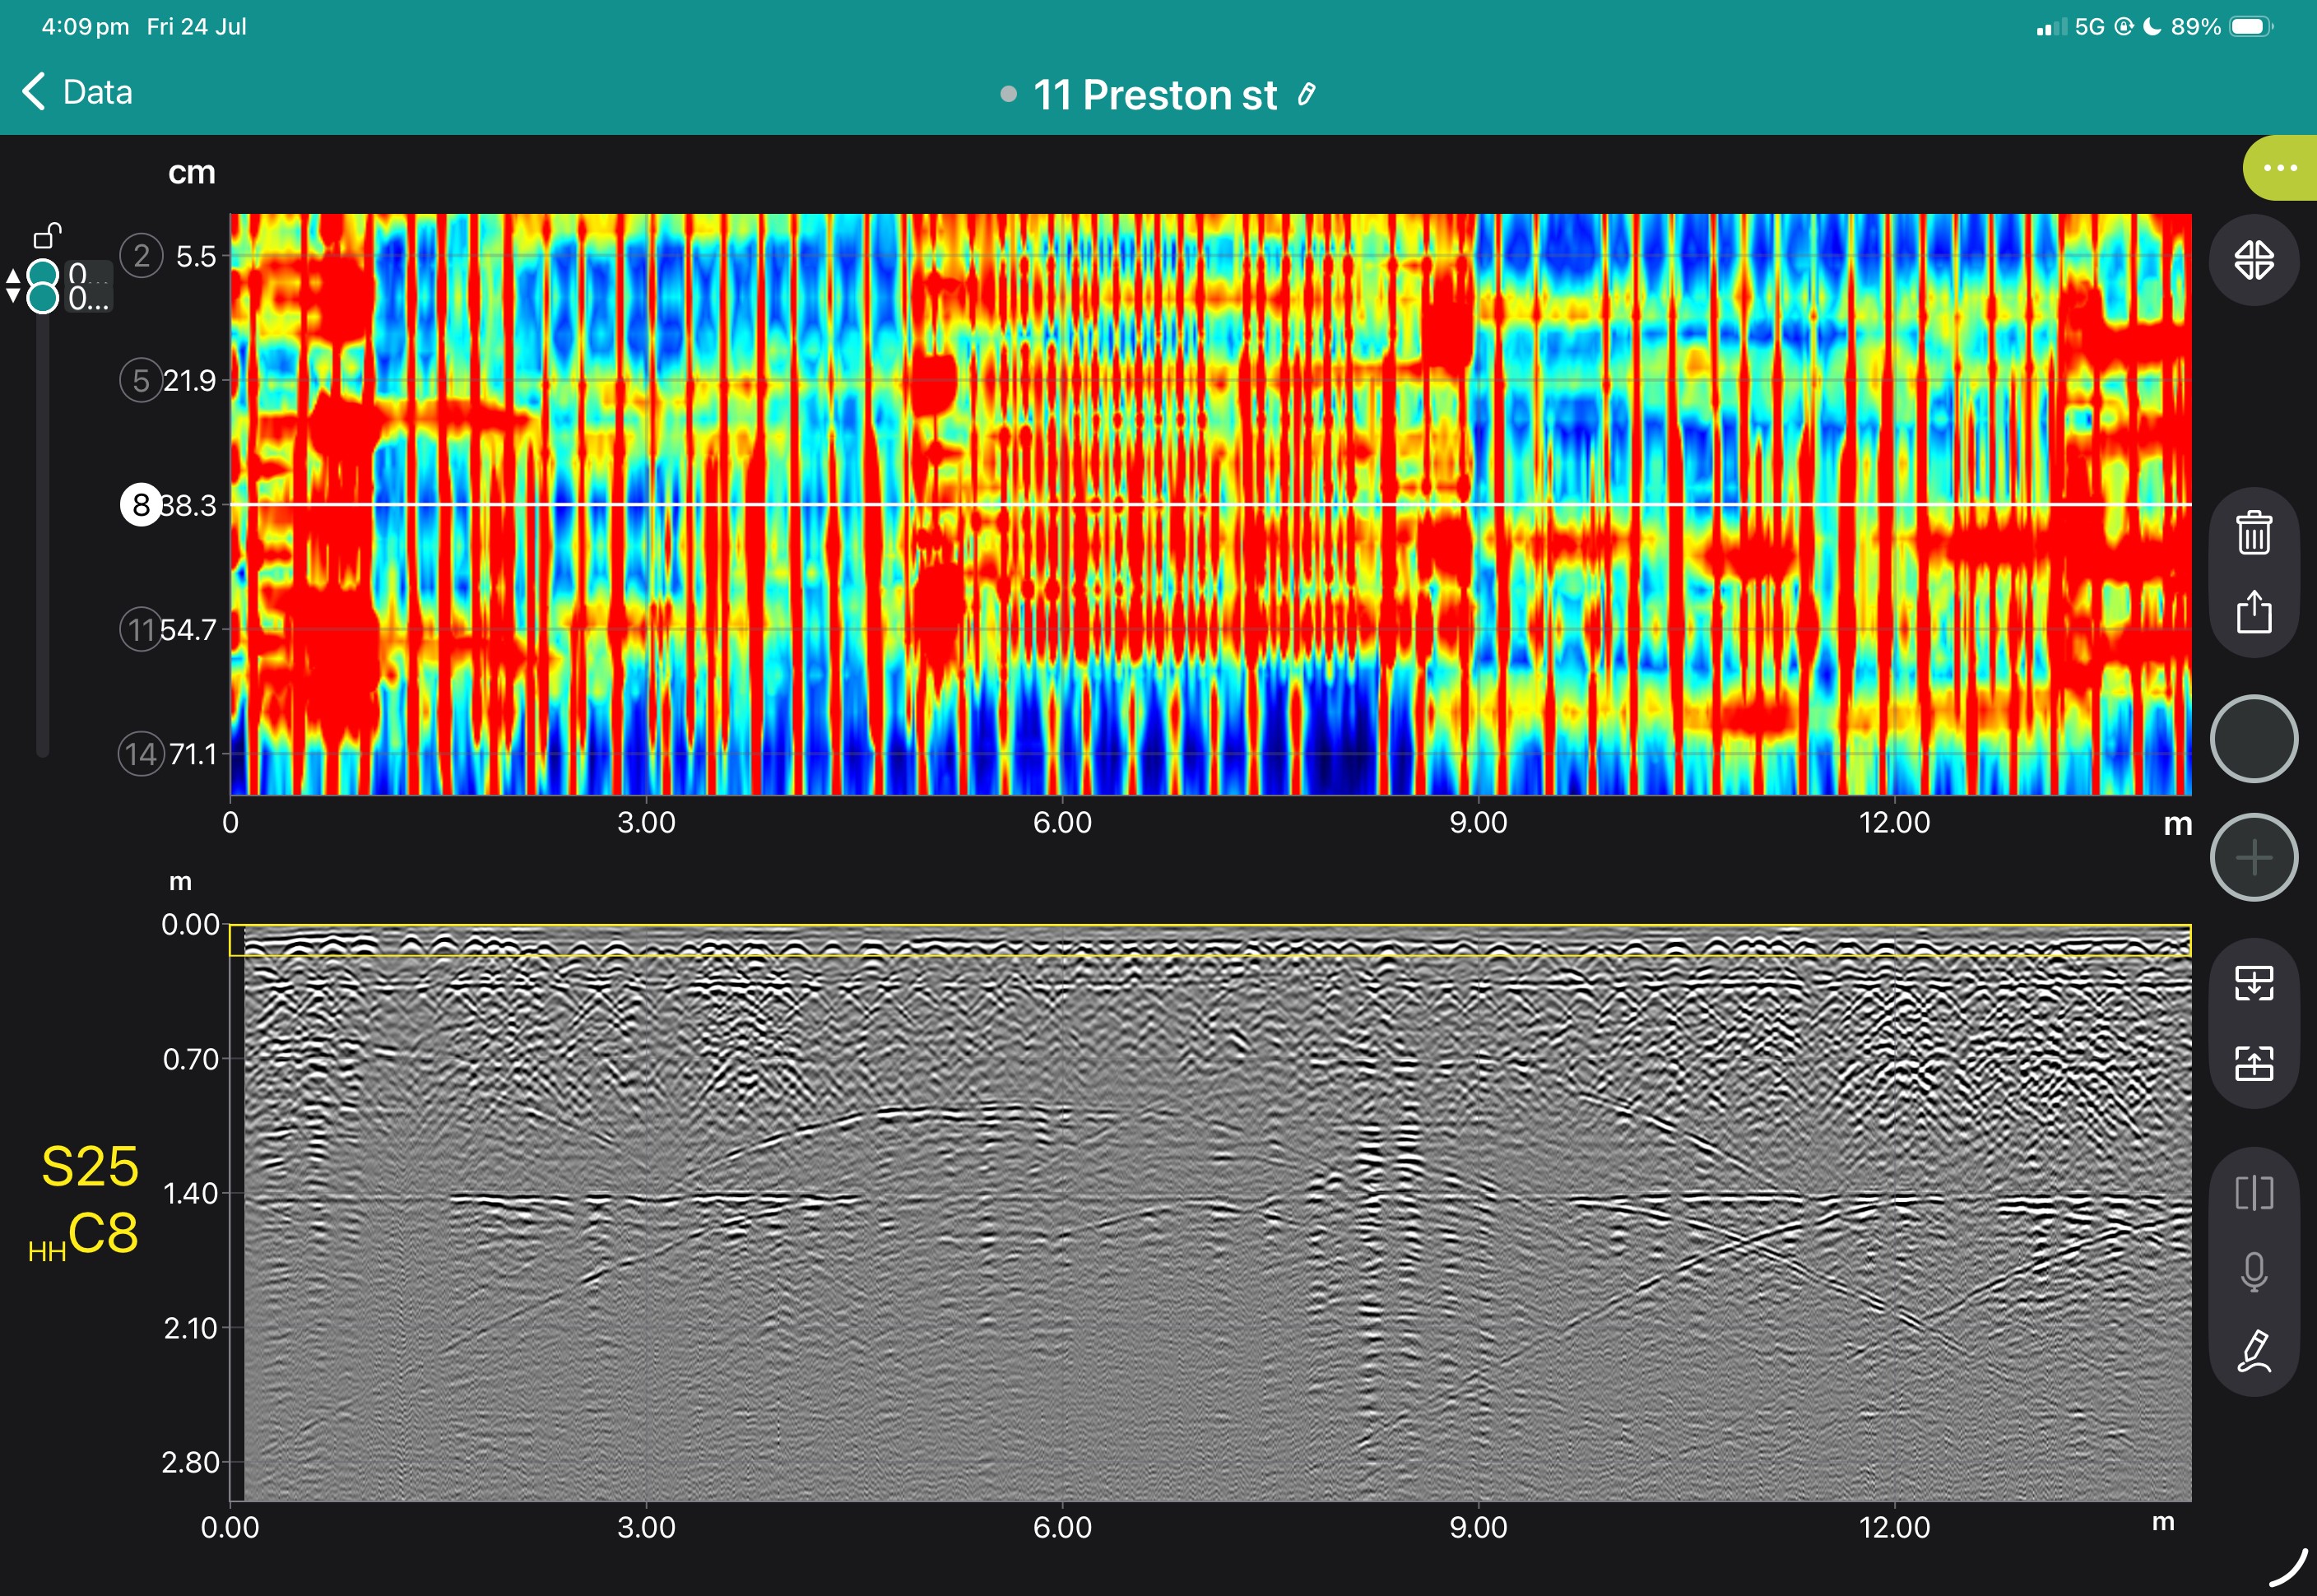
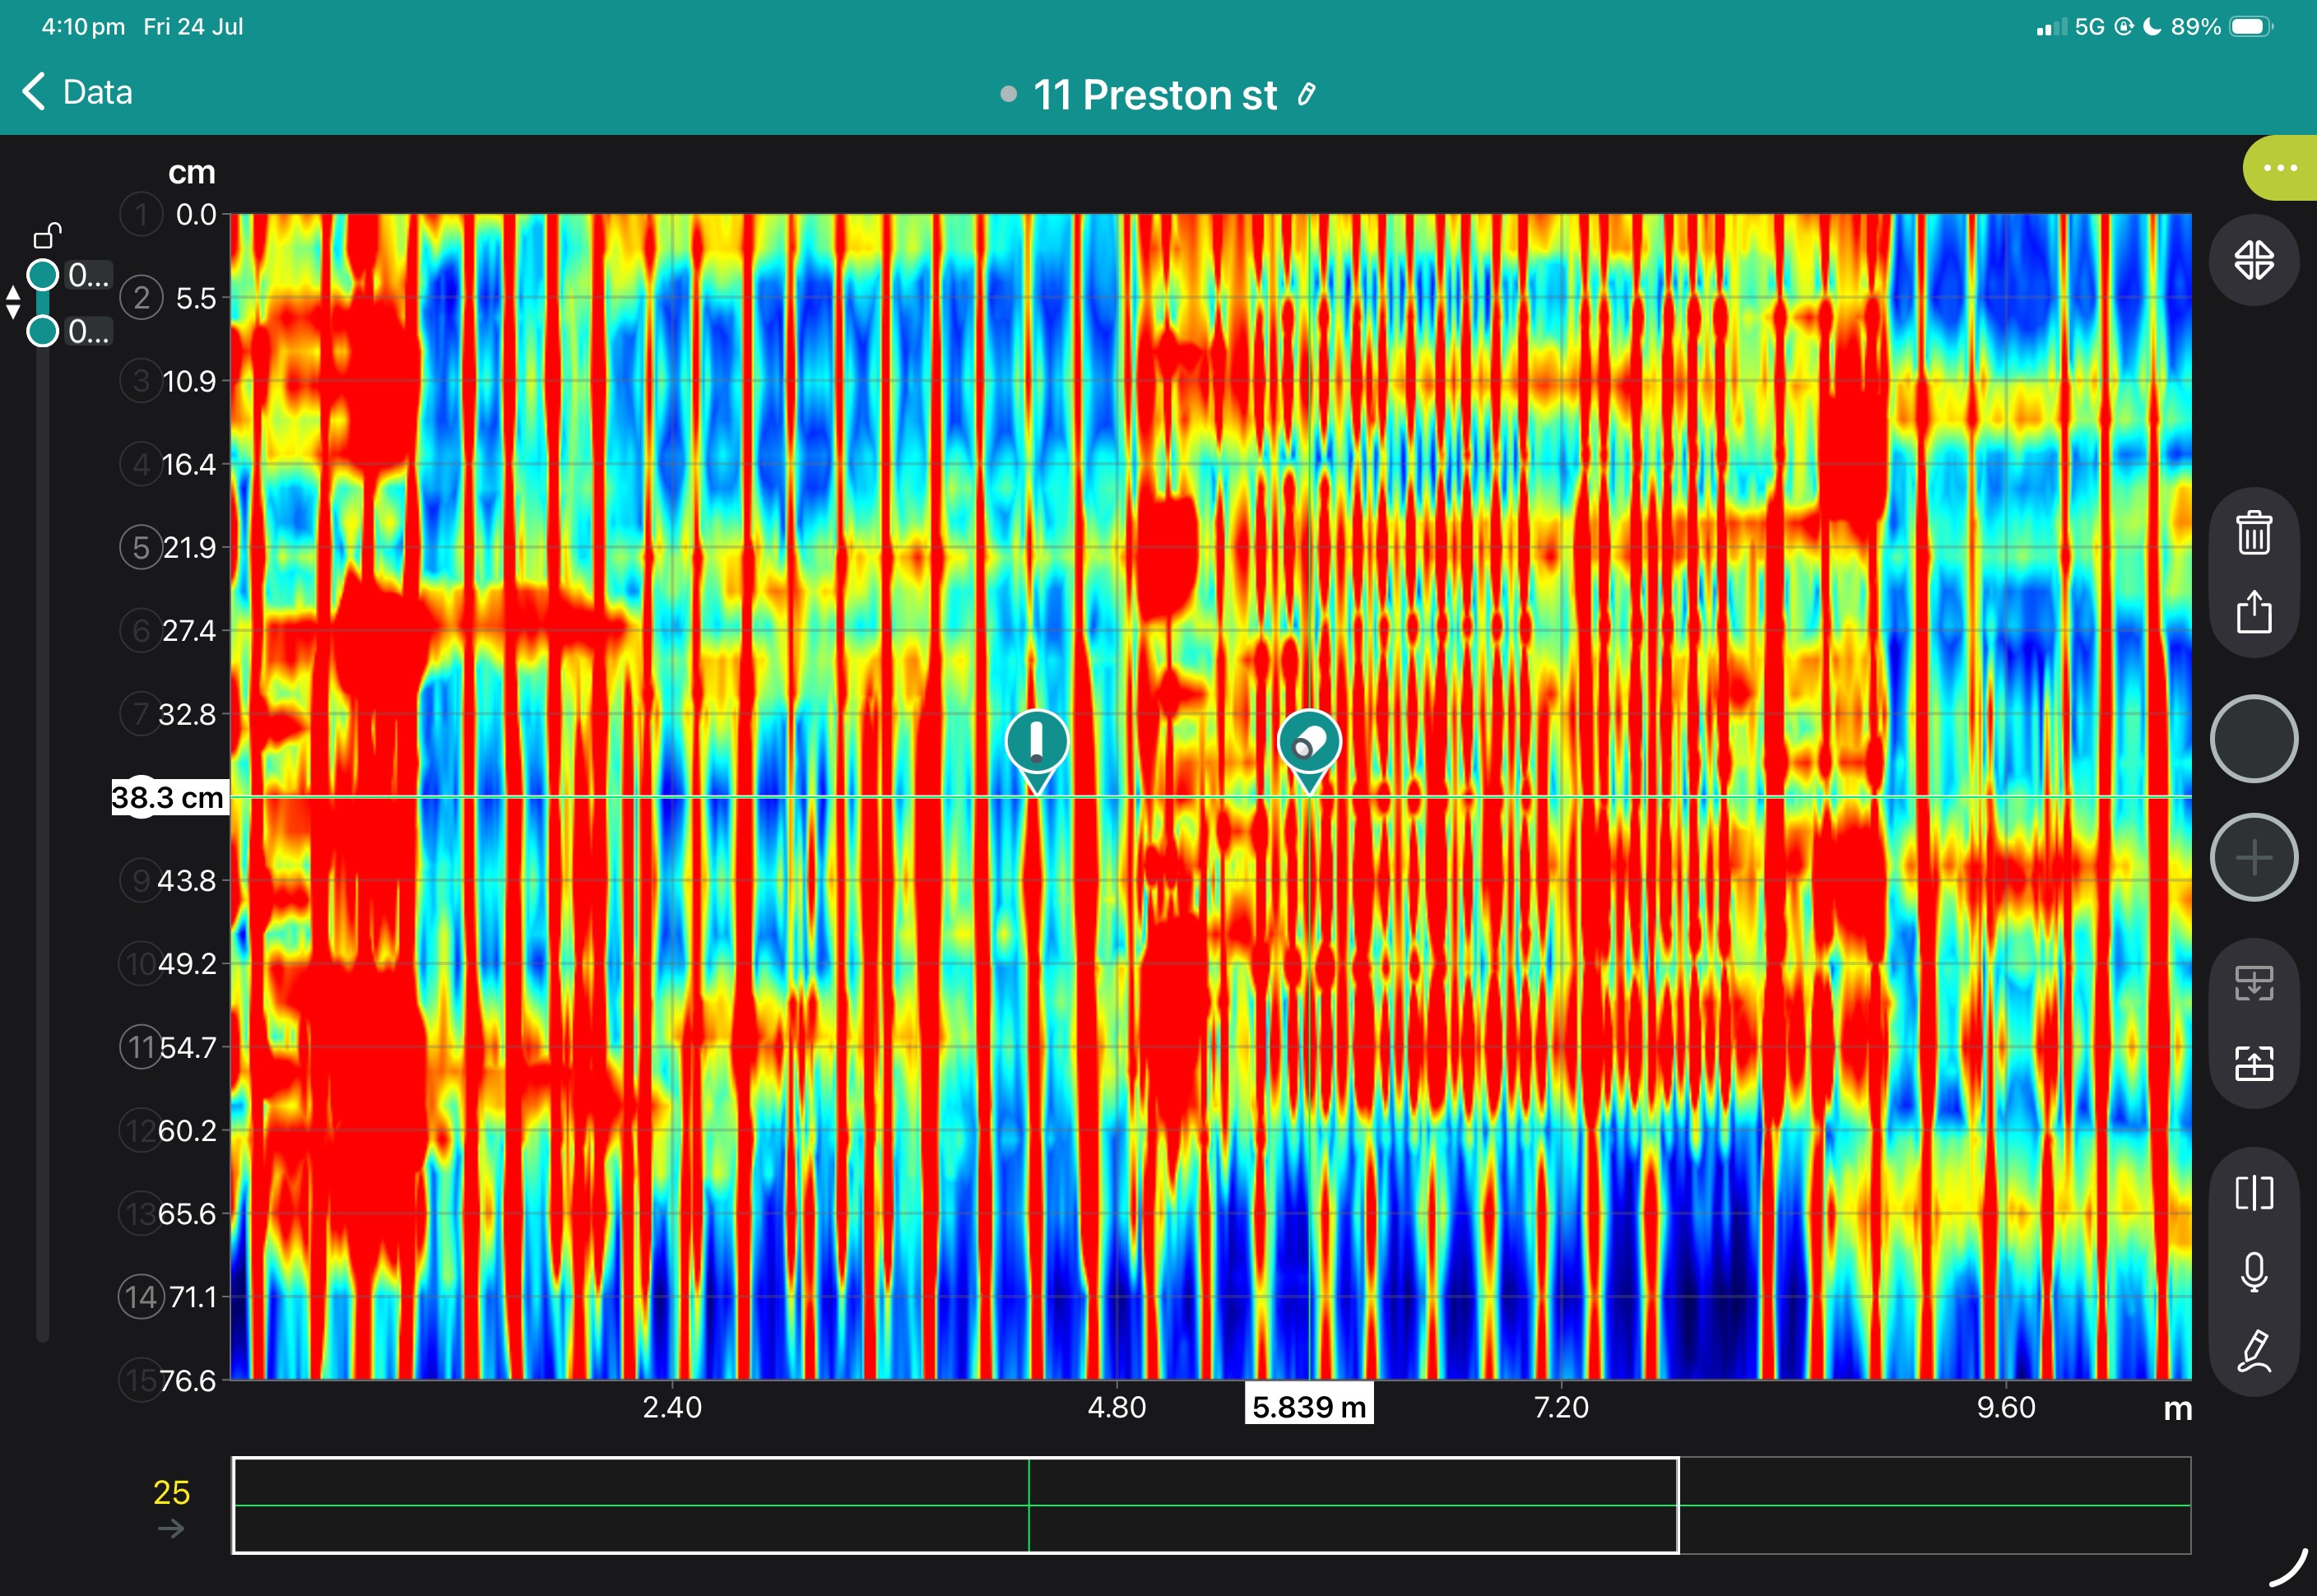
The GX1 transforms the GS9000 into a high-resolution structural assessment system for concrete slabs, bridge decks and pavements. Its dense, dual-polarisation array captures detailed 3D data across wide areas, supporting reinforcement and cover mapping, moisture and deterioration assessment, and analysis of asphalt and pavement layers. Live visualisation helps confirm survey coverage on site, while post-processing tools produce clear, report-ready condition maps.
1. Define the inspection area
Import the structure, bridge, pavement or survey background.
2. Collect closely spaced profiles
Capture 35 longitudinal and 15 cross-polarised channels with dense spacing.
3. Review coverage in the field
Use live radargrams and time slices to confirm that the required area has been captured.
4. Process the dataset
Apply velocity, gain, background removal, migration, filtering and topographic correction as appropriate.
5. Generate diagnostic maps
Create depth slices, reinforcement maps, layer information or application-specific condition maps.
6. Integrate with the engineering assessment
Export figures, mapped anomalies and raw data for inclusion in the engineer’s final interpretation and report.
Field information
Processed Diagnostic Information
Engineering deliverables
View some of these features at work below, and our case study if you'd like to see more of what the GS9000 can do.




Book a Structural Assessment Demonstration
GS9000 cart with:

Manufacturer brochure with product image, advantages and specifications.
Quick start guide for the PD8050. Contains package contents, battery installation instructions, and how to download and log into the Pundit Array app.