%20vector%20logo.svg)


Phone: 02 9453 9999 or Email: sales-operations@pcte.com.au

The GP8000 is a portable concrete GPR radar. Faster, easier concrete inspections and structural imaging with SFCW ground penetrating radar technology.
Overview | GX1 vs GX2 | SUE & Utilities | Structures & Pavements | Software & Outputs | Case Studies | Specifications | Support
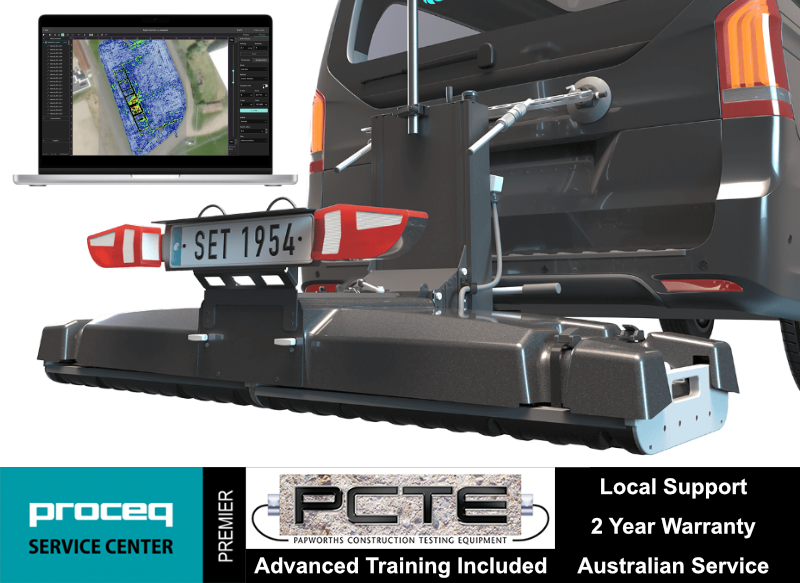
Collect high-density, georeferenced GPR data across wide areas and view the subsurface in 3D as you scan. Choose the GX2 array for SUE and utility mapping, or the GX1 array for structural, bridge and pavement investigations.
Best suited to:
Best suited to:
Recommended array: GX2
Recommended array: GX1
Cover more ground
Collect multiple parallel profiles in one pass instead of uilding a grid line by line.
See results during acquisition
View georeferenced radargrams and time-slice information in the field rather than waiting until the data is returned to the office.
Produce repeatable mapped data
Combine wheel-positioned GPR data with GNSS, project coordinates and survey linework.
Use one platform for two very different applications
Exchange GX1 and GX2 arrays without purchasing two complete cart platforms.
The GX2 transforms the GS9000 into a high-density subsurface utility mapping system. Its 11-channel, low-frequency GPR array captures an 83 cm-wide swath in each pass, helping operators detect and map buried pipes, ducts, cables, voids and other subsurface features. Live georeferenced data lets SUE teams review coverage on site and produce accurate CAD, GIS and project-coordinate deliverables.
1. Plan the survey
Load satellite imagery, CAD information, project coordinates or survey control.
2. Collect dense multichannel data
Survey an approximately 0.82 m-wide swath with 11 channels in each pass.
3. Review data live
Examine radargrams, georeferenced time slices and marked features while still on site.
4. Interpret and digitise
Add points, linework, tags, photographs and field observations.
5. Process and deliver
Merge survey areas, apply processing and export mapped information for the customer’s CAD, GIS or reporting workflow.
View the images below to see these in action.
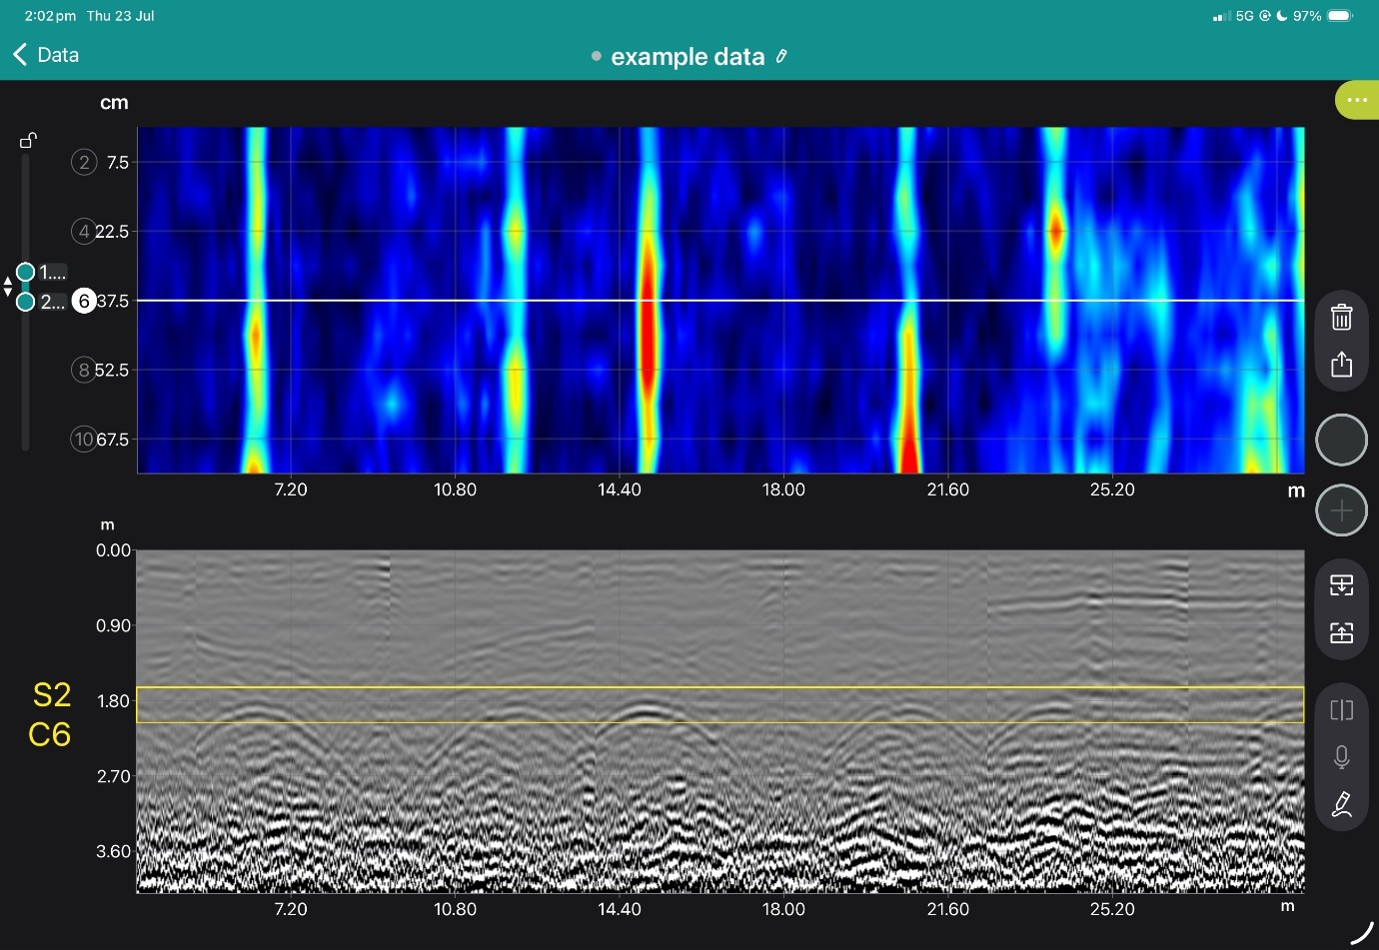
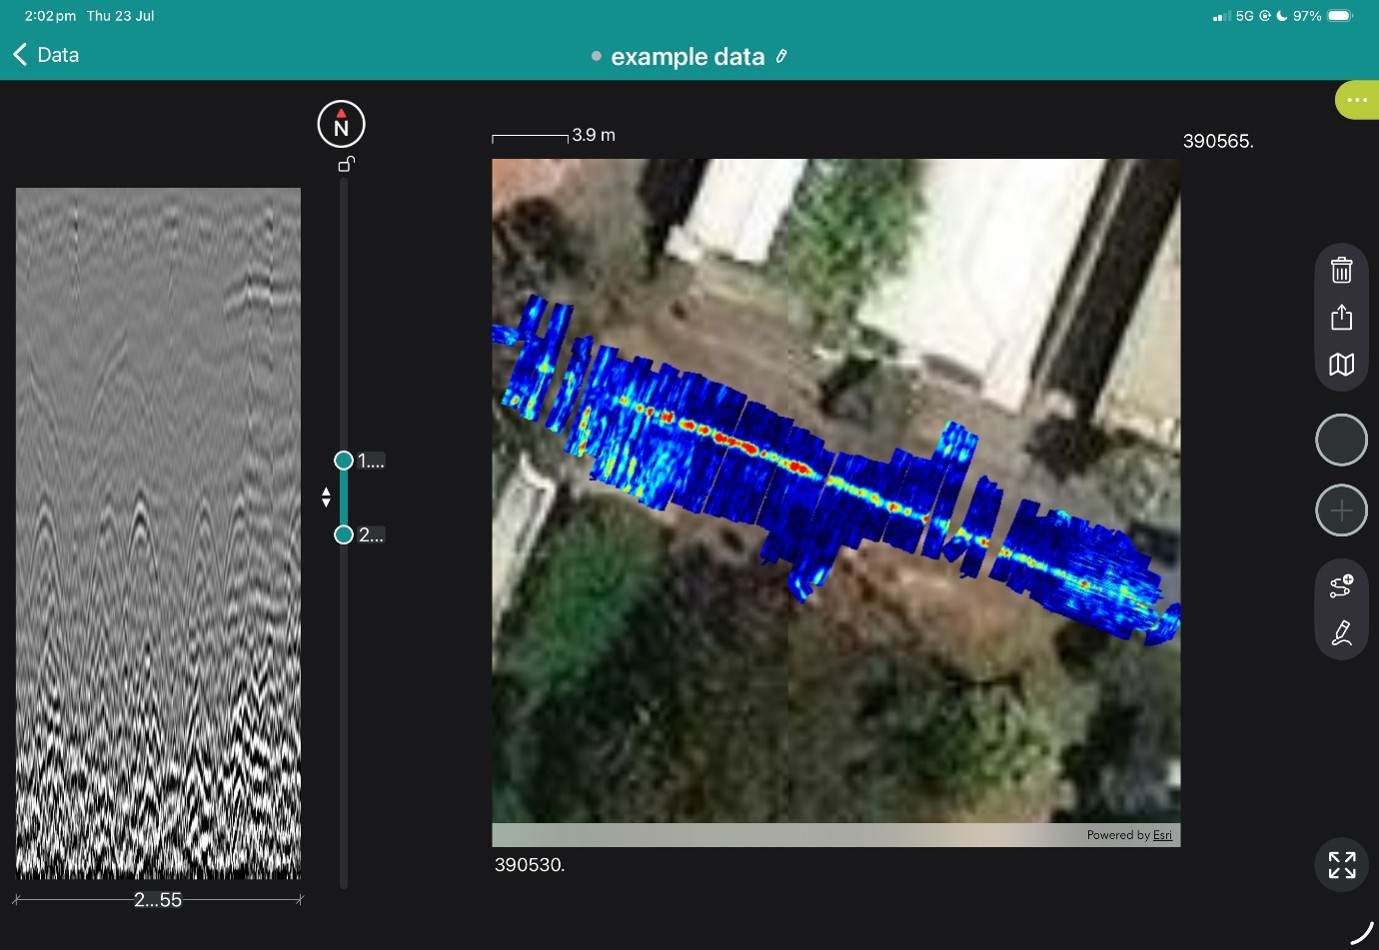
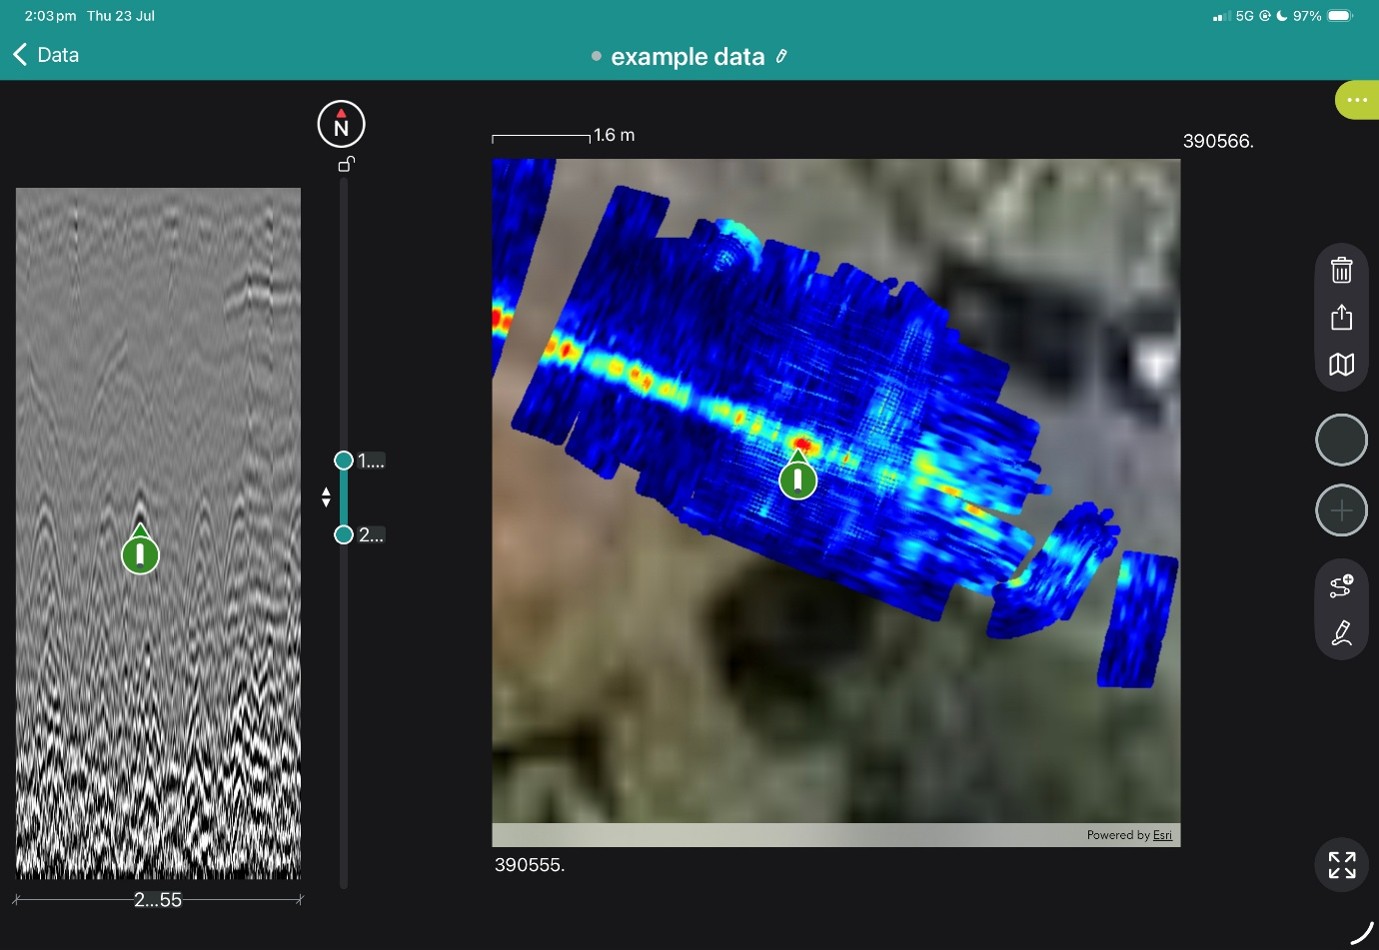
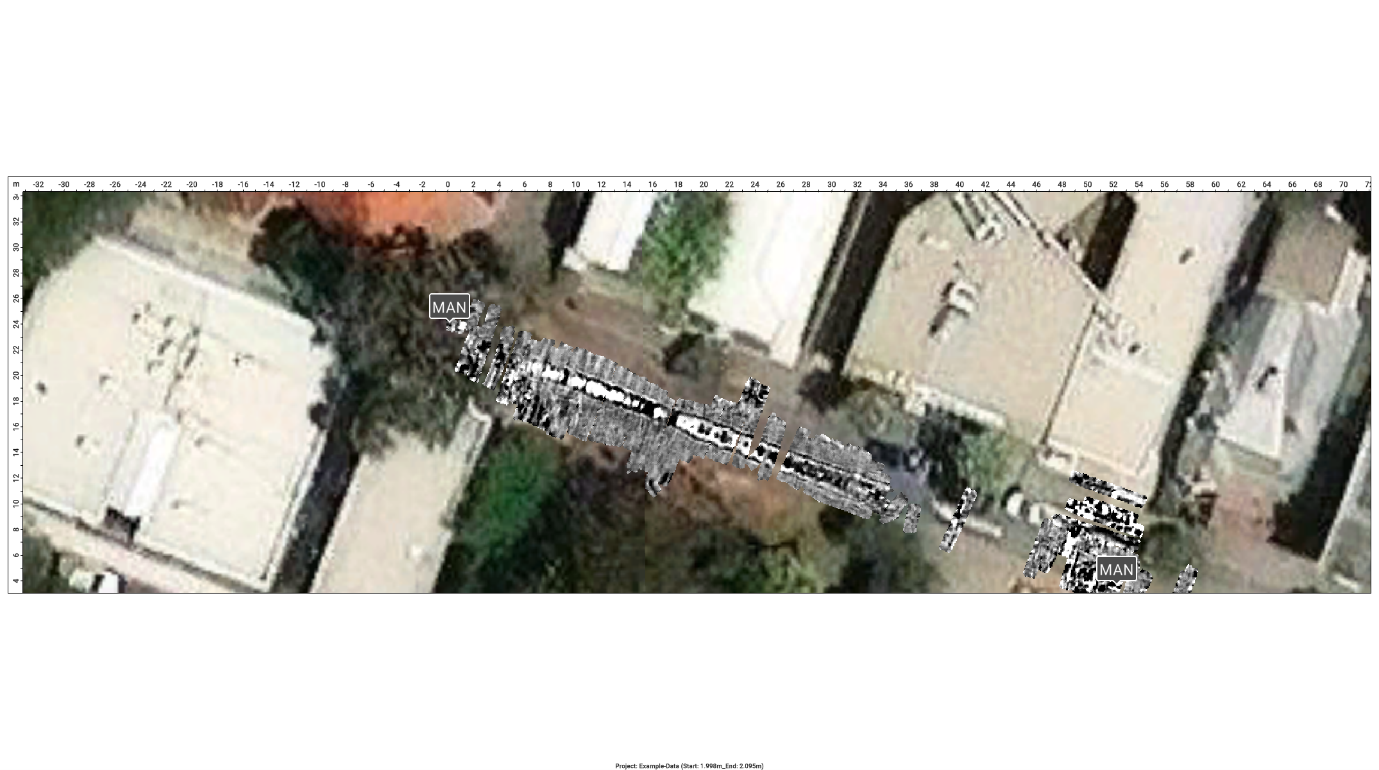
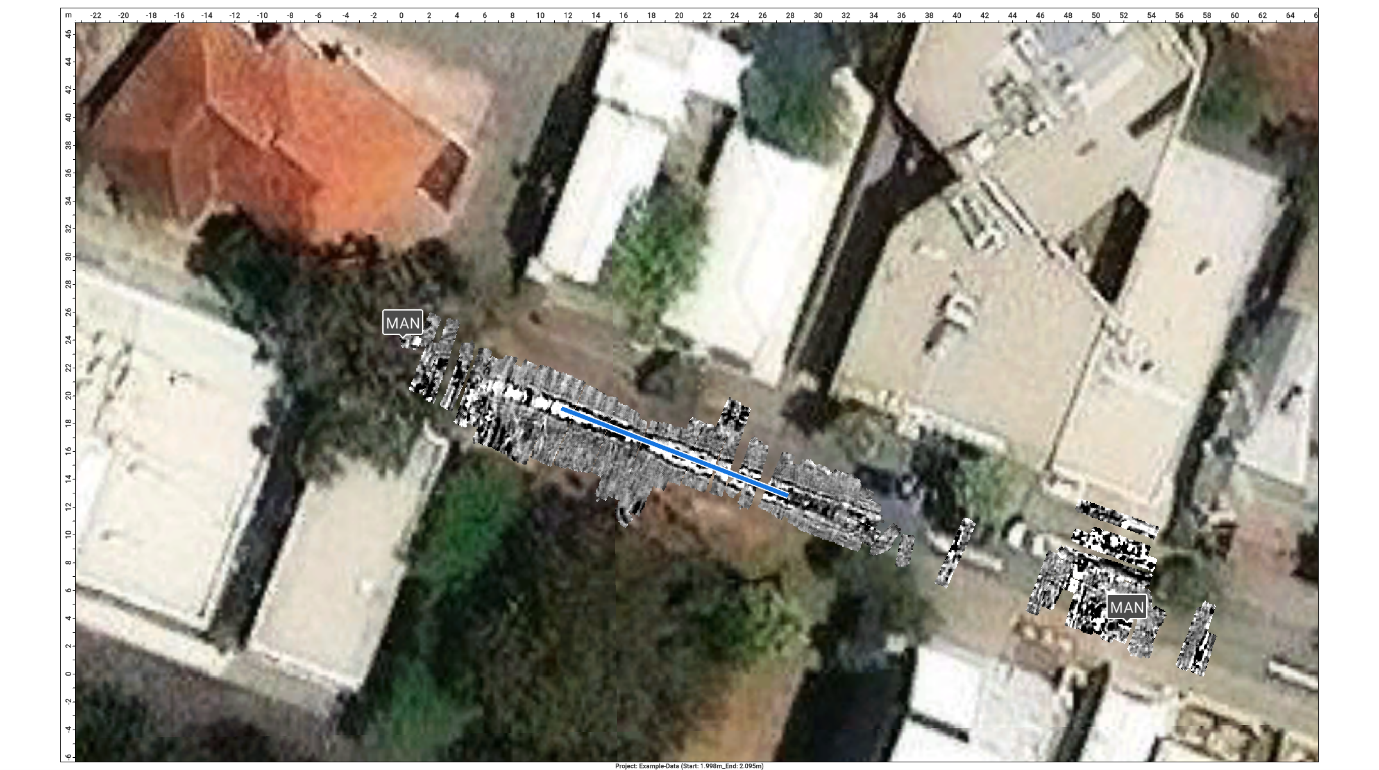
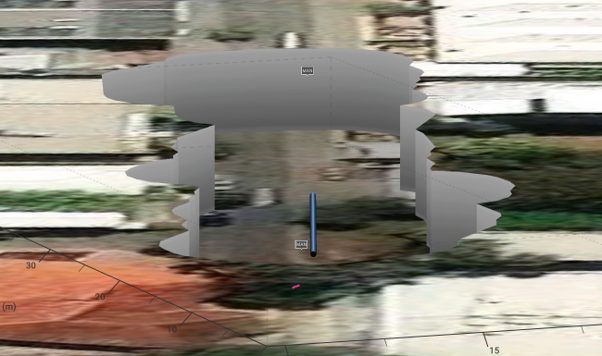

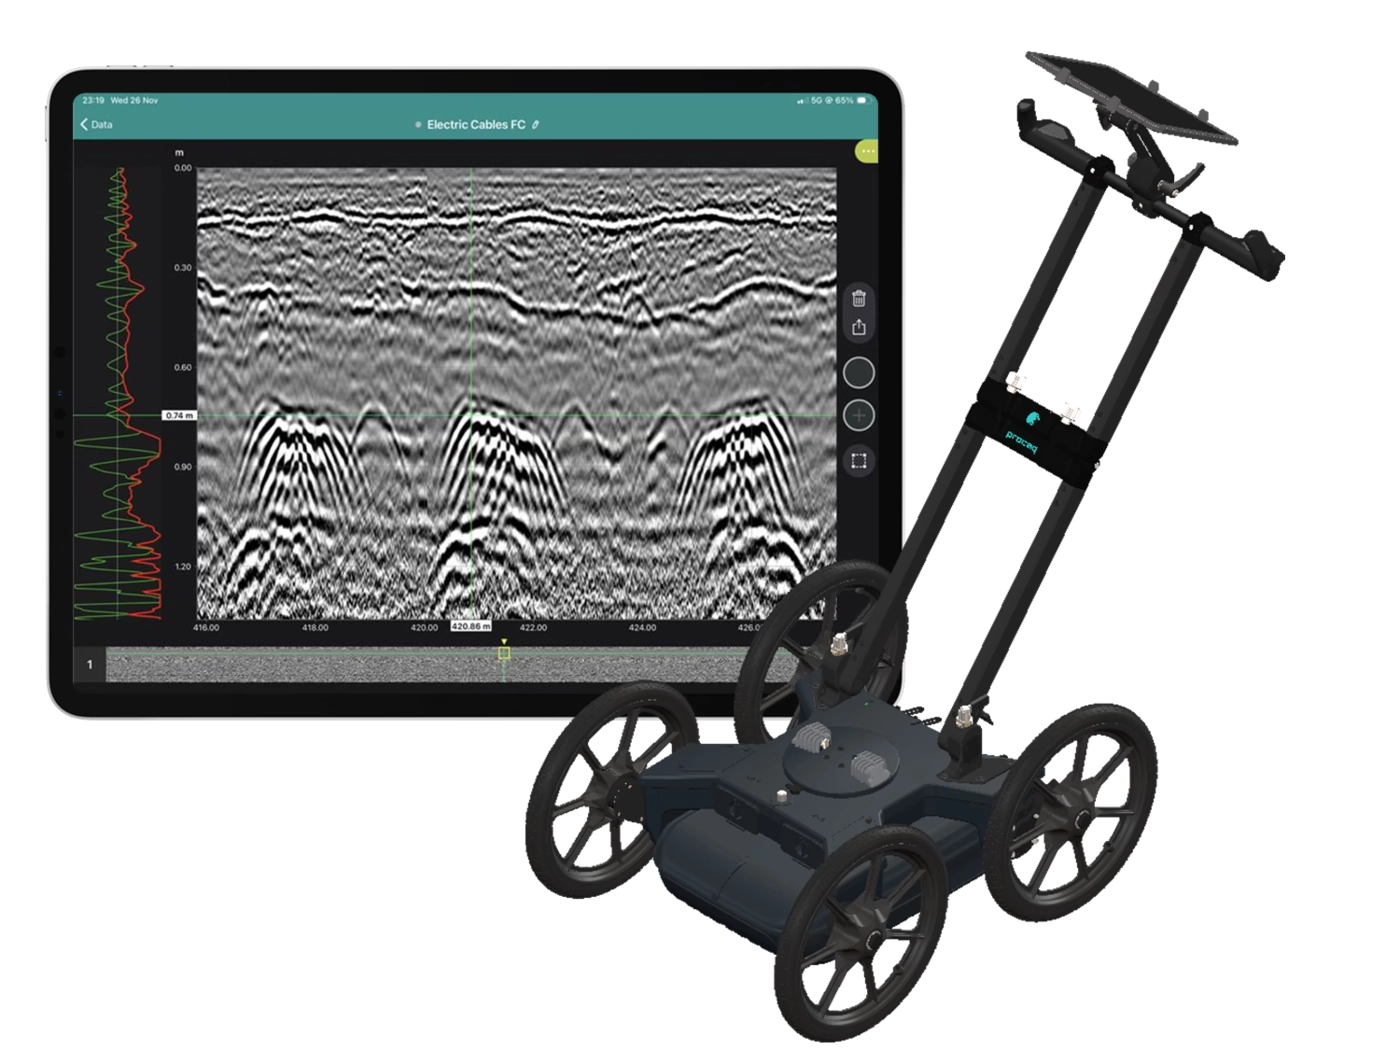
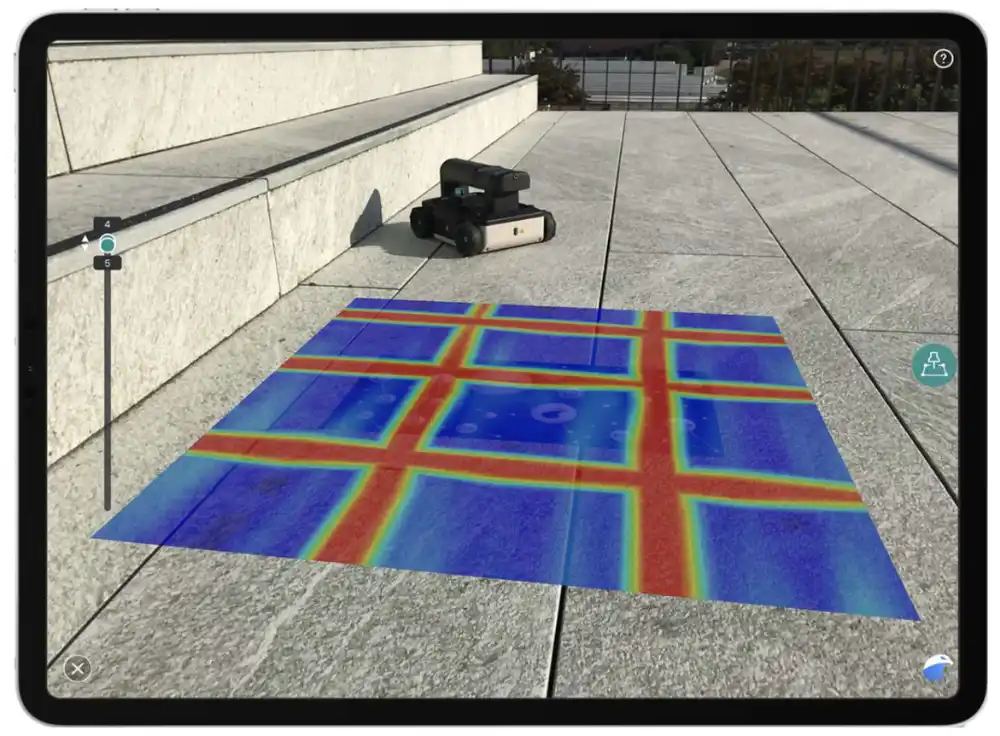
Proceq's GP8000 achieves market leading maximum detection depth with clear GPR scans in conventional radargram and migrated views. The GP8000 lite model is an Ideal choice for locating embedded post tensioning, services and reinforcing steel in concrete structures before cutting and drilling. A GP8000 model introduces the full Proceq workflow, full 3D grid scan and Augmented reality viewing in the GP app and sync to the Workspace Web service that combines cloud storage,data management, report creation and exporting.
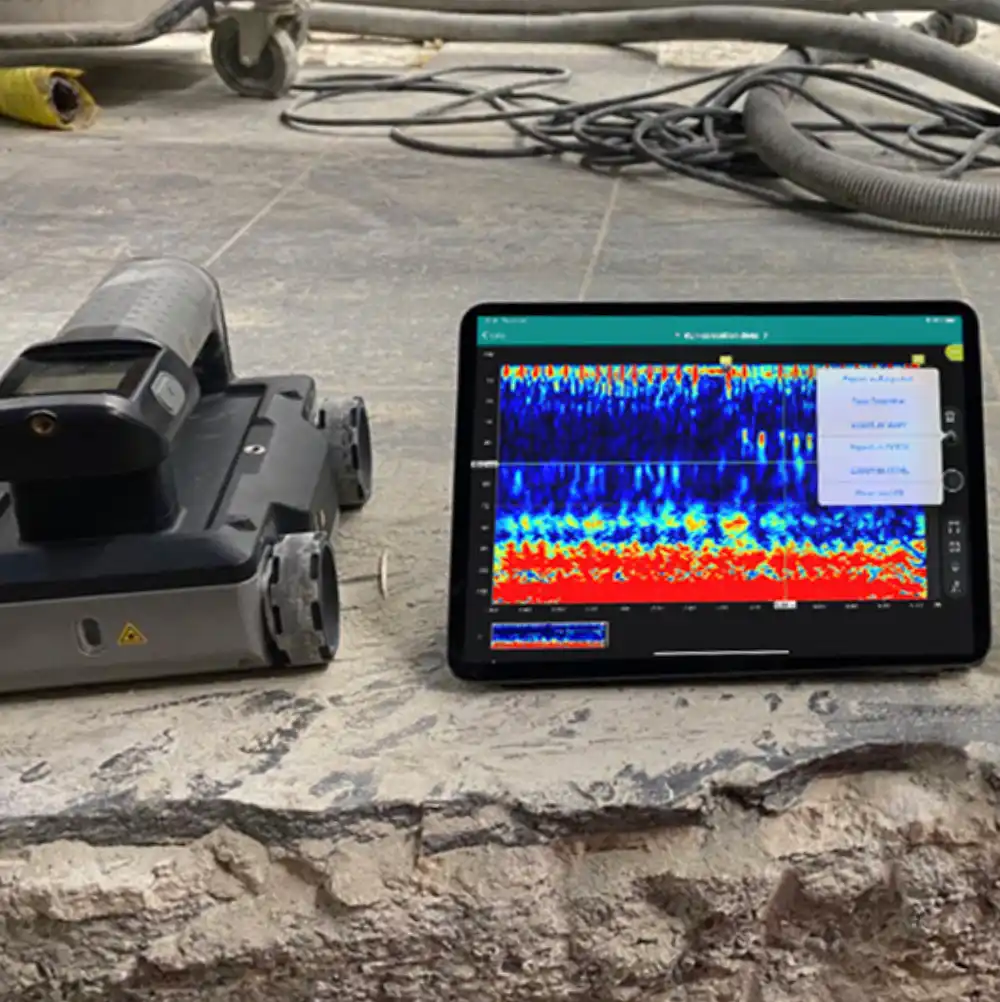
The GP8000 is built into a lightweight and robust housing which is easily manoeuvrable. The GPR probe operates with standard rechargeable AA batteries to guarantee easy battery replacements.
The probe connects wirelessly to an Apple iPad (touchscreen up to 12.9¹ with iPad Pro) utilising the Proceq GP app for scanning, real-time data analysis and sharing. The use of an iPad application also enables the constant development of new features for the Proceq Concrete GPR range such as the the addition of docx exporting added in September of 2025.
Users who prefer a screen attached to their scanner may mount the iPad directly to the GP8000 or to the options extension rod. The probe is completely independent and has a wireless range of up to 20m.
Note: Apple iPad is not included with purchase of the Proceq GPR.
The Proceq GPR concrete scanner utilises ultra-wideband technology which enables high resolution scanning to a maximum depth of 700mm. All applications typically addressed with multiple antennas can now be covered with one single device with a frequency range of 0.2 to 4.0 GHz.
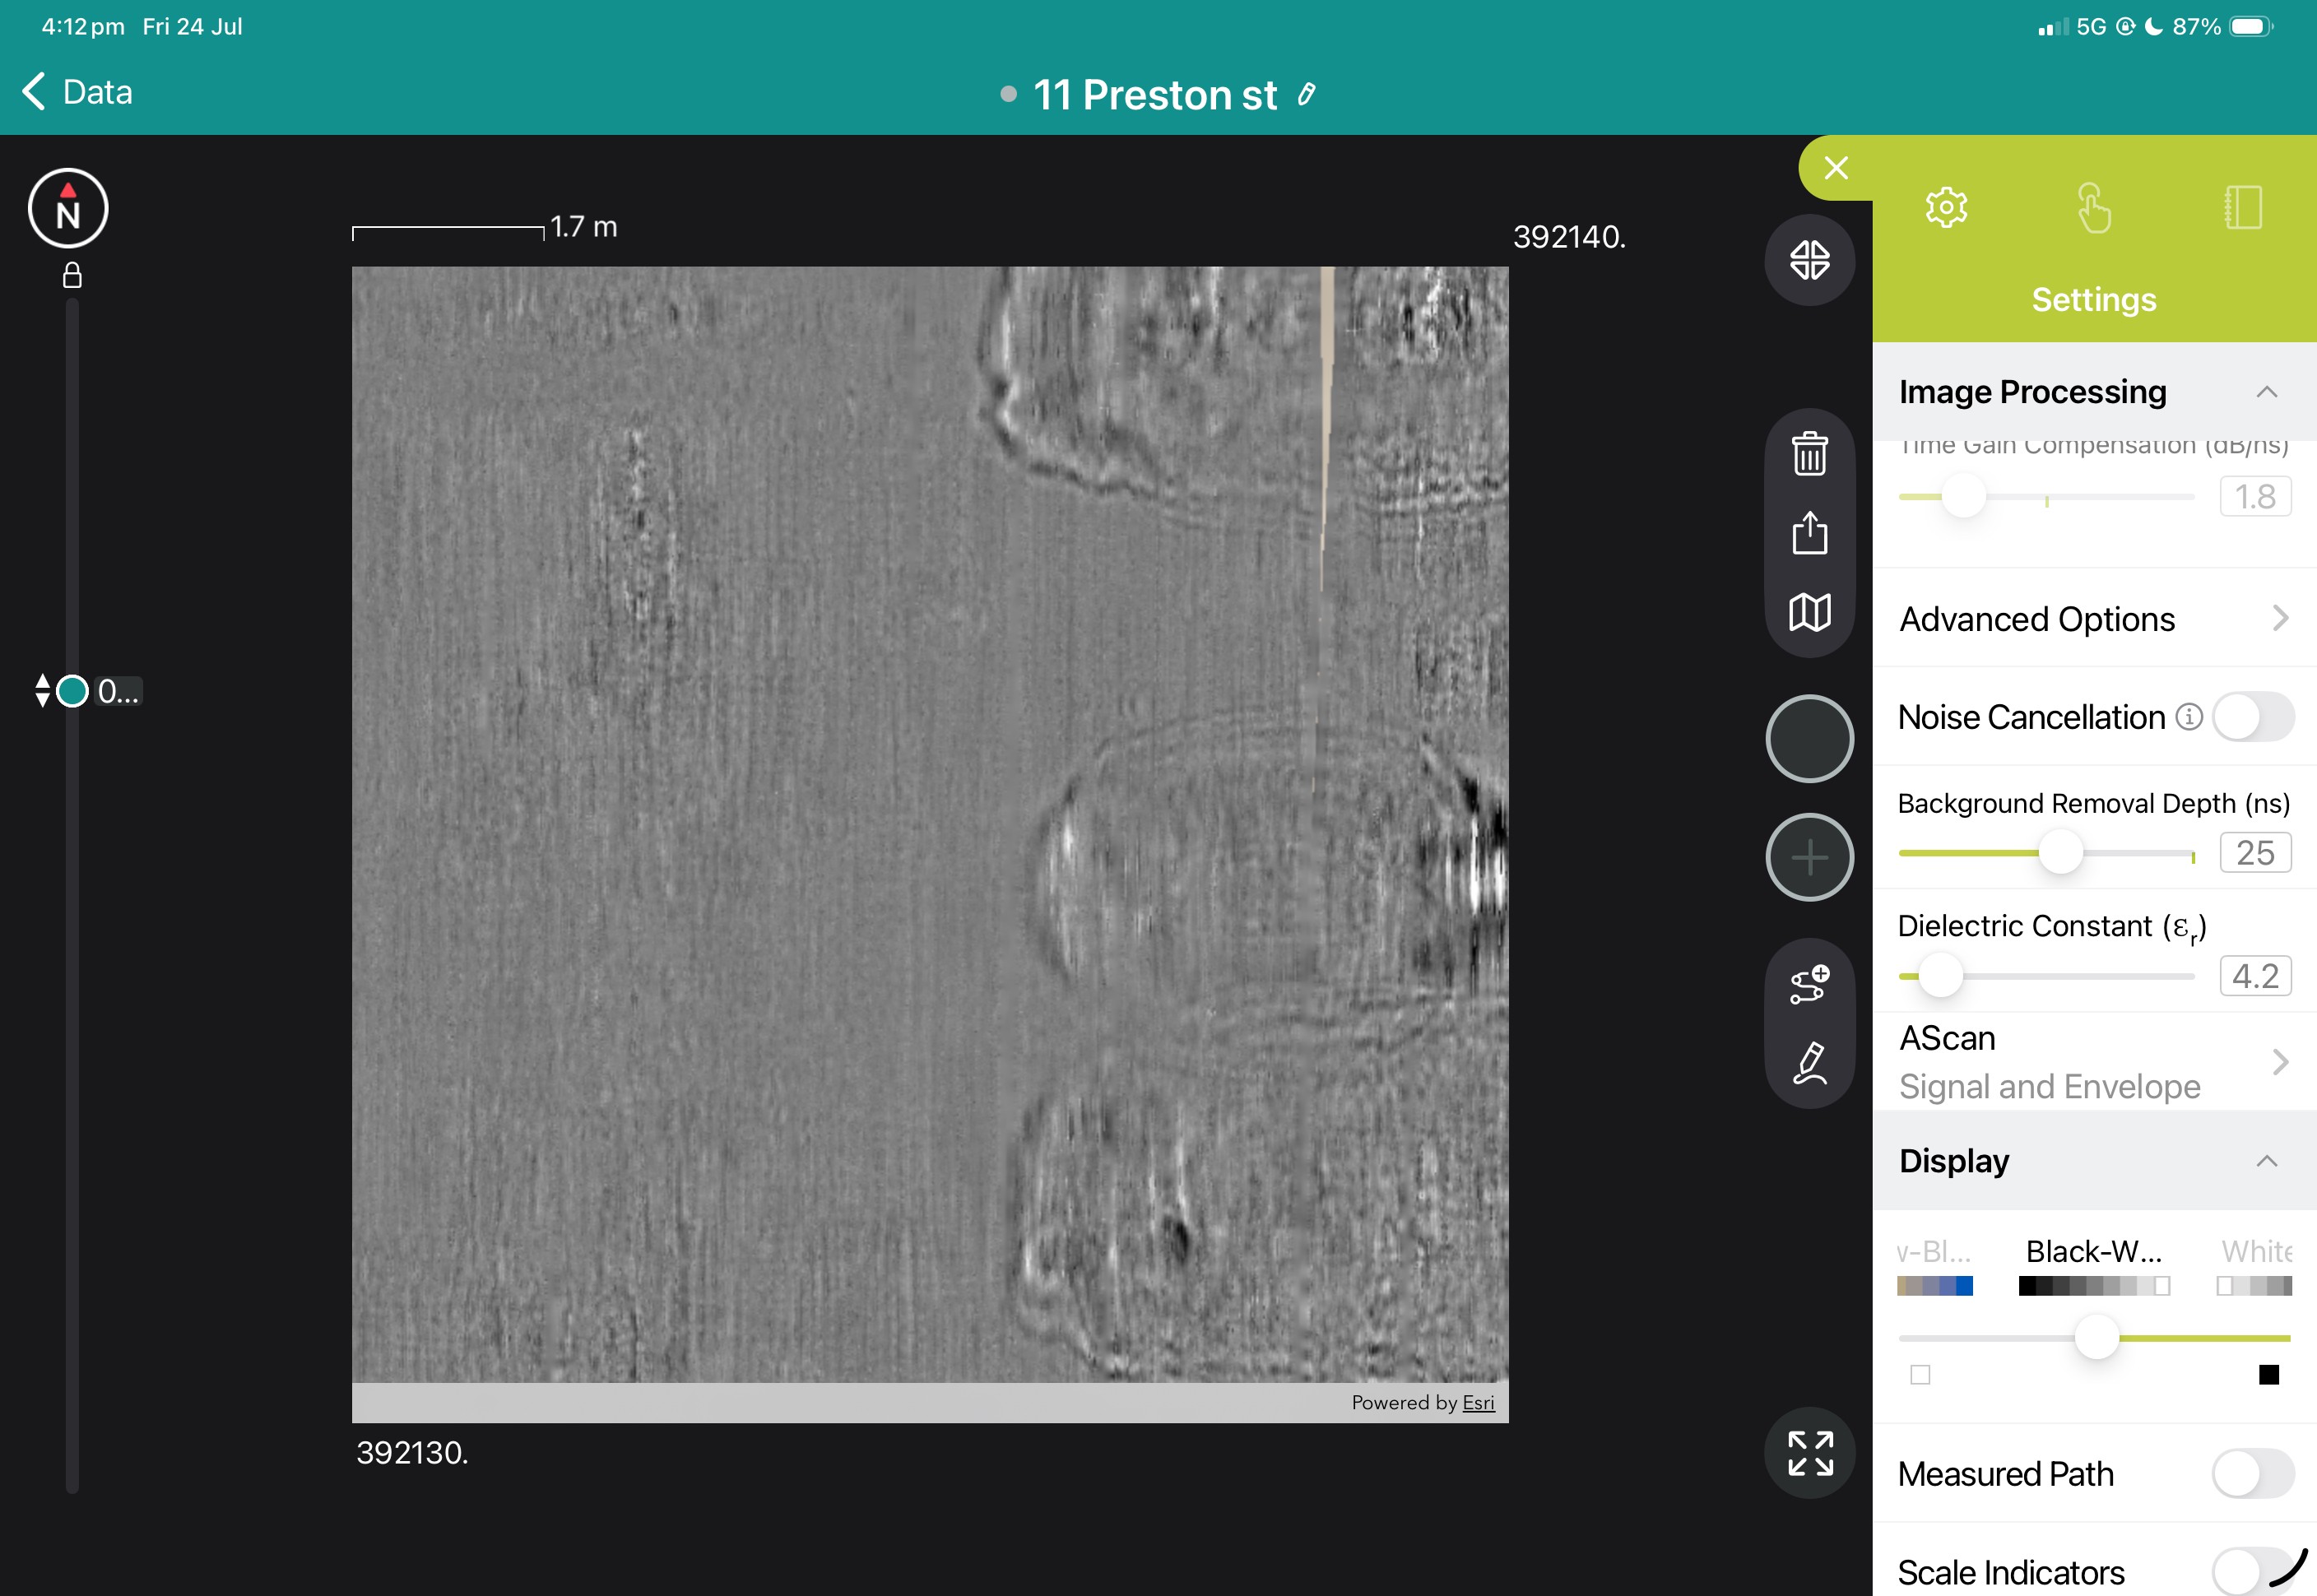
Ground Penetrating Radar data is collected in real-time and the user can switch seamlessly between standard non-migrated scan to the intuitive migrated "Heatmap".
Typical post processing operations such as adjusting gain, selecting or measuring a Dielectric value of the concrete, applying background removal filters and adjusting the maximum scan depth presented may all be completed inside the GP App.
During or after scanning, annotate any 2D scan with the type of target, depth and location in a seamless process on-site to reduce time consuming post-processing or simply draw over top of the scan.
If more information is needed combine many scans taken over a 10 cm or 5cm grid in to a depthslice / timeslice view and on-site 3D.
GPR scans are saved in the Proceq GP App on iPad OS. For GP8000 users, all data is synchronised with the cloud Workspace service and linked to a user's account. This enables post processing and review of data from any Apple iPad the user signs in to and sharing of collected scans and their annotations, written or audio notes, and photos between user accounts.
The Proceq GPR Logbook records all steps in the image processing, where it was collected and the operator of the GPR. This record includes all post processing changes including, dielectric, gain and filter settings, providing a traceable history of a scan which may be viewed in Workspace and shared with a URL link for review by clients and collaborators.
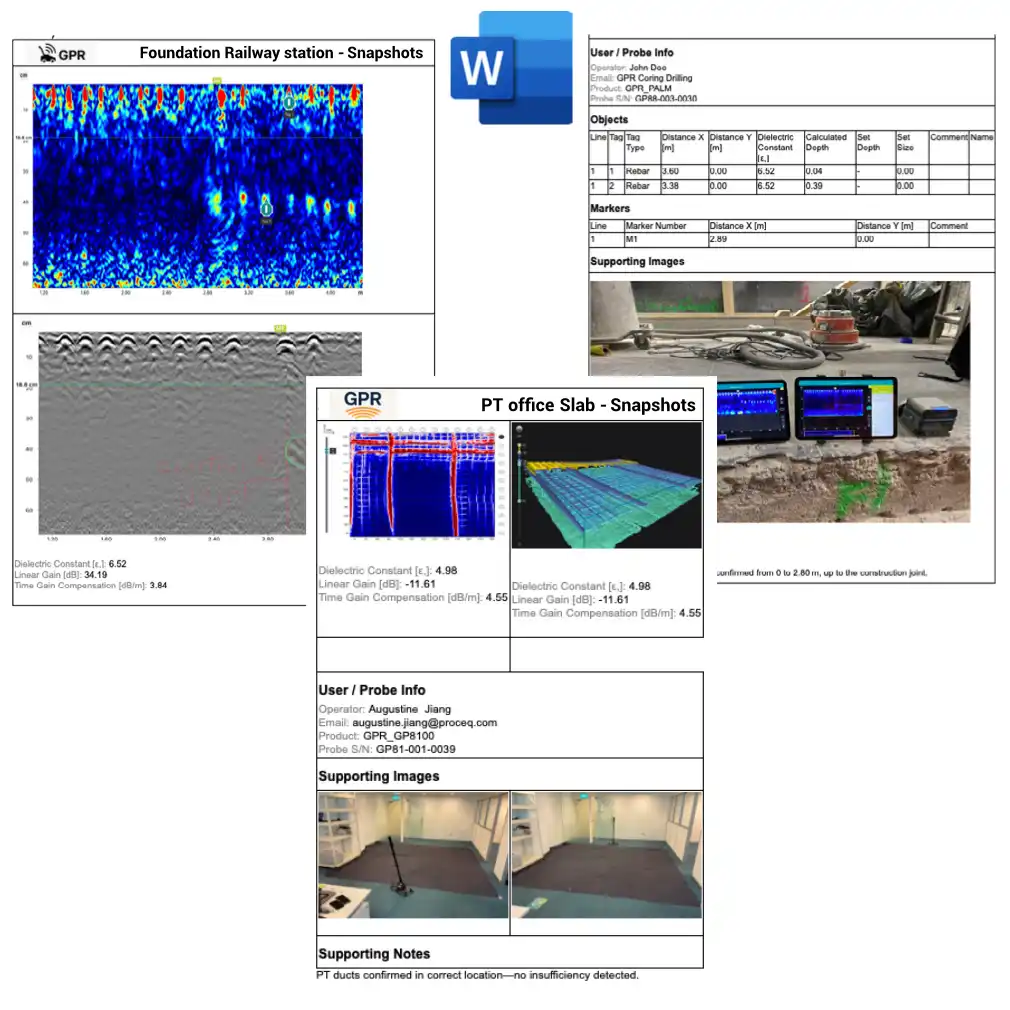
Saved snapshot images of each scan, annotations, a logbook history, recorded notes and images may be exported as a docx file directly from the GP App is a quick client report. In Workspace many scan files may be merged into a larger docx report.
For the most complete Proceq GPR workflow any number of 2D and 3D scans may be directly combined and processed in the optional GPR Insights Web App for complete reprocessing, annotation, visualisation, 3D imaging and even deterioration mapping. Single and batch exports of Raw SEGY data files are also available in the GP App and Workspace for use in any compatible GPR post processing application such as GPR Slice.

Book a SUE Workflow Demonstration
The GX1 transforms the GS9000 into a high-resolution structural assessment system for concrete slabs, bridge decks and pavements. Its dense, dual-polarisation array captures detailed 3D data across wide areas, supporting reinforcement and cover mapping, moisture and deterioration assessment, and analysis of asphalt and pavement layers. Live visualisation helps confirm survey coverage on site, while post-processing tools produce clear, report-ready condition maps.
1. Define the inspection area
Import the structure, bridge, pavement or survey background.
2. Collect closely spaced profiles
Capture 35 longitudinal and 15 cross-polarised channels with dense spacing.
3. Review coverage in the field
Use live radargrams and time slices to confirm that the required area has been captured.
4. Process the dataset
Apply velocity, gain, background removal, migration, filtering and topographic correction as appropriate.
5. Generate diagnostic maps
Create depth slices, reinforcement maps, layer information or application-specific condition maps.
6. Integrate with the engineering assessment
Export figures, mapped anomalies and raw data for inclusion in the engineer’s final interpretation and report.
Field information
Processed Diagnostic Information
Engineering deliverables
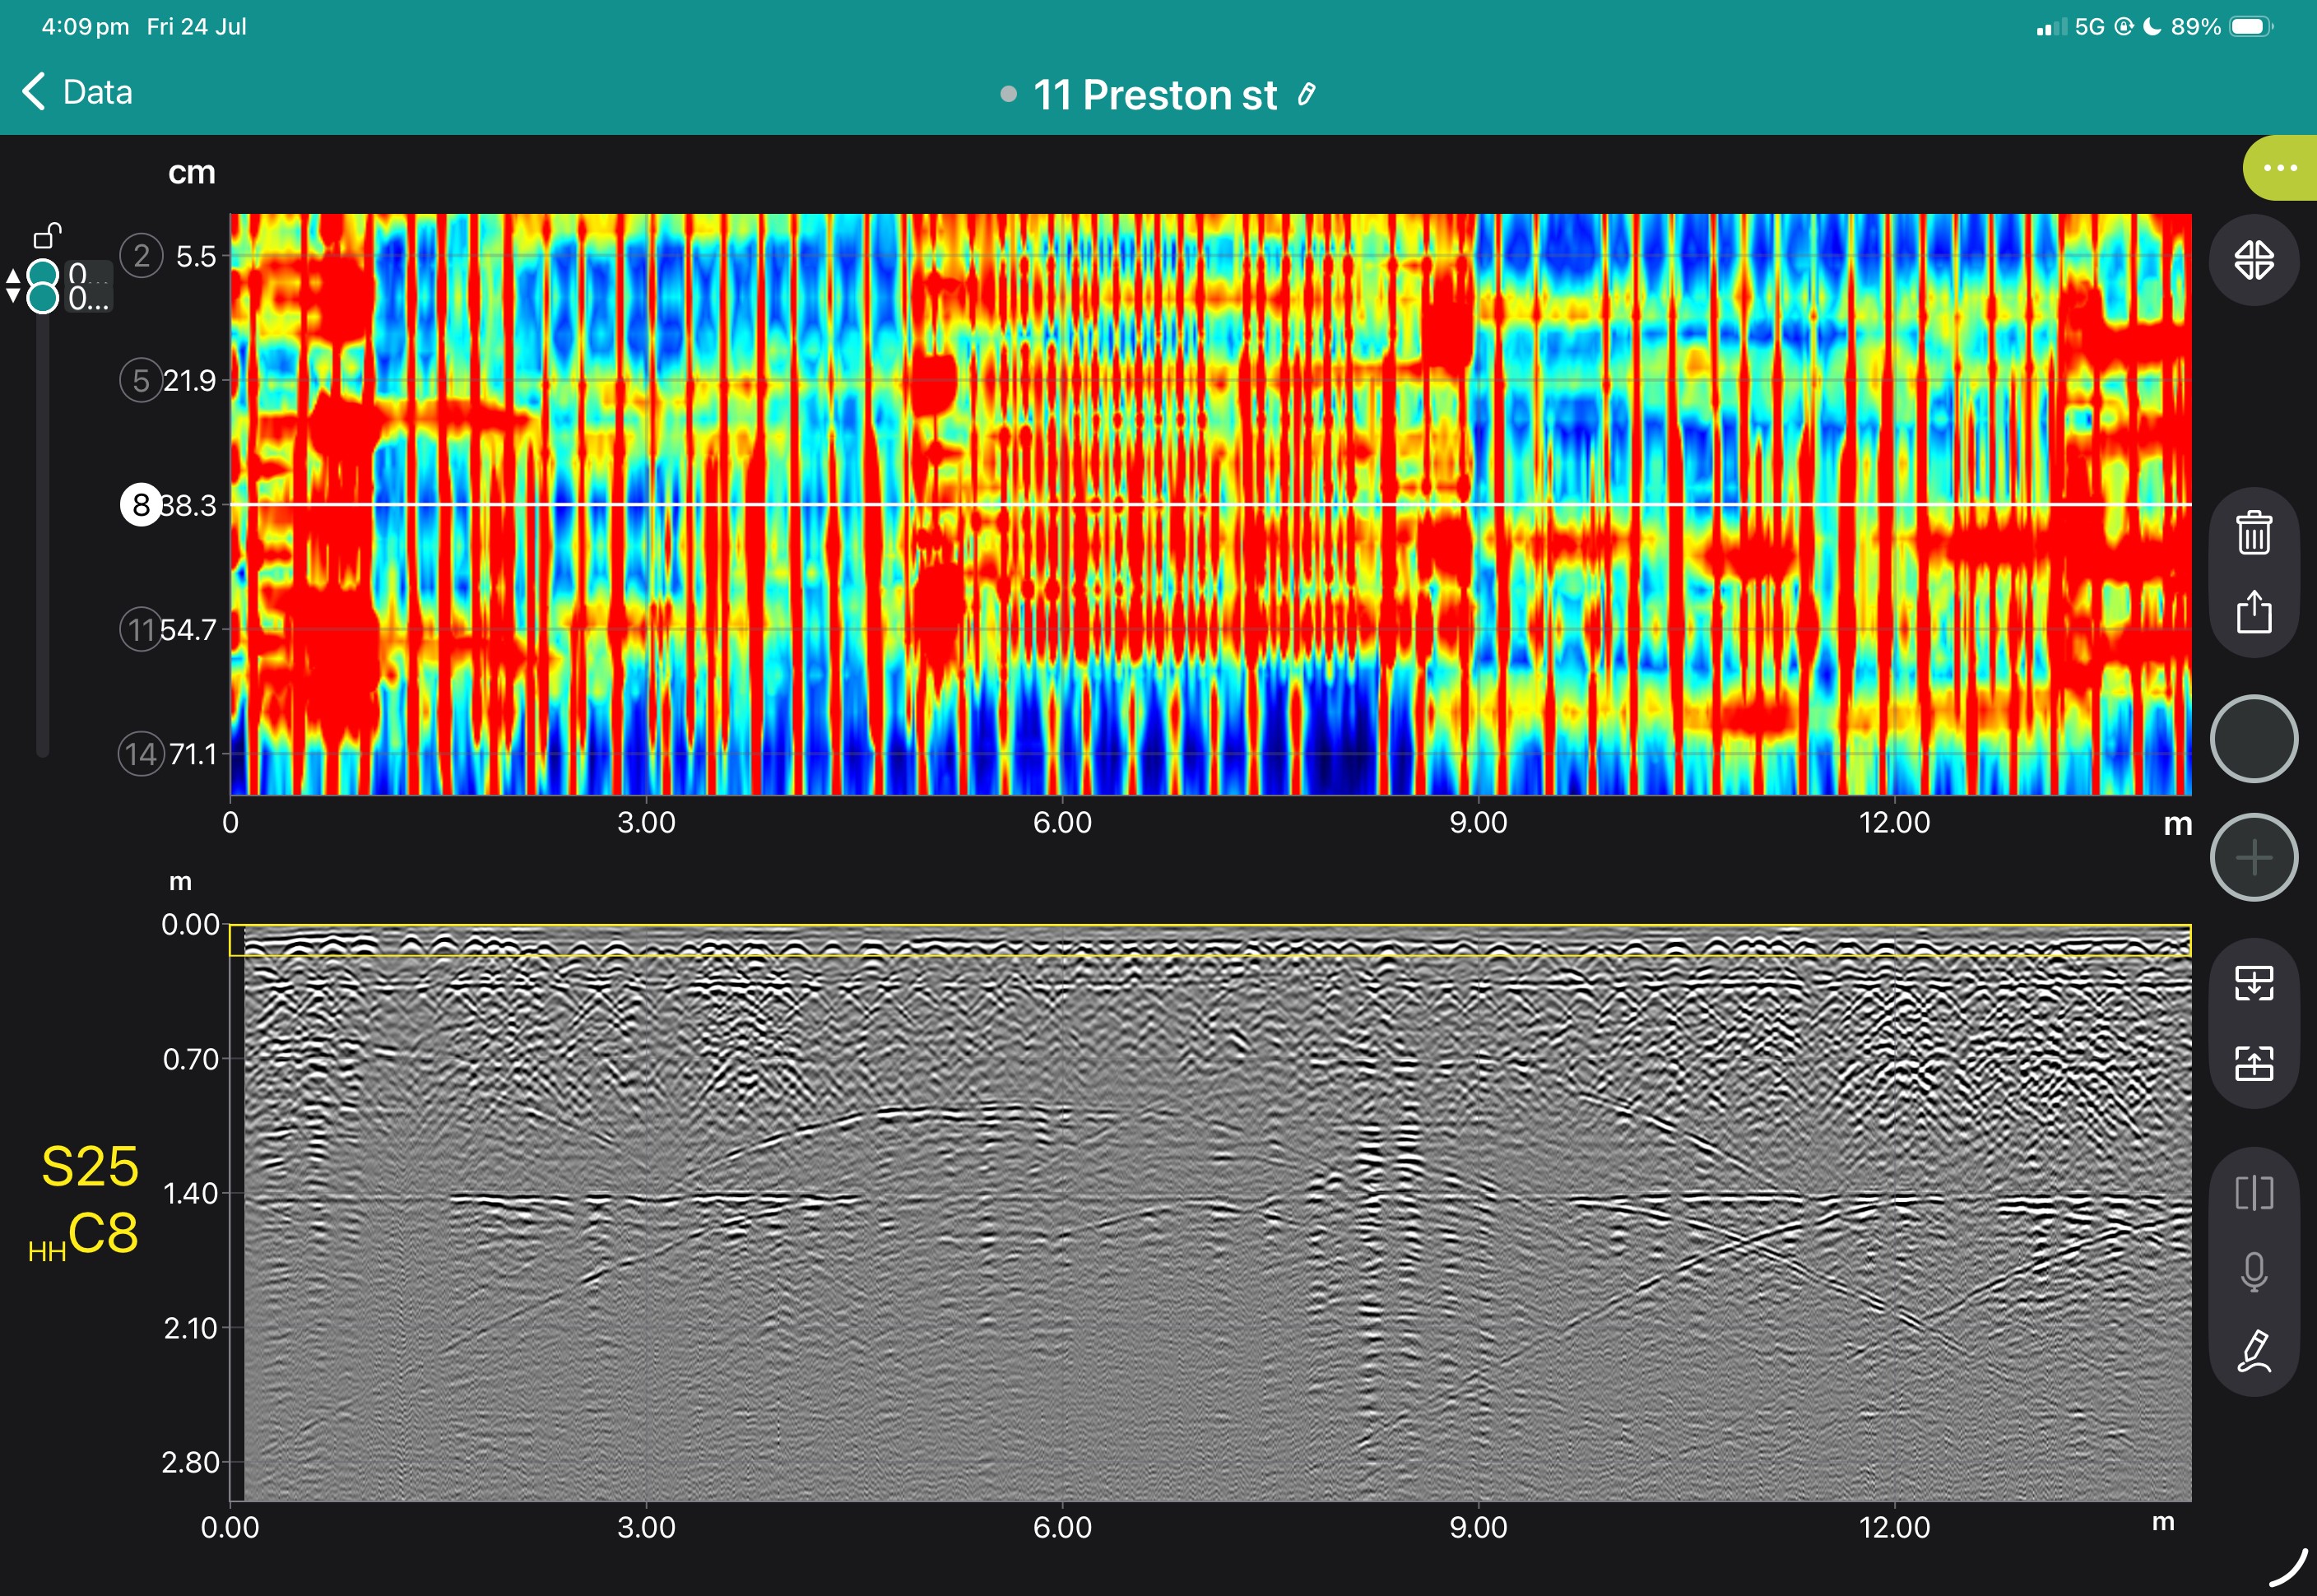
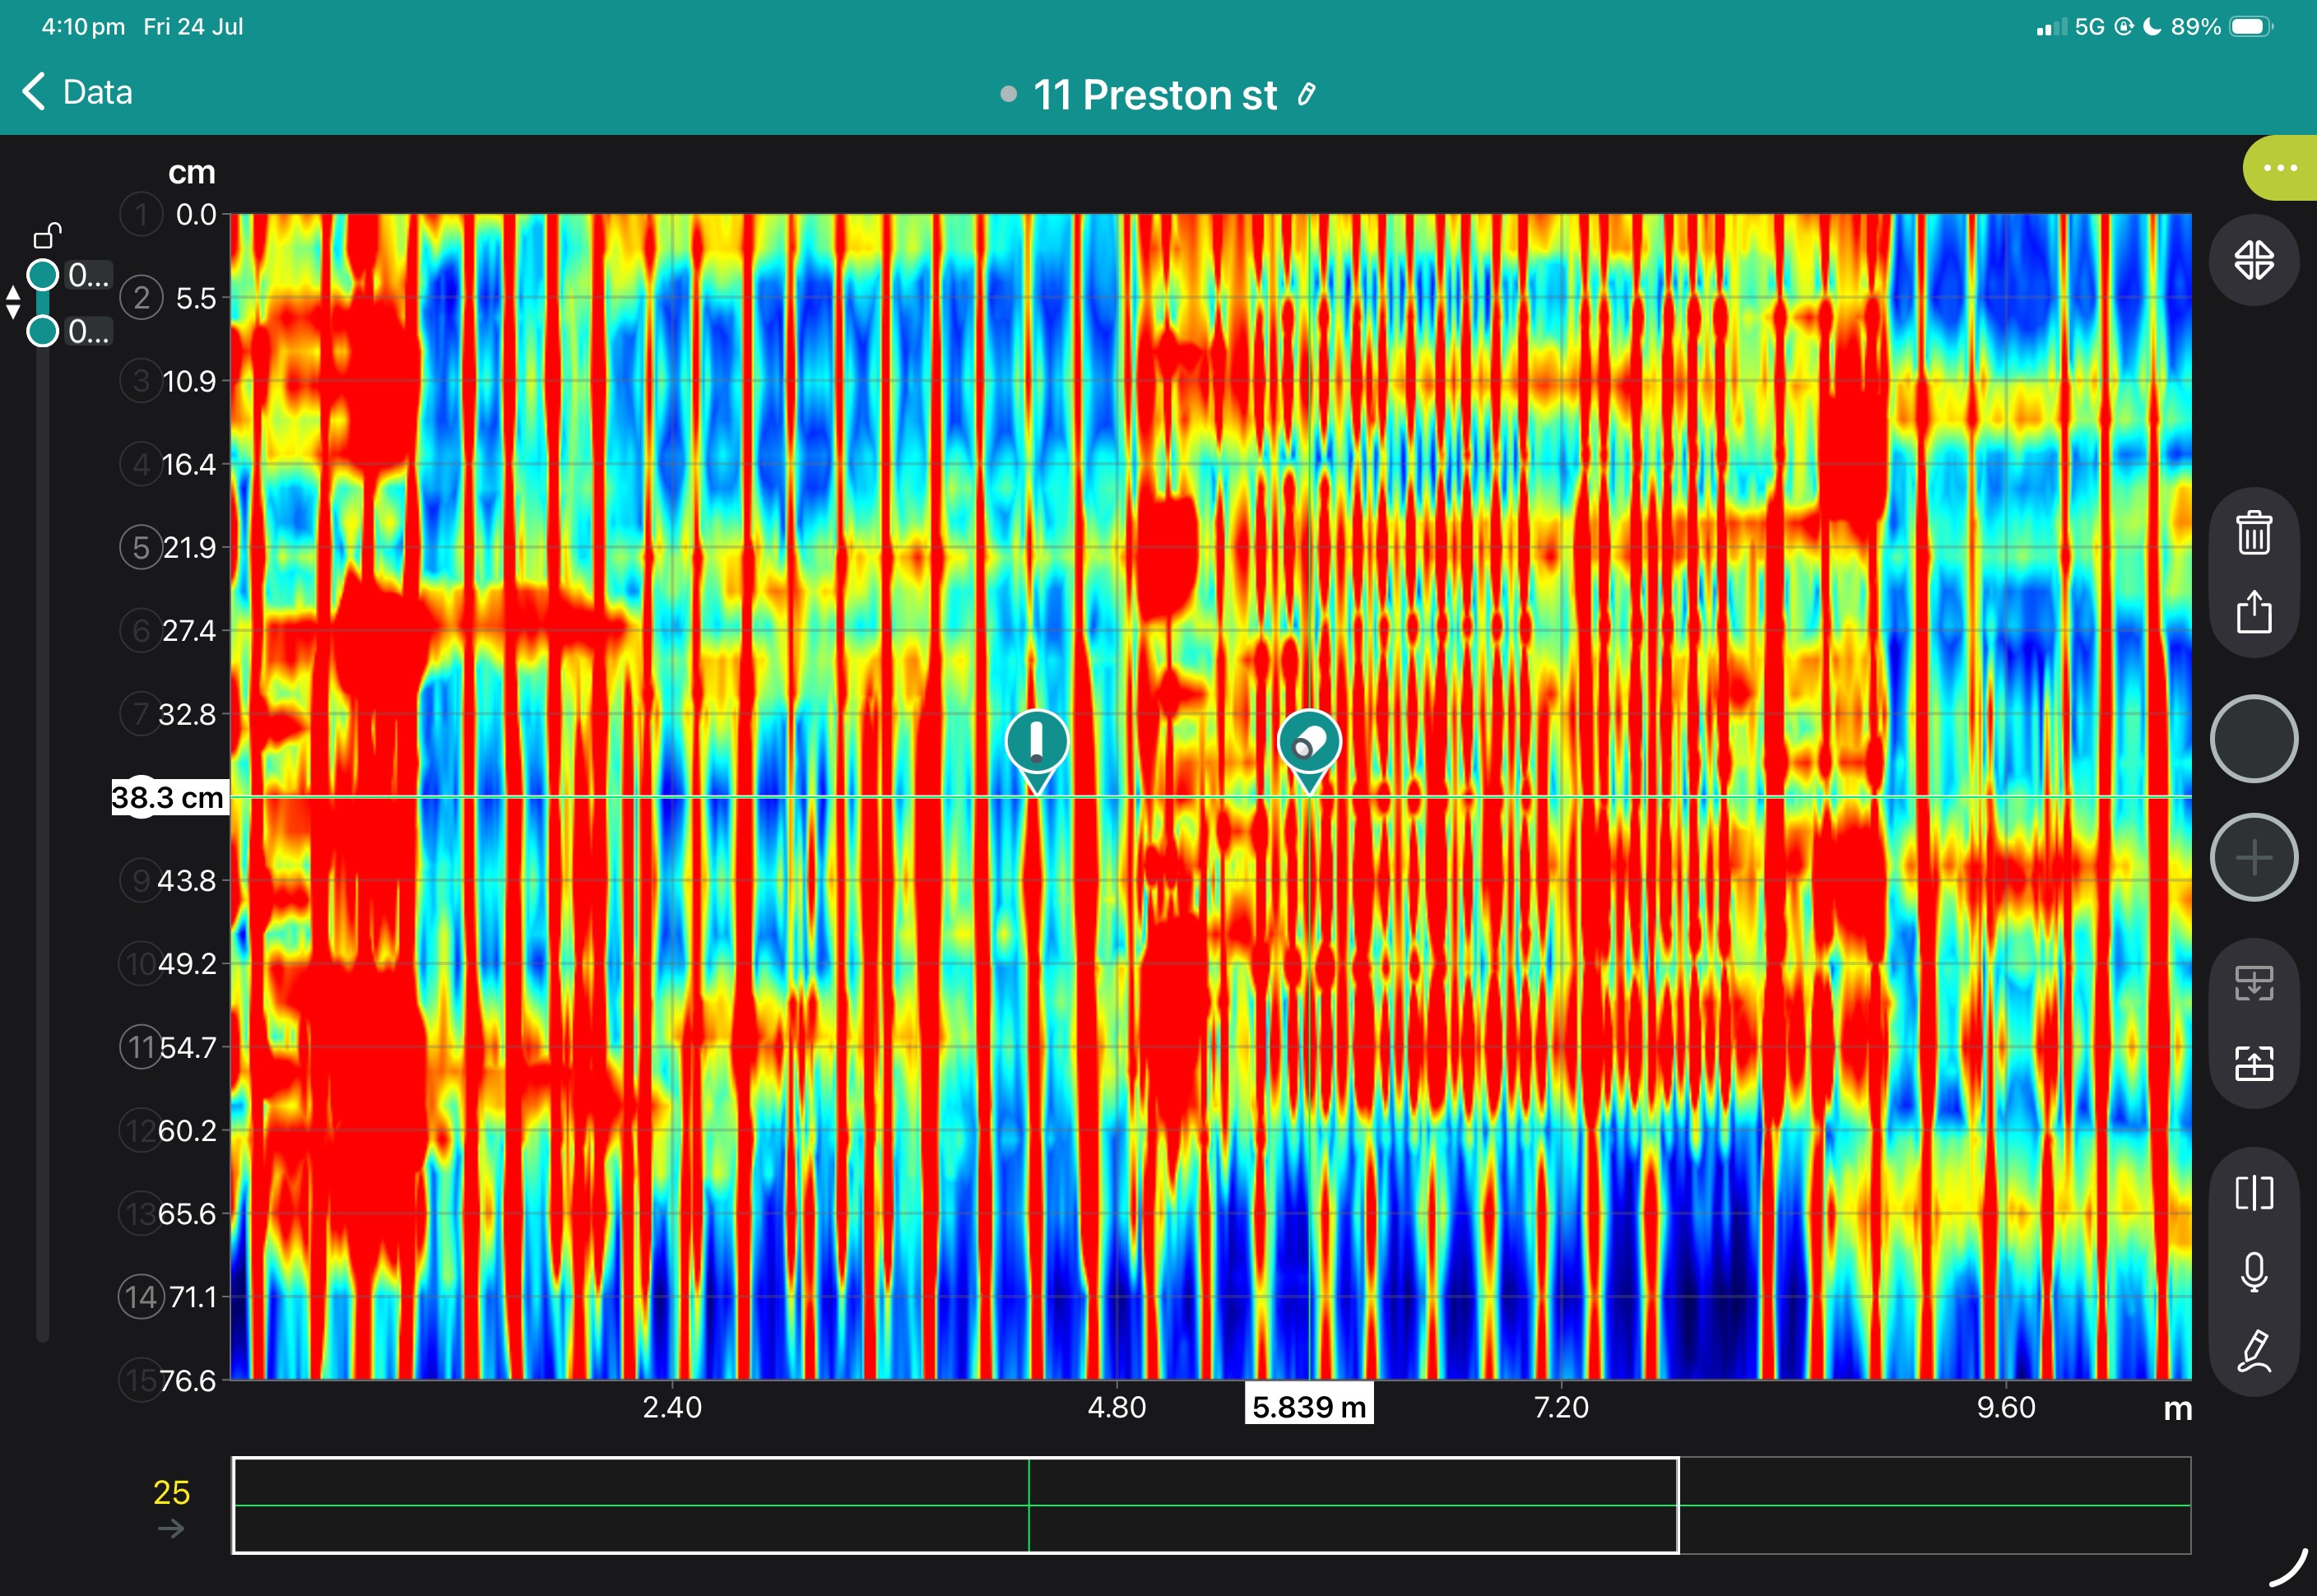
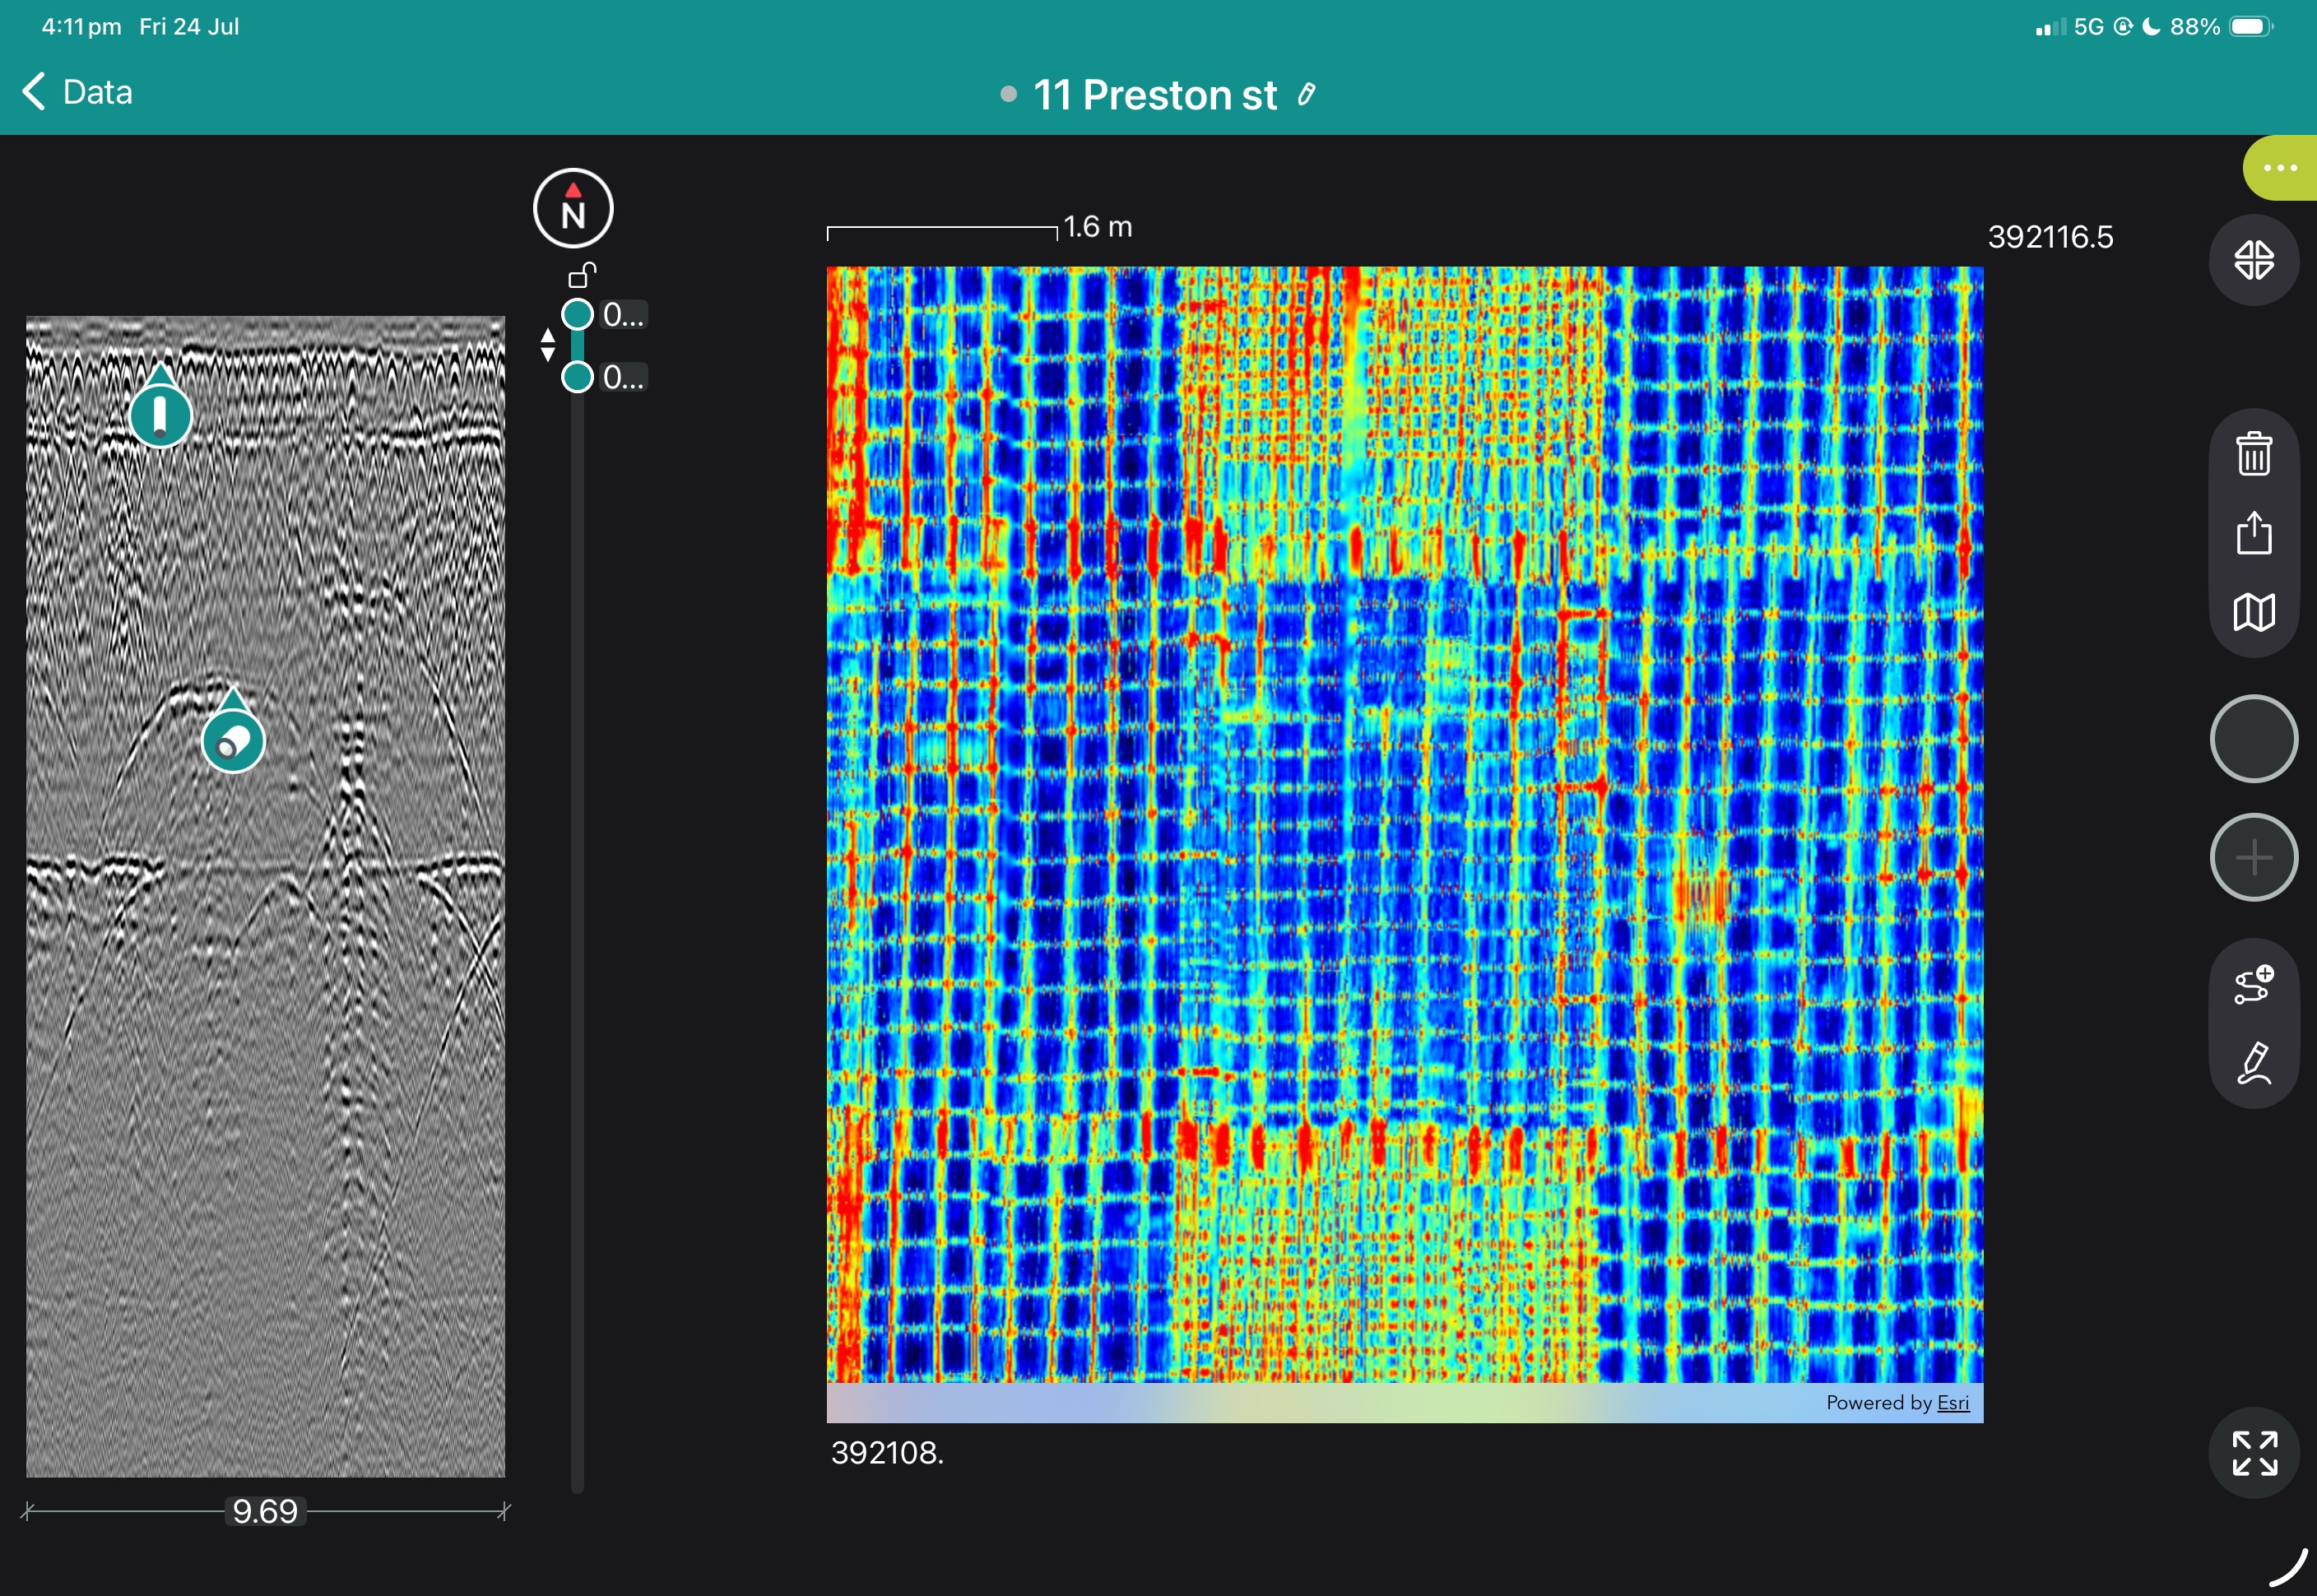
View some of these features at work below, and our case study if you'd like to see more of what the GS9000 can do.




Book a Structural Assessment Demonstration
GS9000 cart with:
Printable GPR Augmented Reality Marker, for use with AR Grid Scans.
GPR Grid Paper with 10 cm grid spacing.
GPR Grid Paper - 5cm Grid Spacing