%20vector%20logo.svg)


Phone: 02 9453 9999 or Email: sales-operations@pcte.com.au

The Silver Schmidt Live is the latest version of Proceq's Q Value Rebound Hammer. Schmidt hammers are most commonly used for evaluating the strength and uniformity of concrete. Part of the Live instrument family from Proceq, the new iOS and Android application records measurements and supports instant reporting and information sharing between users.
Overview | GX1 vs GX2 | SUE & Utilities | Structures & Pavements | Software & Outputs | Case Studies | Specifications | Support
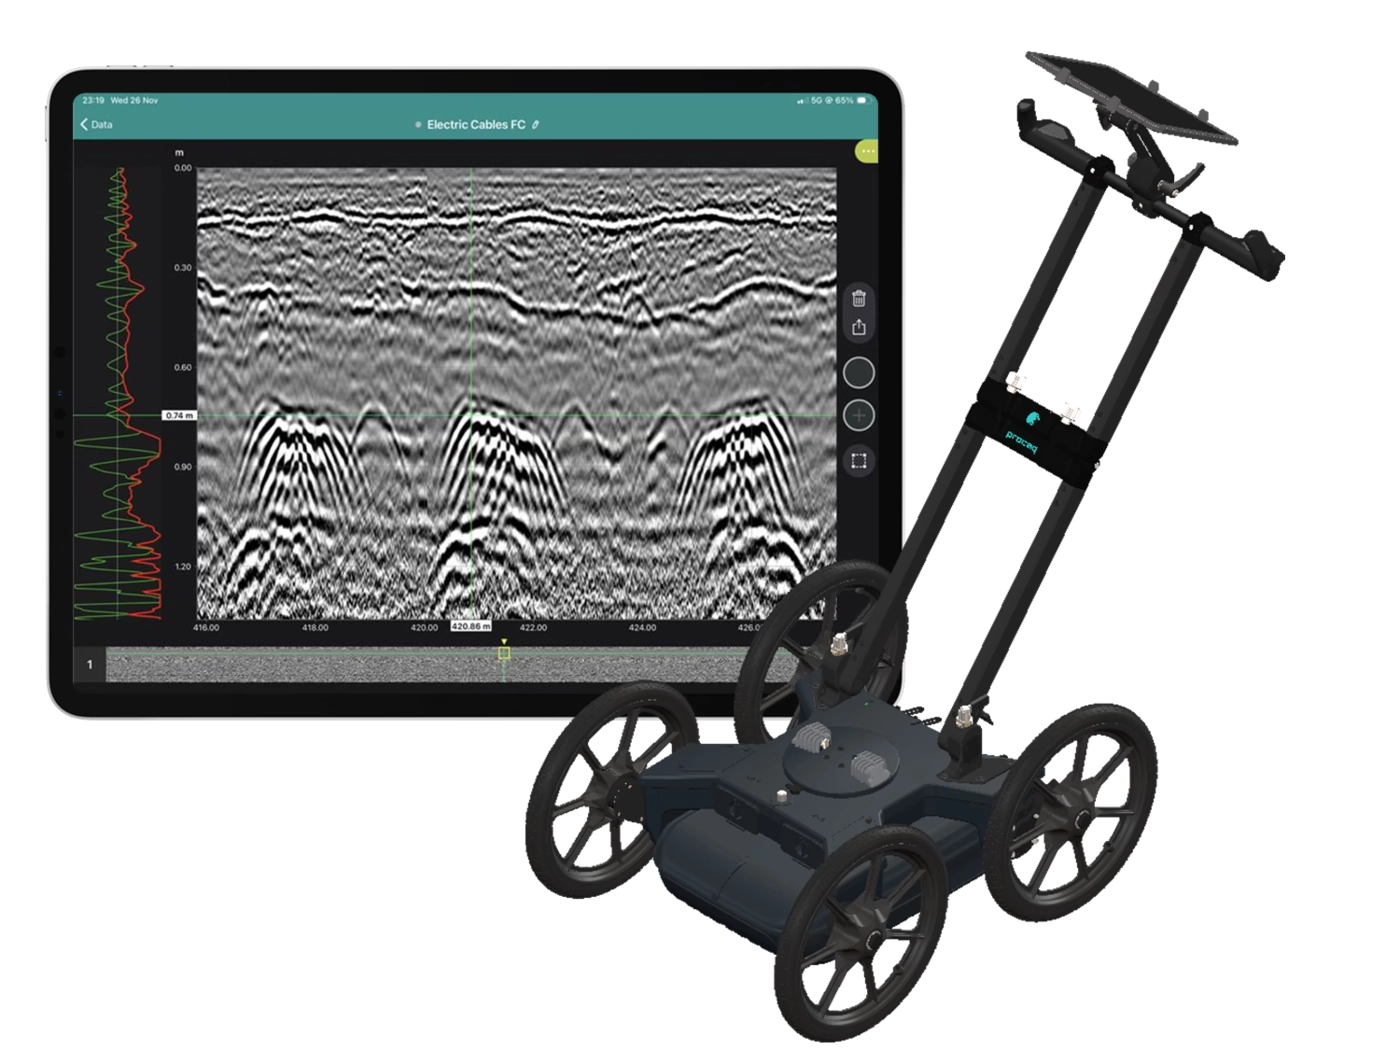
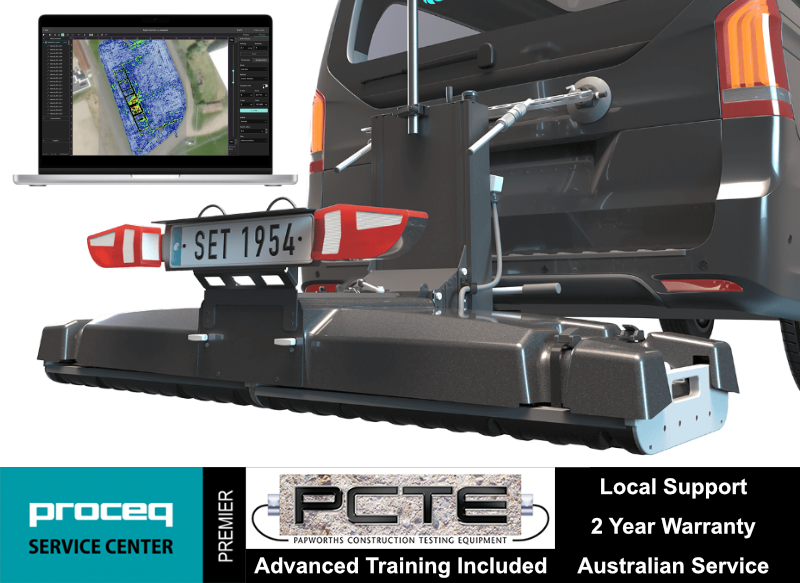
Collect high-density, georeferenced GPR data across wide areas and view the subsurface in 3D as you scan. Choose the GX2 array for SUE and utility mapping, or the GX1 array for structural, bridge and pavement investigations.
Best suited to:
Best suited to:
Recommended array: GX2
Recommended array: GX1
Cover more ground
Collect multiple parallel profiles in one pass instead of uilding a grid line by line.
See results during acquisition
View georeferenced radargrams and time-slice information in the field rather than waiting until the data is returned to the office.
Produce repeatable mapped data
Combine wheel-positioned GPR data with GNSS, project coordinates and survey linework.
Use one platform for two very different applications
Exchange GX1 and GX2 arrays without purchasing two complete cart platforms.
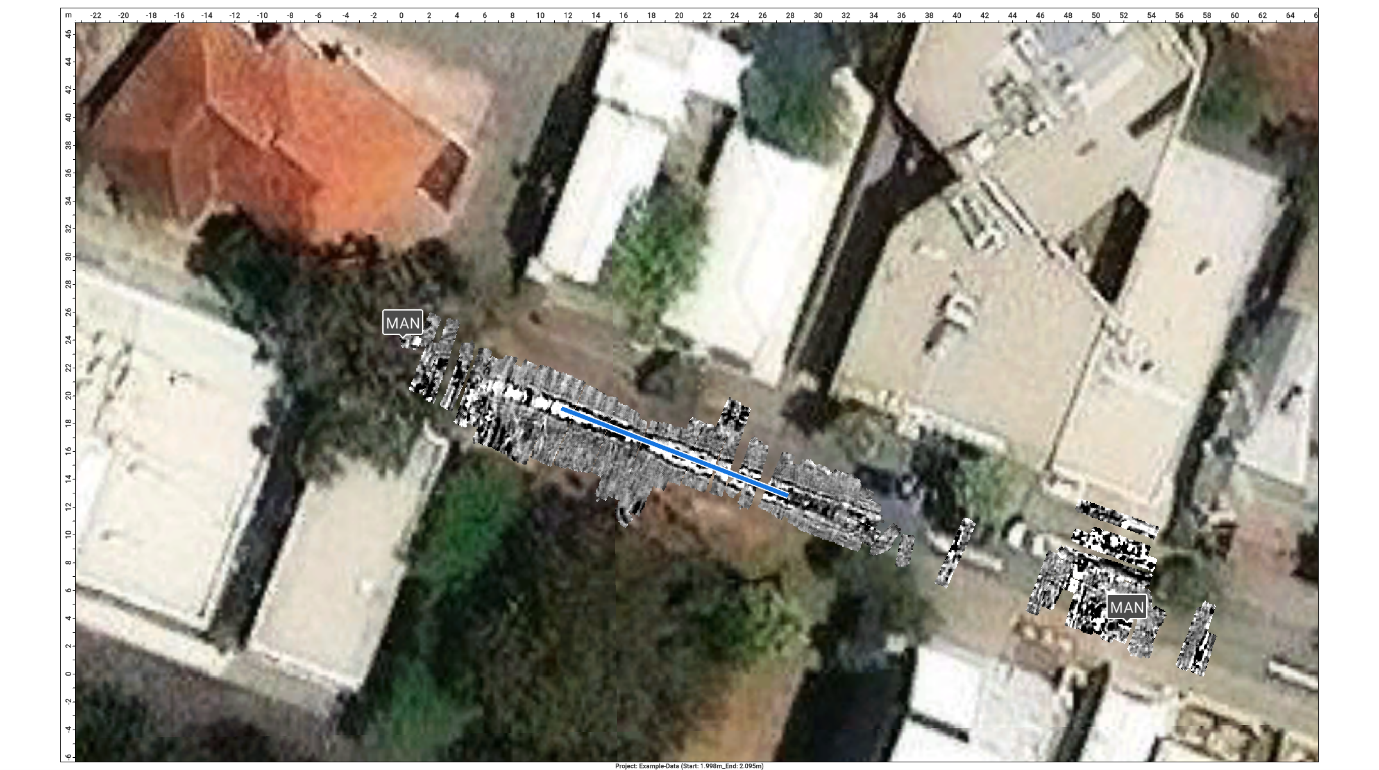
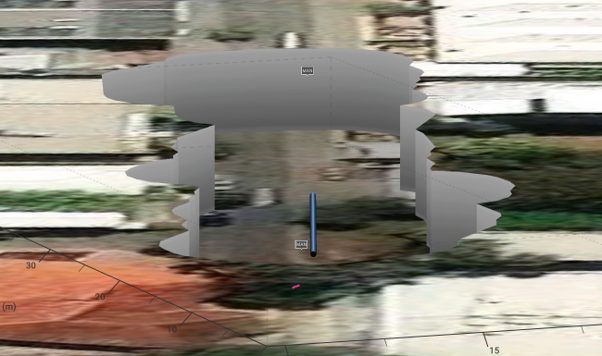
The GX2 transforms the GS9000 into a high-density subsurface utility mapping system. Its 11-channel, low-frequency GPR array captures an 83 cm-wide swath in each pass, helping operators detect and map buried pipes, ducts, cables, voids and other subsurface features. Live georeferenced data lets SUE teams review coverage on site and produce accurate CAD, GIS and project-coordinate deliverables.
1. Plan the survey
Load satellite imagery, CAD information, project coordinates or survey control.
2. Collect dense multichannel data
Survey an approximately 0.82 m-wide swath with 11 channels in each pass.
3. Review data live
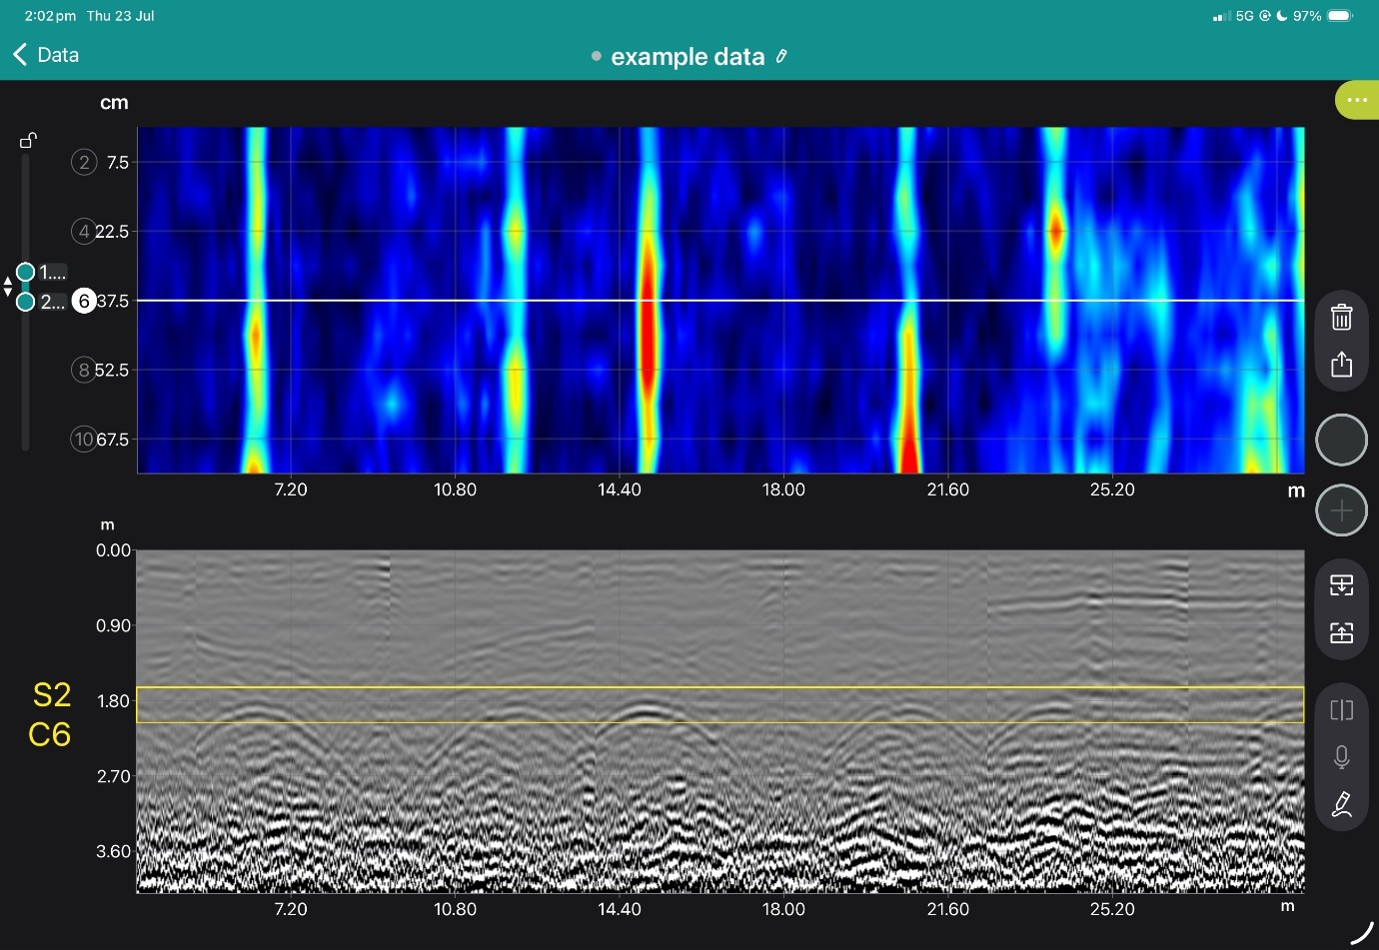
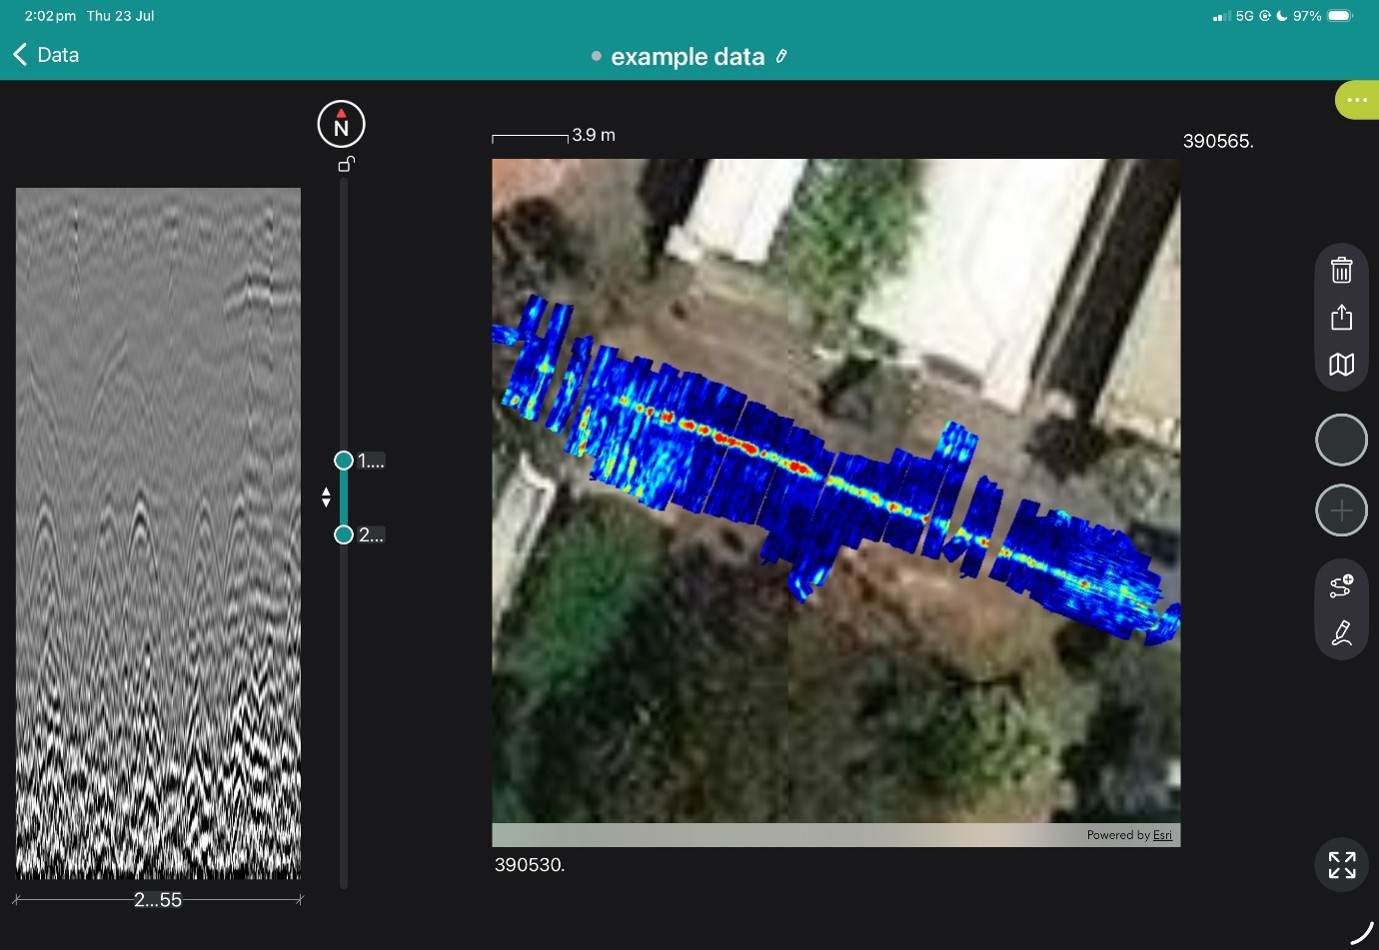
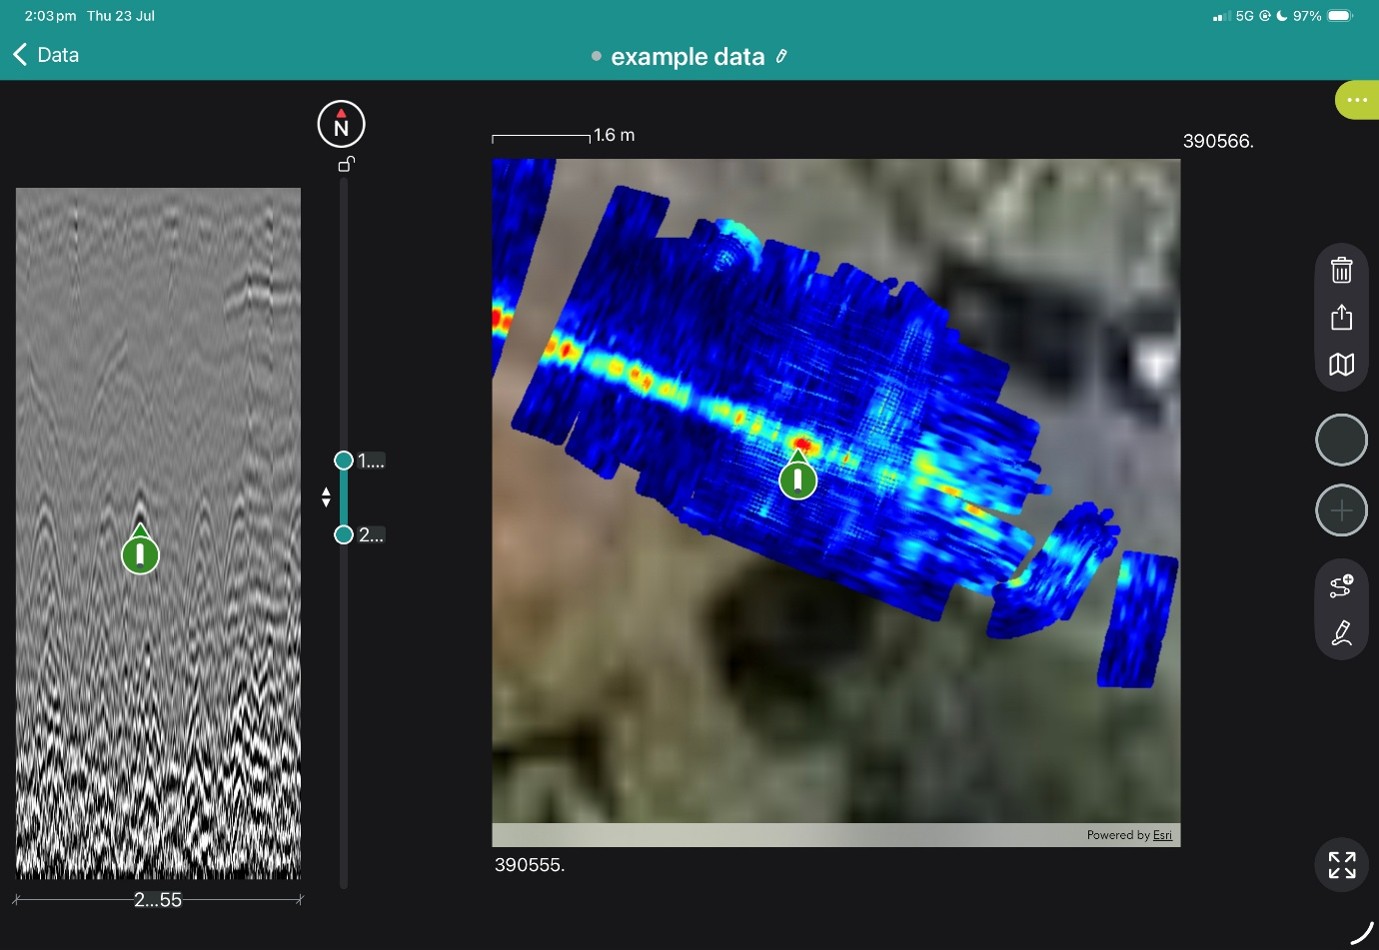
Examine radargrams, georeferenced time slices and marked features while still on site.
4. Interpret and digitise
Add points, linework, tags, photographs and field observations.
5. Process and deliver
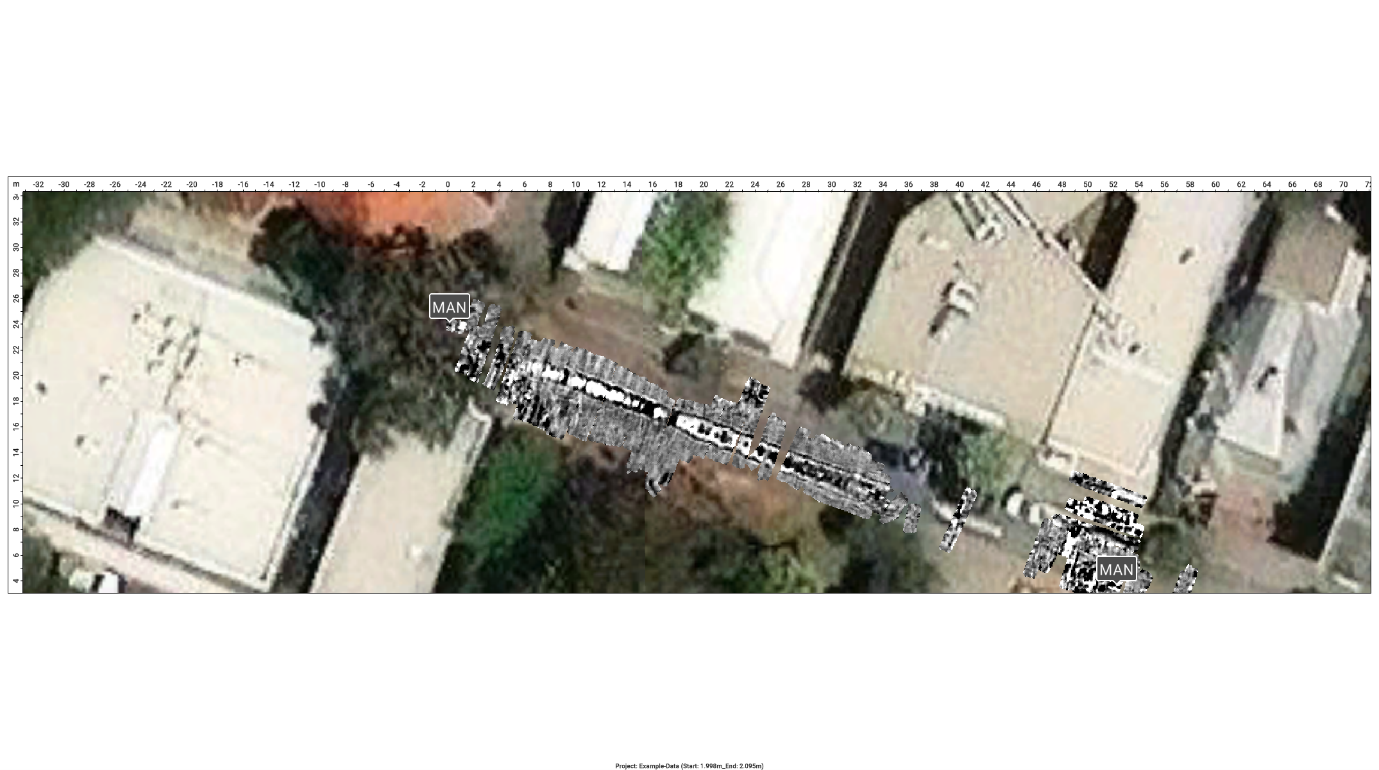
Merge survey areas, apply processing and export mapped information for the customer’s CAD, GIS or reporting workflow.
View the images below to see these in action.

Classical rebound hammers are often used to evaluate the strength of in-situ concrete, but such hammers suffer from the following insufficiencies:
1. The rebound value is dependent on the impact direction.
2. The rebound value is affected by internal friction.
3. Limited tightness of sealing causes premature loss of accuracy.
The unique design and high quality construction of the Silver Schmidt address all of these issues and makes Schmidt hammer testing quicker and more accurate than ever before.
Conversion curves are provided for a wide range of concrete compressive strength, including low and high strength concrete fc <10 MPa (5MPa using Mushroom Head) and up to 100MPa.
The iOS and Android application supports visual report generation with lists, bar charts and statistical information. Single or multiple series can be exported to .csv or as a .pdf report.
The Logbook function allows the operator to make notes, take photos and records his GPS geolocation with each measurement series.
Type L hammers strike with a lower impact energy and are suitable for testing of thin concrete sections and where the hammer is to be used primarily for low strength concretes down to 10mpa.
If concrete is softer than this the Mushroom Head accessory spreads the impact over a wider area and is suitable for testing concrete strengths as low as 5mpa.
The Rock Schmidt is a dedicated version of the Silver Schmidt for rock testing applications, including correlations to unconfined compressive strength (UCS), youngs modulus and weathering grade.
The classic "R"-value is the mechanical travel of the mallet on rebound. It is affected by its friction on the guide rod, the friction of the gauge, gravity, the relative velocity between unit and mechanical parts. This is true for all concrete test hammers currently on the market.
The Silver Schmidt acquires the "Q"-value by measuring the velocity (V) of impact and of rebound immediately before and after the impact. The "Q"-value need not be corrected for impact direction. There is a
The "Q"-value [=rebound V divided by inbound V] represents the physical rebound coefficient. It is virtually free of all the above error sources. It is thus the indicator of choice to be used as a basis to convert to compressive strength.
The lightweight hybrid design of the impact plunger is made from aerospace alloy, matched to the elastic properties of the concrete and equipped with a hardened steel cap. Independent validation testing by BAM in Berlin has shown the Silver Schmidt to have less dispersion than the classical hammer over the entire range.
Proceq's Schmidt Live web based reporting tool allows operators and their colleagues to review data collected in the field with a Silver Schmidt Live. It presents the measurements, statics and conversion into engineering units. The Logbook details can also be reviewed.
A lower 10th percentile curve is recommended by the major standards EN 13791 and ASTM C805/ACI 228.1 to provide a safety margin to take into account the various factors that may affect the in-situ tests. 90% of the data pairs lie above the curve and 10% lie below. This curve is intended to give a conservative estimate in those cases that the hammer is not calibrated for the specific mix under test. For older hammers firmware release v1.0.3 adds the new curve to your hammer.
Data collection and processing of test results comply with major industry standards: EN 12504-2, ENV 206 ASTM C805, ASTM D5873 (Rock), BS 1881, part 202
Book a SUE Workflow Demonstration
The GX1 transforms the GS9000 into a high-resolution structural assessment system for concrete slabs, bridge decks and pavements. Its dense, dual-polarisation array captures detailed 3D data across wide areas, supporting reinforcement and cover mapping, moisture and deterioration assessment, and analysis of asphalt and pavement layers. Live visualisation helps confirm survey coverage on site, while post-processing tools produce clear, report-ready condition maps.
1. Define the inspection area
Import the structure, bridge, pavement or survey background.
2. Collect closely spaced profiles
Capture 35 longitudinal and 15 cross-polarised channels with dense spacing.
3. Review coverage in the field
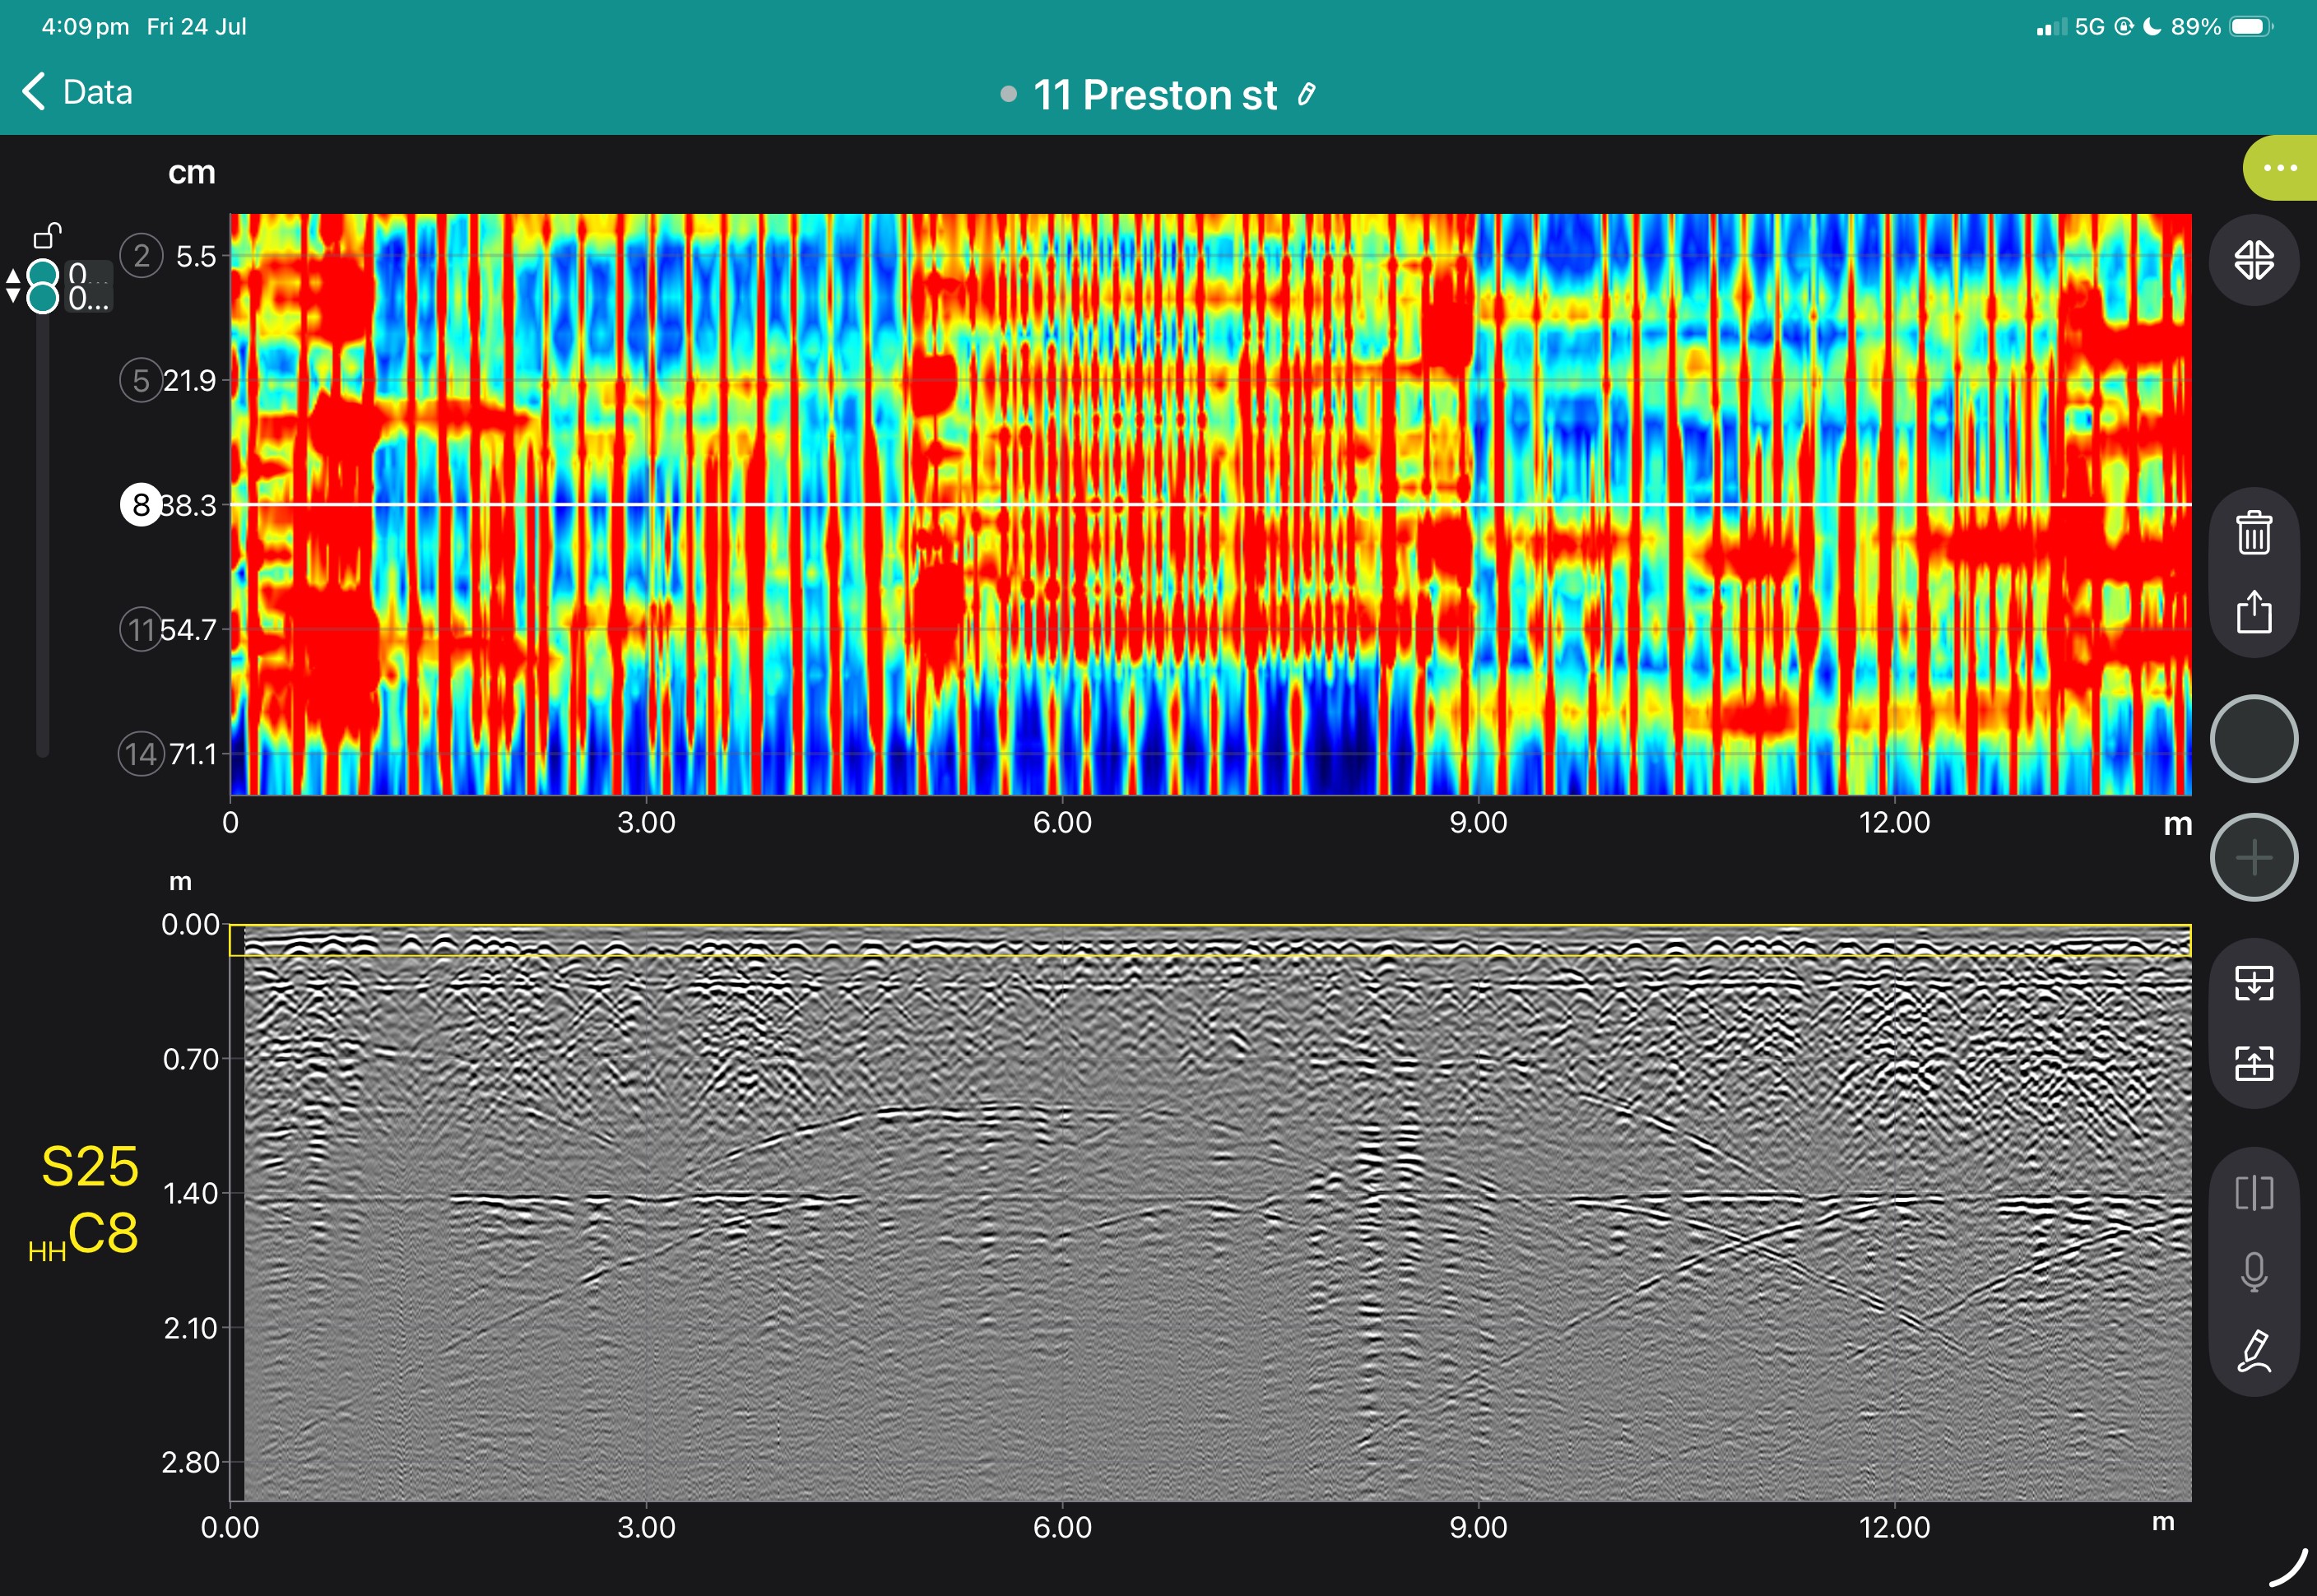
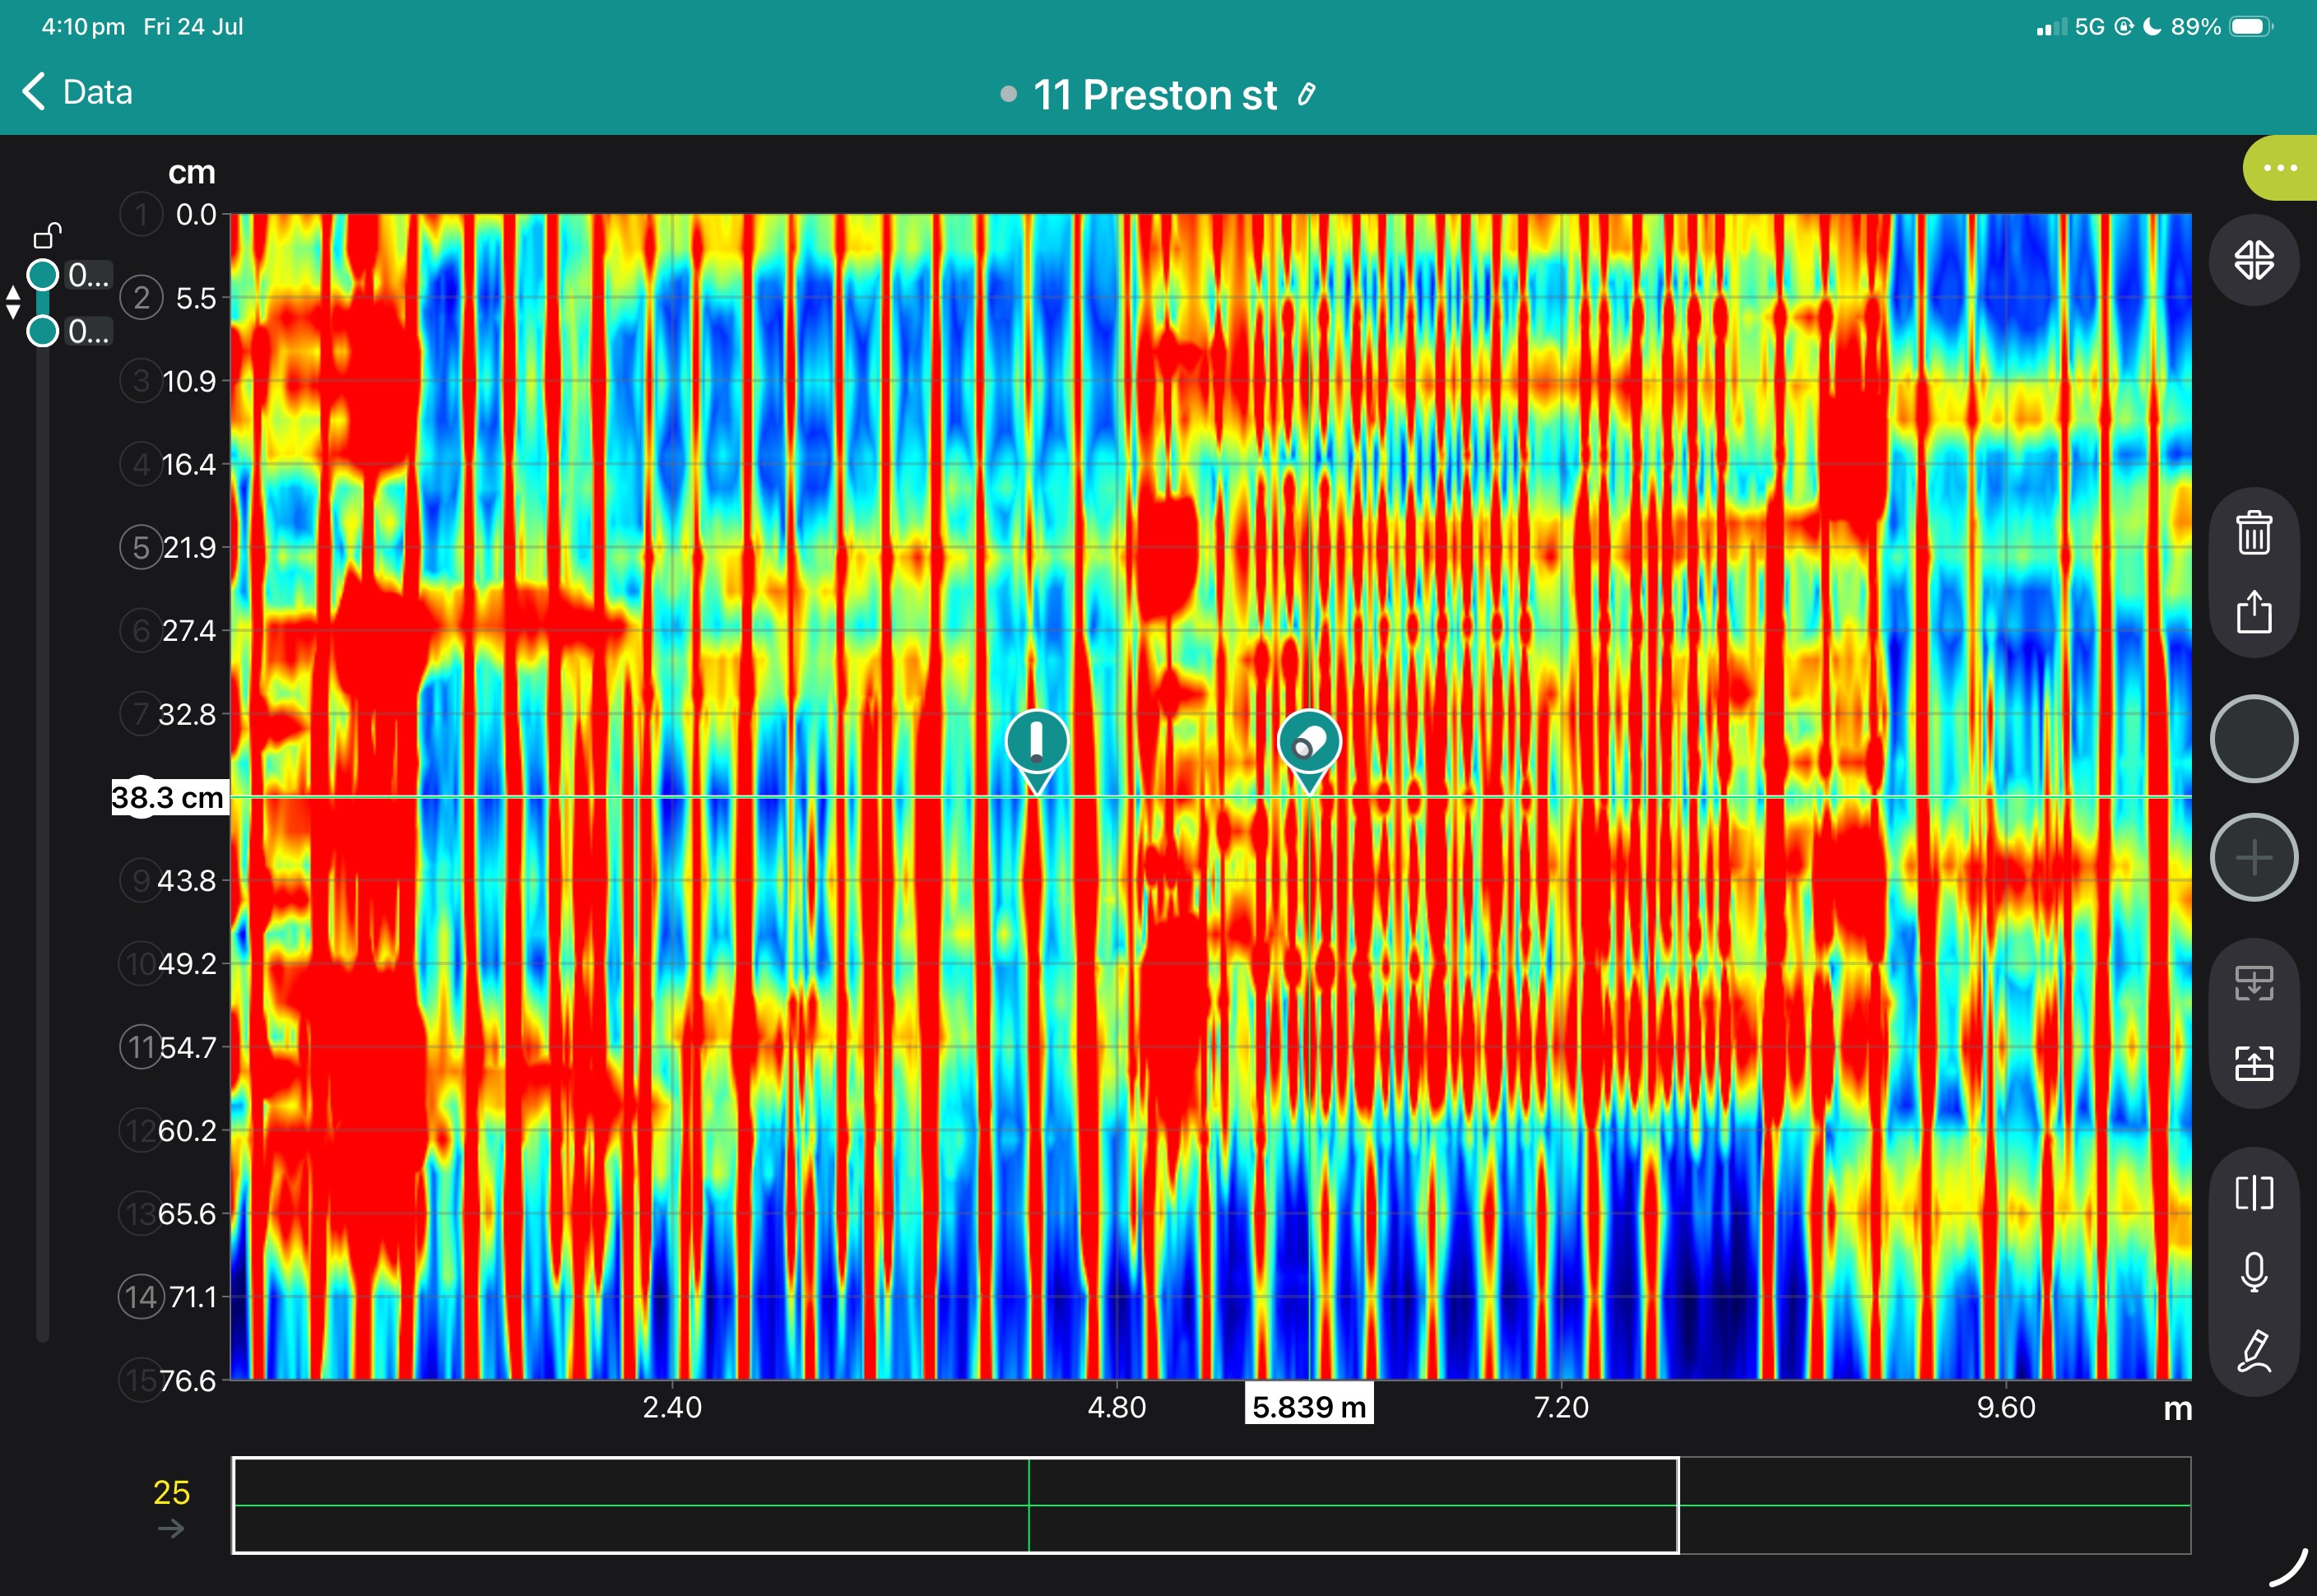
Use live radargrams and time slices to confirm that the required area has been captured.
4. Process the dataset
Apply velocity, gain, background removal, migration, filtering and topographic correction as appropriate.
5. Generate diagnostic maps
Create depth slices, reinforcement maps, layer information or application-specific condition maps.
6. Integrate with the engineering assessment
Export figures, mapped anomalies and raw data for inclusion in the engineer’s final interpretation and report.
Field information
Processed Diagnostic Information
Engineering deliverables
View some of these features at work below, and our case study if you'd like to see more of what the GS9000 can do.




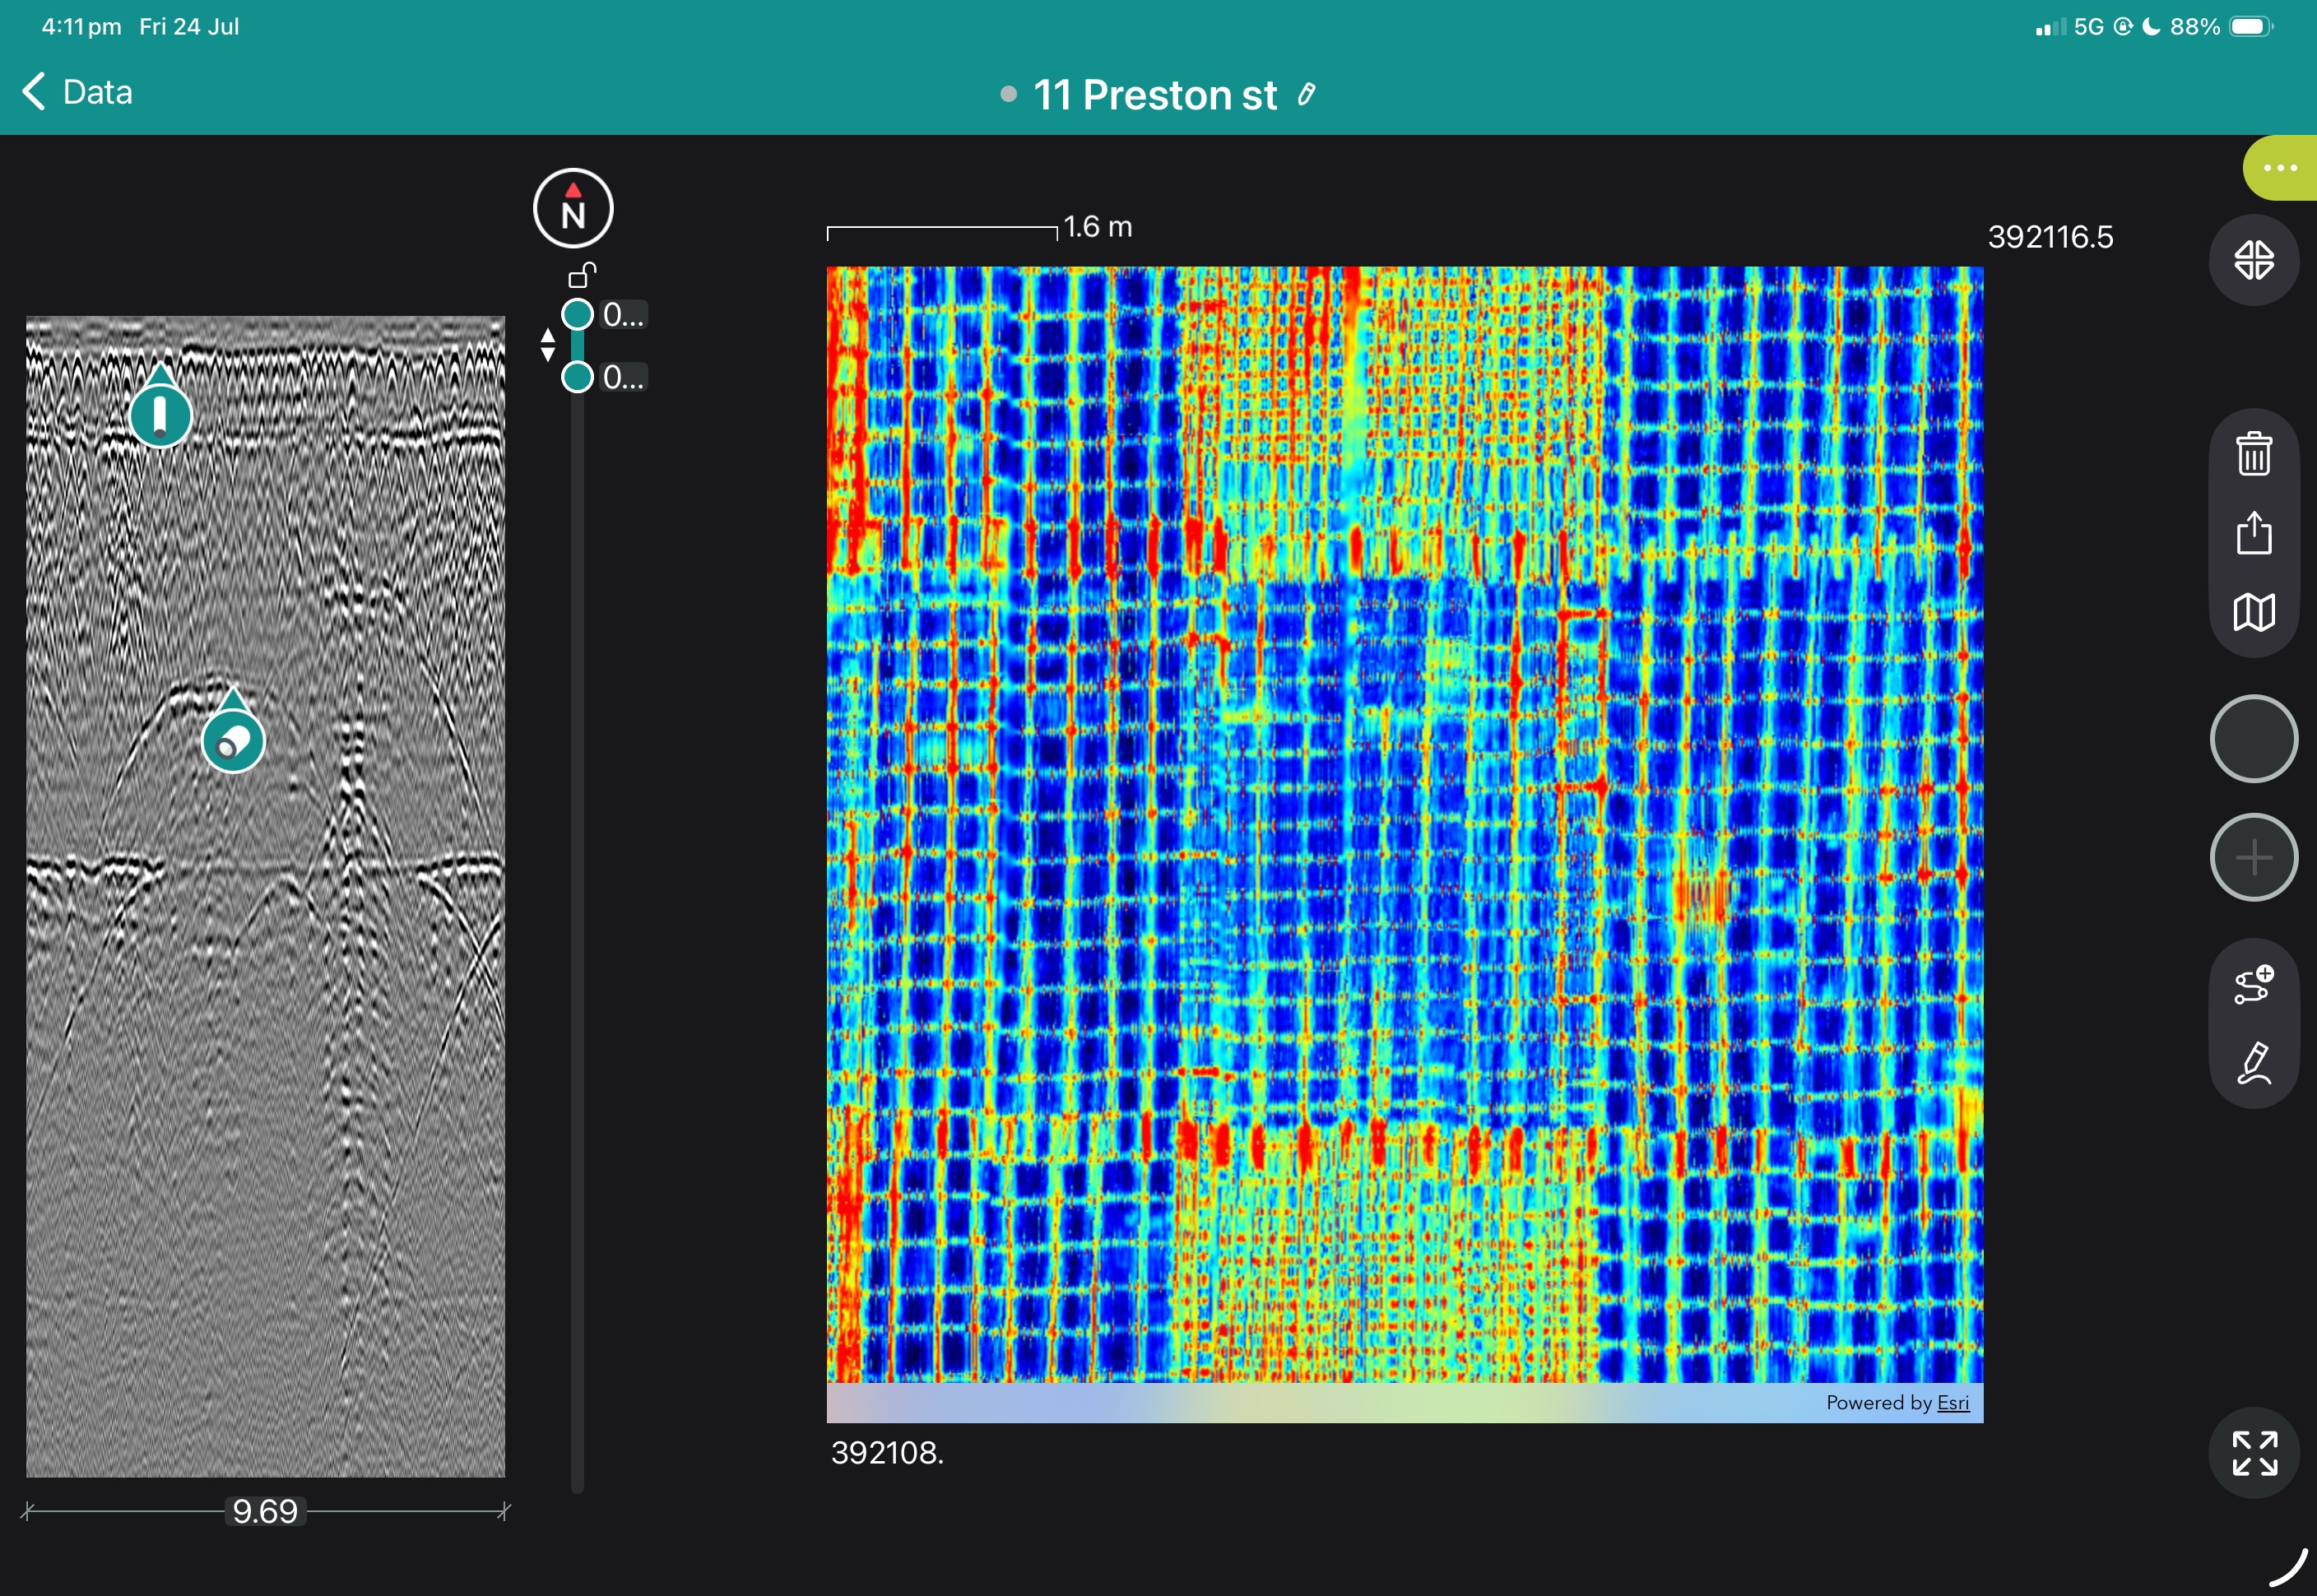
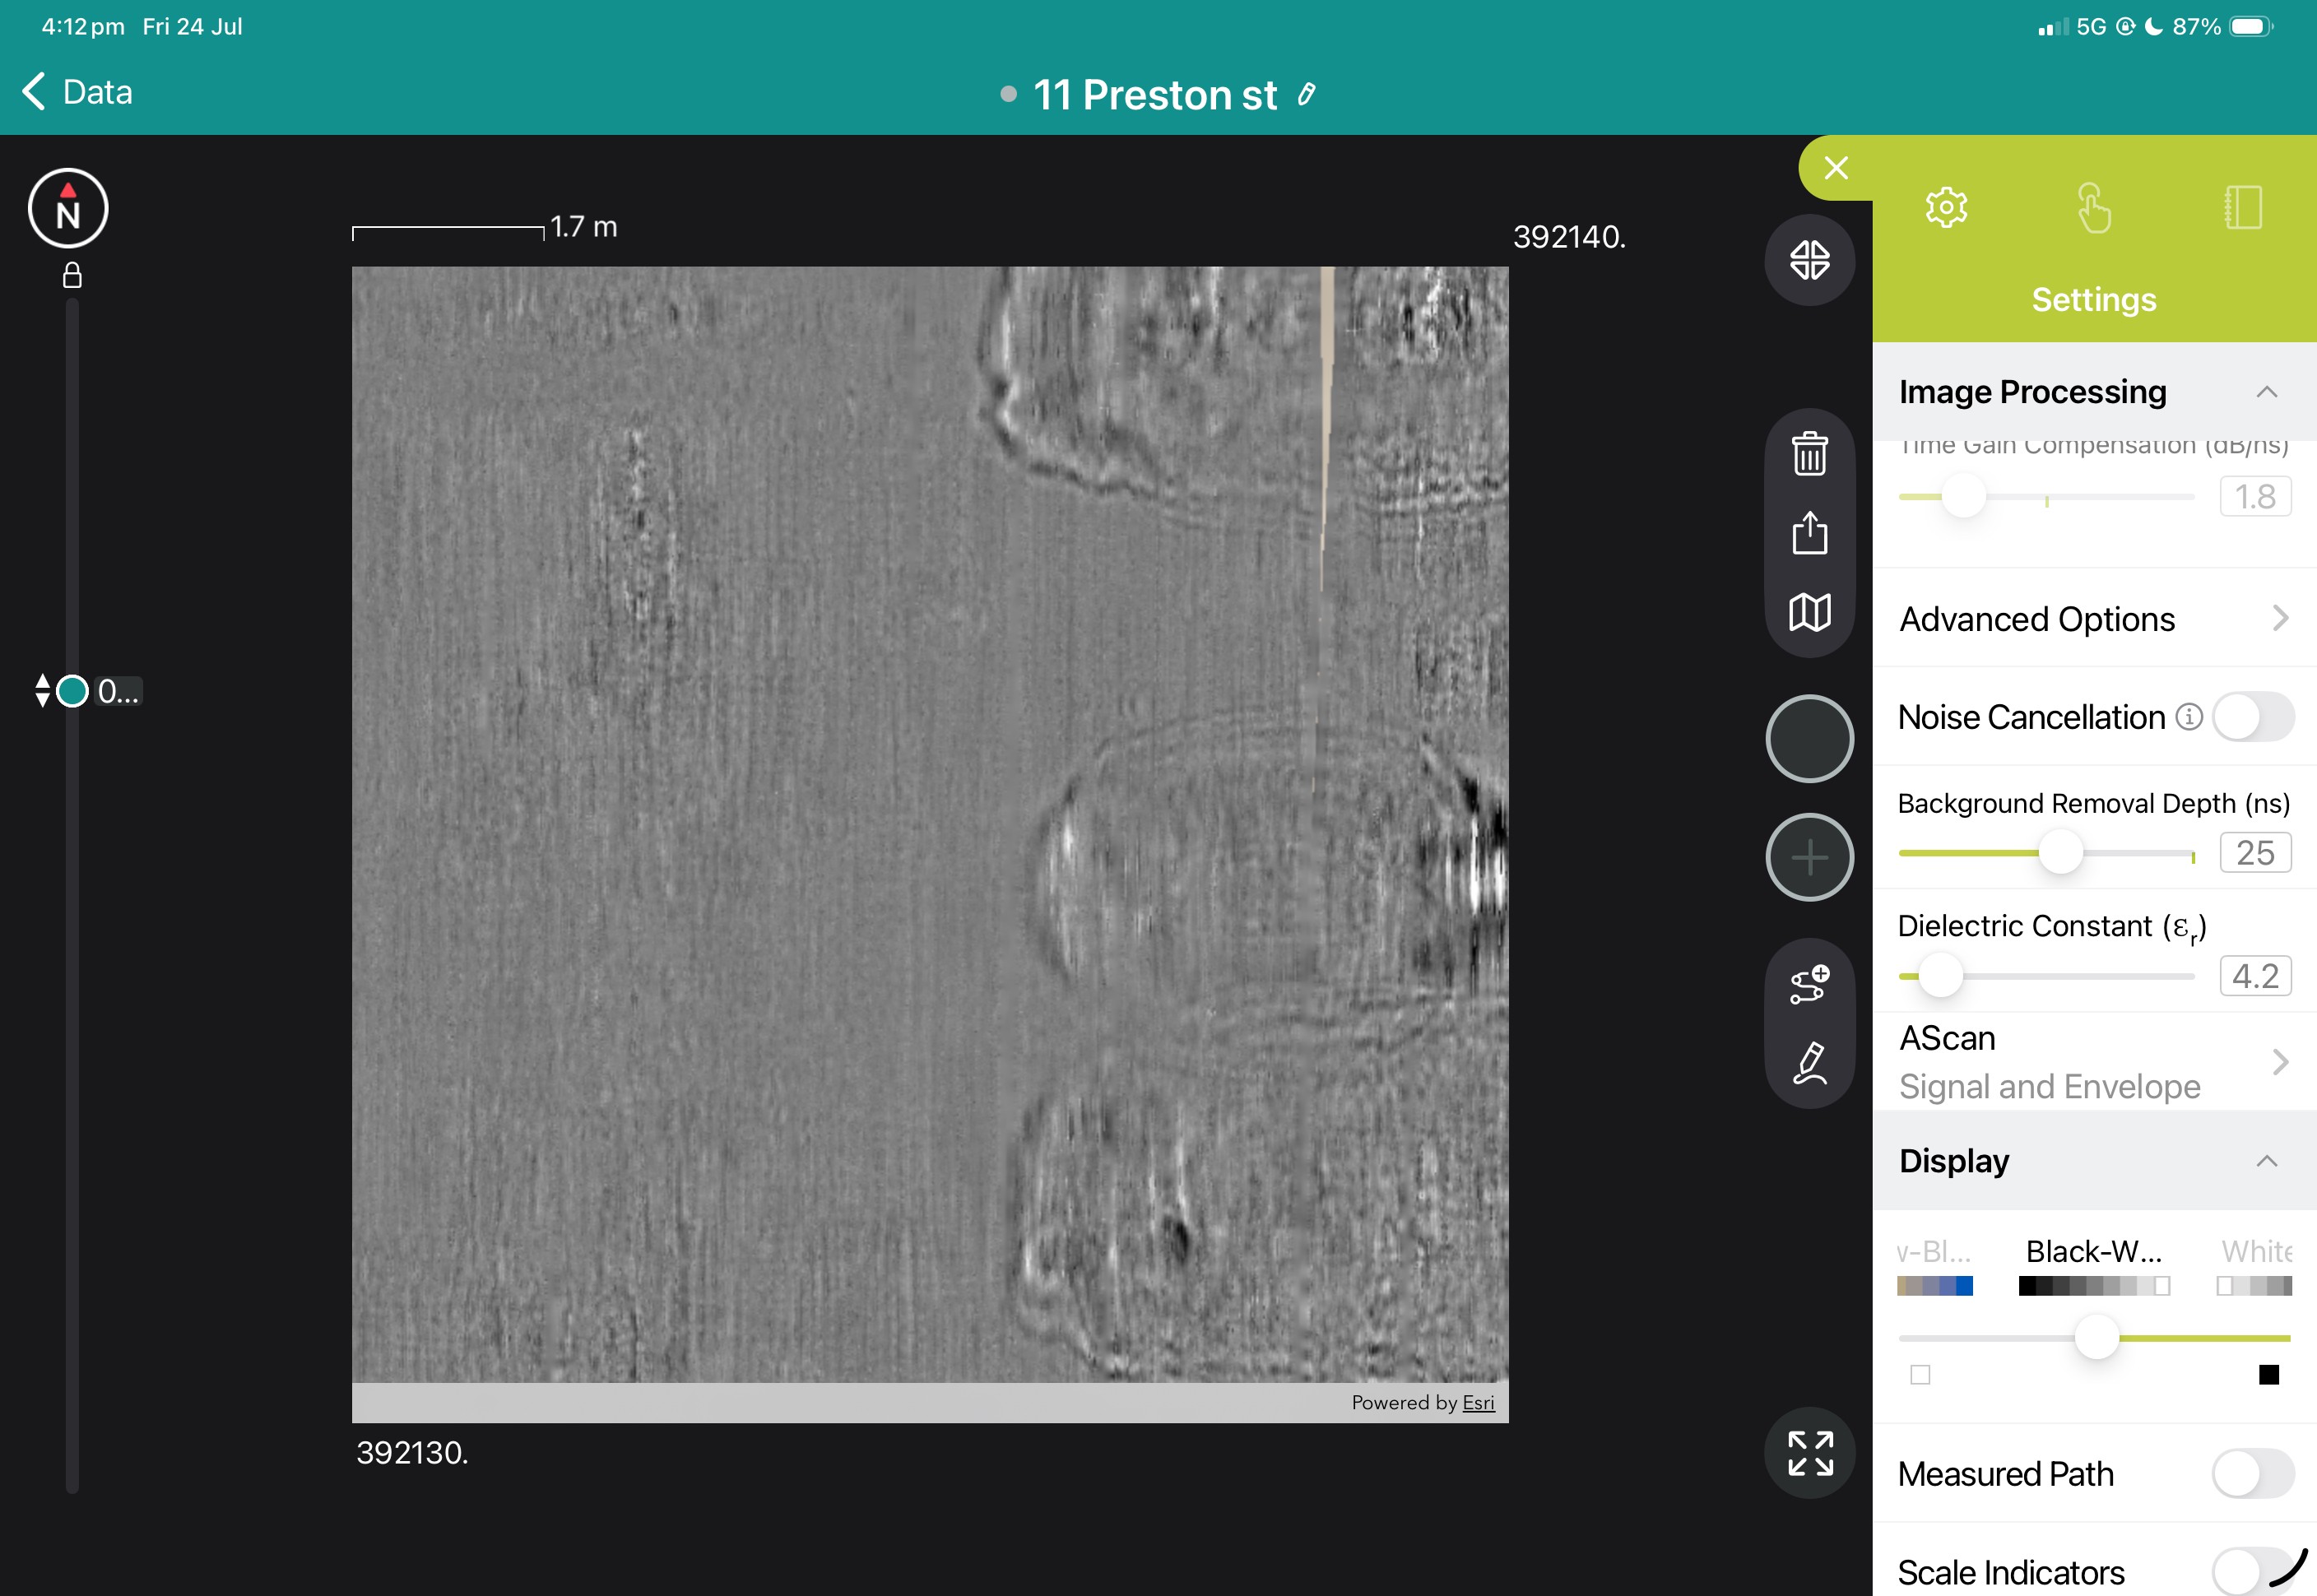
Book a Structural Assessment Demonstration
GS9000 cart with:

This document describes the process of creating a custom conversion curve for an Original Schmidt or Silver Schmidt Hammer.